4300
Time-dependent and anisotropic diffusion in the heart: linear and spherical tensor encoding with varying degree of motion compensation1Random Walk Imaging, Lund, Sweden, 2Danish Research Centre for Magnetic Resonance, Centre for Functional and Diagnostic Imaging and Research, Copenhagen University Hospital Hvidovre, Copenhagen, Denmark, 3Clinical Sciences, Lund University, Lund, Sweden, 4Harvard Medical School, Boston, MA, United States, 5Brigham and Women's Hospital, Boston, MA, United States, 6Leeds Institute of Cardiovascular and Metabolic Medicine, University of Leeds, Leeds, United Kingdom
Synopsis
Spherical tensor encoding (STE) can potentially shorten acquisition of mean diffusivity (MD) compared to the traditional linear tensor encoding (LTE). To avoid negative effects of motion, e.g. in the heart, motion compensation is needed. However, motion compensation requires altering diffusion gradient waveforms and their sensitivities to time-dependent diffusion. To exclude motion, we first investigated LTE and STE with different degrees of motion compensation in ex vivo pig hearts. We observed significantly different MD, which can be attributed to time-dependent diffusion and microscopic diffusion anisotropy. Our analysis suggests that time-dependent diffusion is a critical determinant of MD in the myocardium.
Introduction
Isotropic diffusion weighting1-3, also known as spherical tensor encoding (STE)4,5, could potentially accelerate the measurement of mean diffusivity (MD) at least two-fold compared to the traditional linear tensor encoding (LTE) approach6. Motion compensated diffusion encoding waveforms7-9 are often used to avoid motion artefacts, which are very challenging particularly in cardiac imaging. We have recently proposed a new STE strategy with simultaneous nulling of arbitrary diffusion encoding gradient moments and concomitant gradients10. Significantly different MD values could be obtained from different encoding protocols. Here we considered two sources affecting the estimated MD value: (1) the effect of time-dependent diffusion11-17, e.g. caused by restrictions and (2) the effects of microscopic diffusional anisotropy18-20. Effects of time-dependent diffusion depend on size of restrictions and spectral characteristics of encoding waveforms (diffusion times), even when equal encoding times are used15-17. The pronounced non mono-exponential signal decay due to microscopic anisotropy1,4,5,20,21 could negatively bias MD when relatively large b-values are used. Our analysis suggests that due to relatively large cardiomyocytes22, time-dependent diffusion is expected to be the dominant source of MD bias on clinical scanners. Restricted diffusion model fits well to the data across 13 different waveforms and can be used to estimate cell sizes.Restricted diffusion model
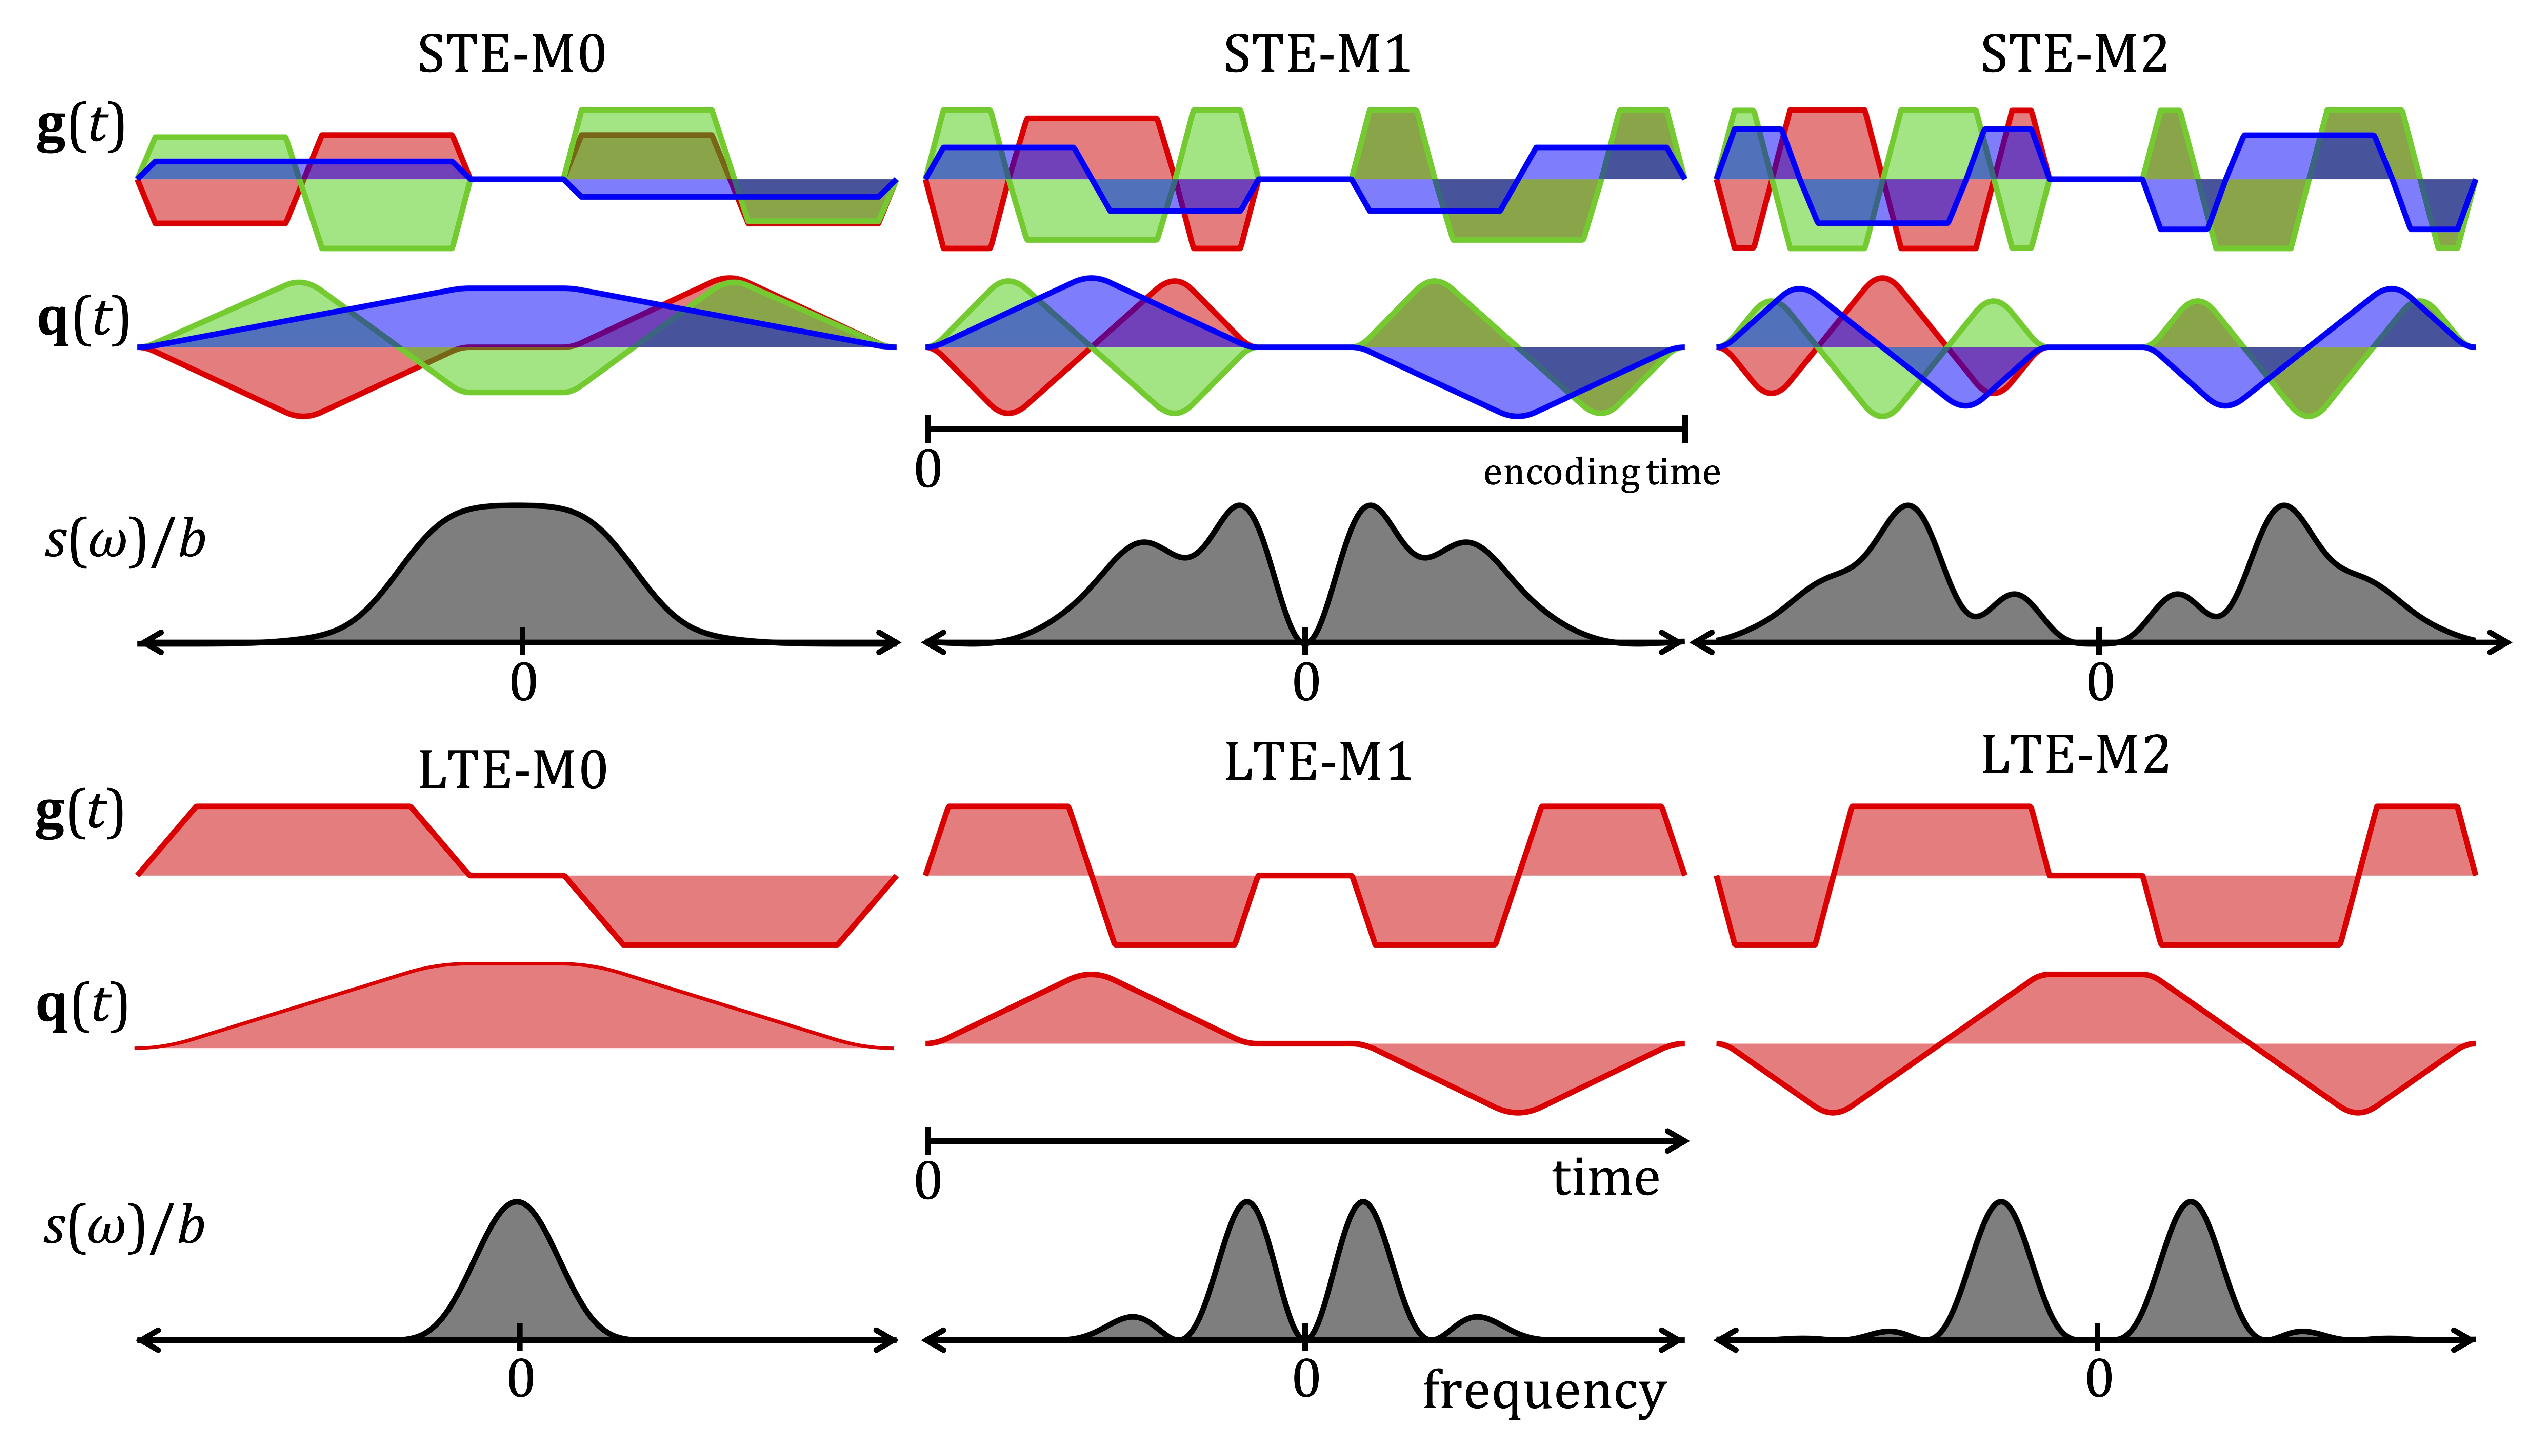
To fit data, we used the model of diffusion restricted in impermeable cylinders14,17. Diagonal components of diffusion spectra $$$D_{ii}(\omega,R)$$$ were computed for cylinders of varying radii $$$R$$$ (validated by Monte-Carlo simulations17. MD was computed from $$b\cdot\text{MD}(R)=\sum_{i=1}^3\int_{\infty}^{\infty}s_{ii}(\omega)\,D_{ii}(\omega,R)\,d\omega.$$ Here $$$s_{ii}(\omega)$$$ are diagonal elements of the dephasing cross power spectral density given by Fourier transforms of dephasing waveforms $$$q_{i}(t)$$$ as $$ s_{ij}(\omega)=q_{i}(\omega)\overline{q}_{j}(\omega).$$ The total encoding power, known as b-value, is given by the integral of spectral trace $$$s(\omega)$$$ over all frequencies $$b=\sum_{i=1}^3\int_{-\infty}^{\infty}s_{ii}(\omega)d\omega\equiv\int_{-\infty}^{\infty}s(\omega)d\omega.$$ The spectral trace, shown in Figure 1 for all waveforms, is thus the key parameter affecting MD.Data fitting
A two-compartment model was fitted globally to the data from 13 different encoding waveforms: $$\text{MD}_{\text{calc}}=f_{\text{res}}\text{MD}_{\text{res}}(R)+(1-f_{\text{res}})D_{\text{h}},$$ where $$$f_{\text{res}}$$$ is an apparent signal fraction from the restricted compartment and $$$D_{\text{h}}$$$ is an apparent diffusion coefficient for the compartment with hindered Gaussian diffusion. $$$D_0 = 2 \, \mu \text{m}^2/\text{ms}$$$ was used for $$$\text{MD}_{\text{res}}$$$.Experiments
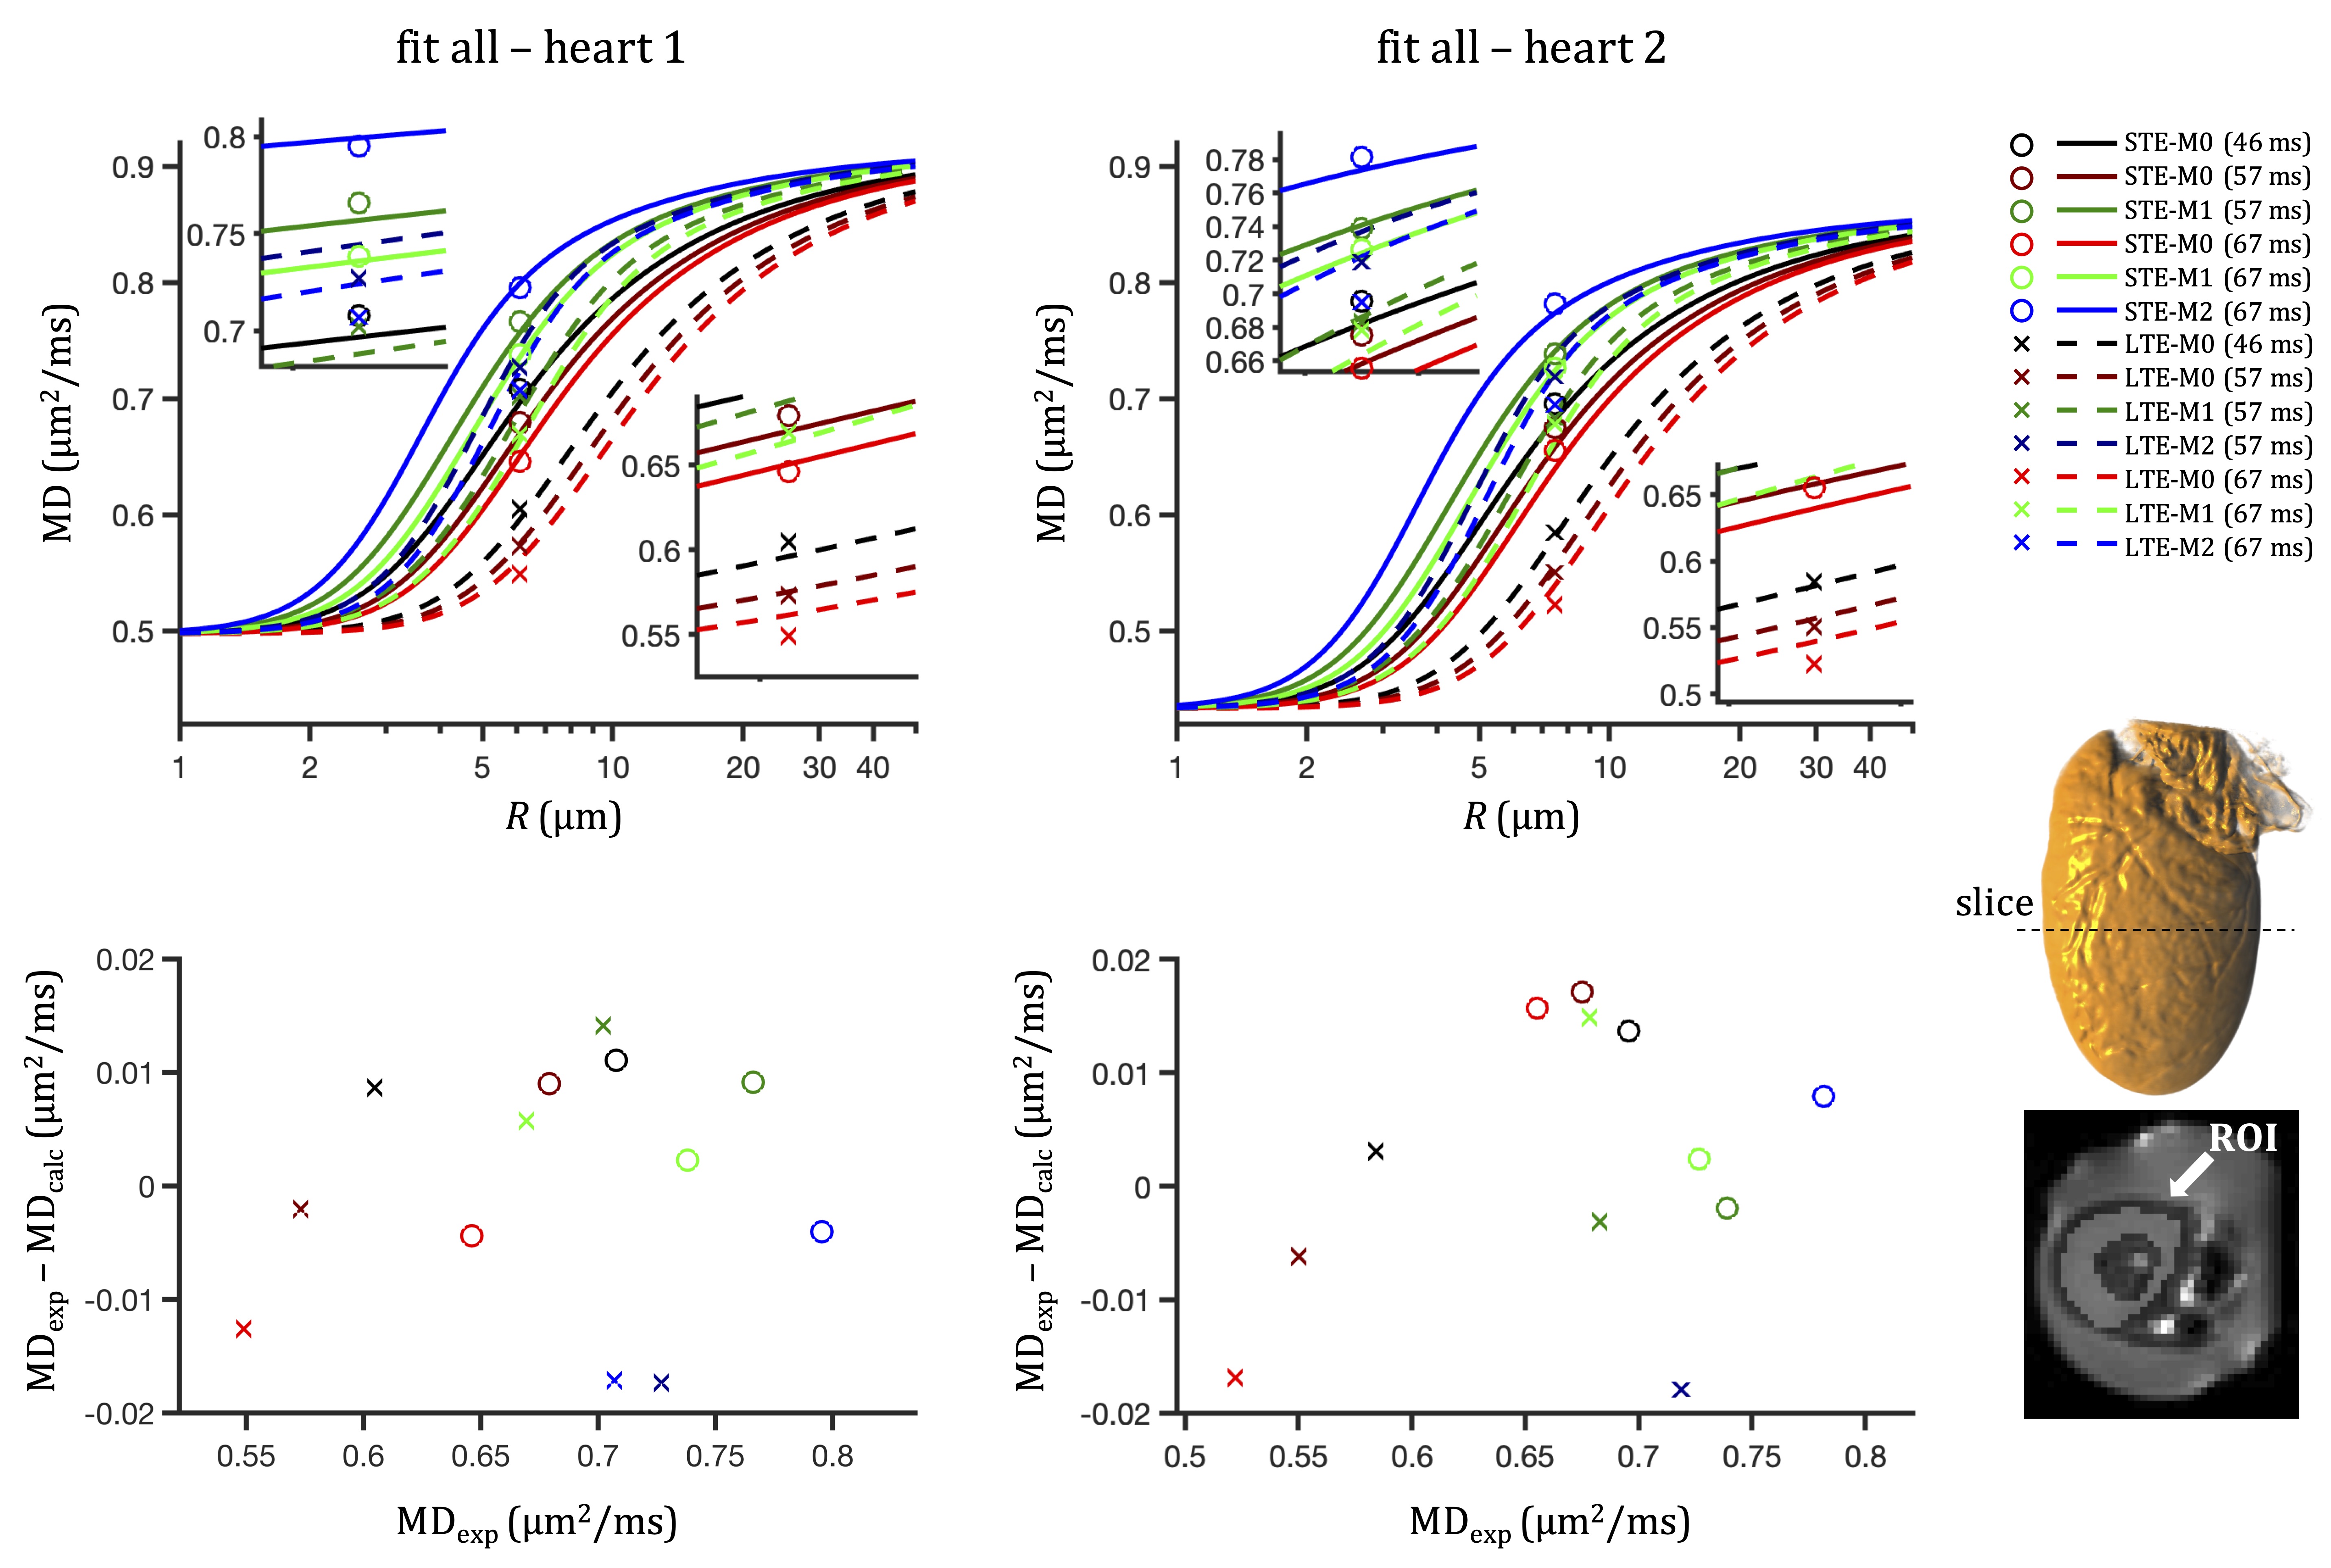
Two pig hearts were obtained from a local butcher, embedded in 1% agarose PBS gel, and scanned at room temperature. MRI data were acquired on a 3T clinical scanner (Siemens Healthcare, Erlangen, Germany) using a prototype single-shot spin-echo EPI: TR = 5 s, TE = $$$\tau$$$ + 22 ms, partial-Fourier=6/8, in-plane resolution=3×3 mm2, slice thickness=8 mm, FOV = 320×118 mm2, with ZOOM-IT excitation21. Six different diffusion encoding waveforms, i.e. LTE and STE with all gradient moments nulled up to zeroth, first and second order (M0, M1, M2) were applied with three different encoding times ($$$\tau$$$ = 46, 57, 67 ms) and b-values of 0.1 and 0.45 ms/µm2 (three orthogonal directions and 4 repetitions for LTE, and 12 repetitions for STE). See Table 1 and Figure 1. Average MD within the left ventricular myocardium in the middle slice was estimated, denoted MDexp in Figures 2 and 3.Results and discussion
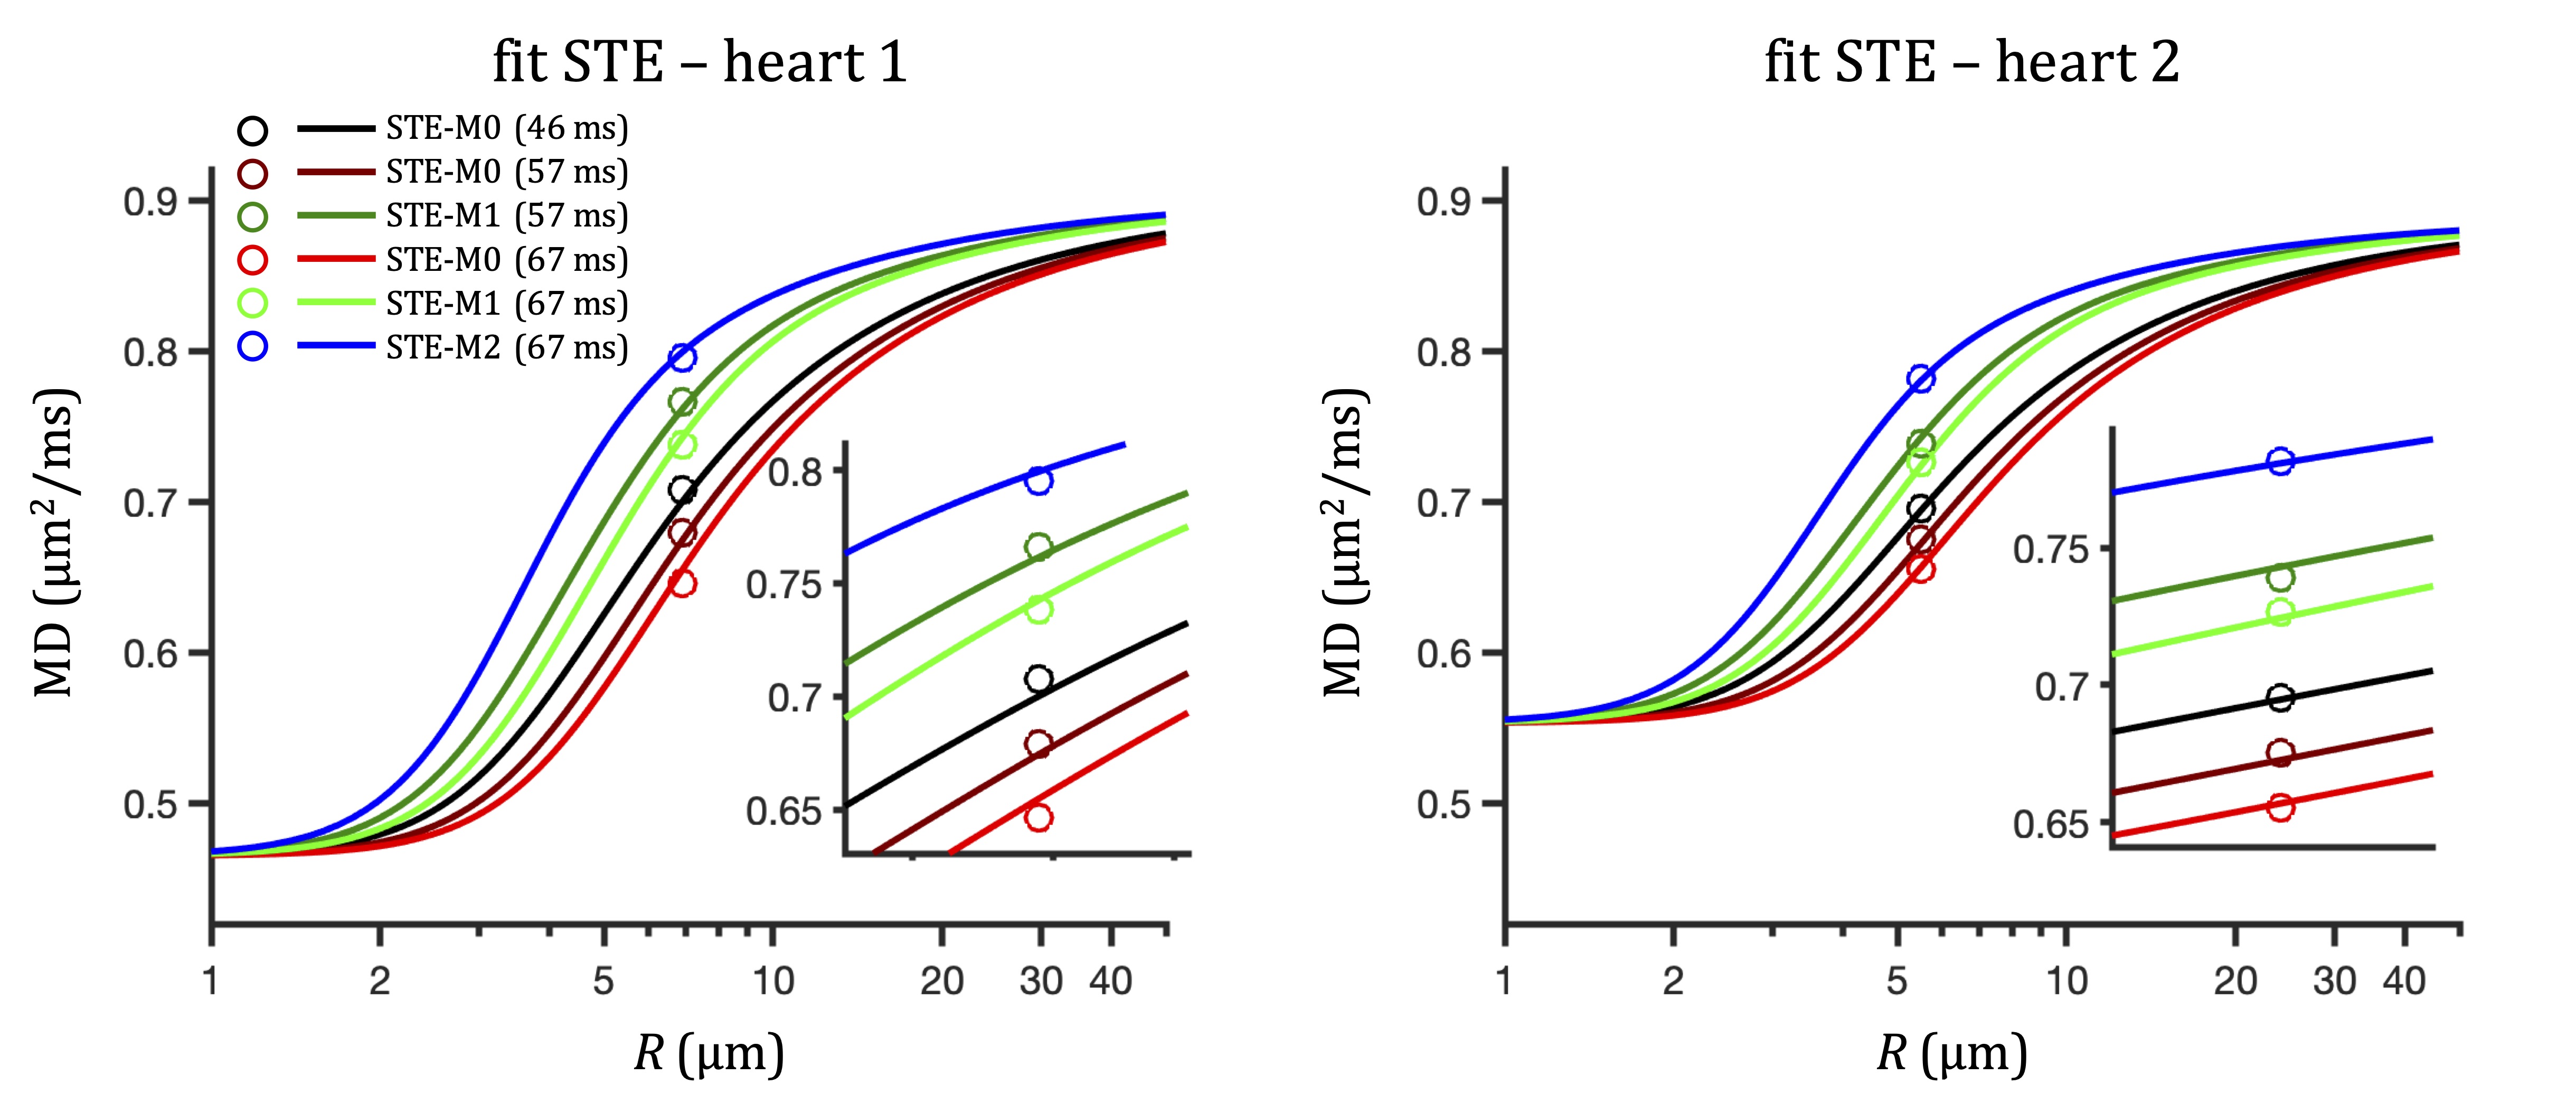
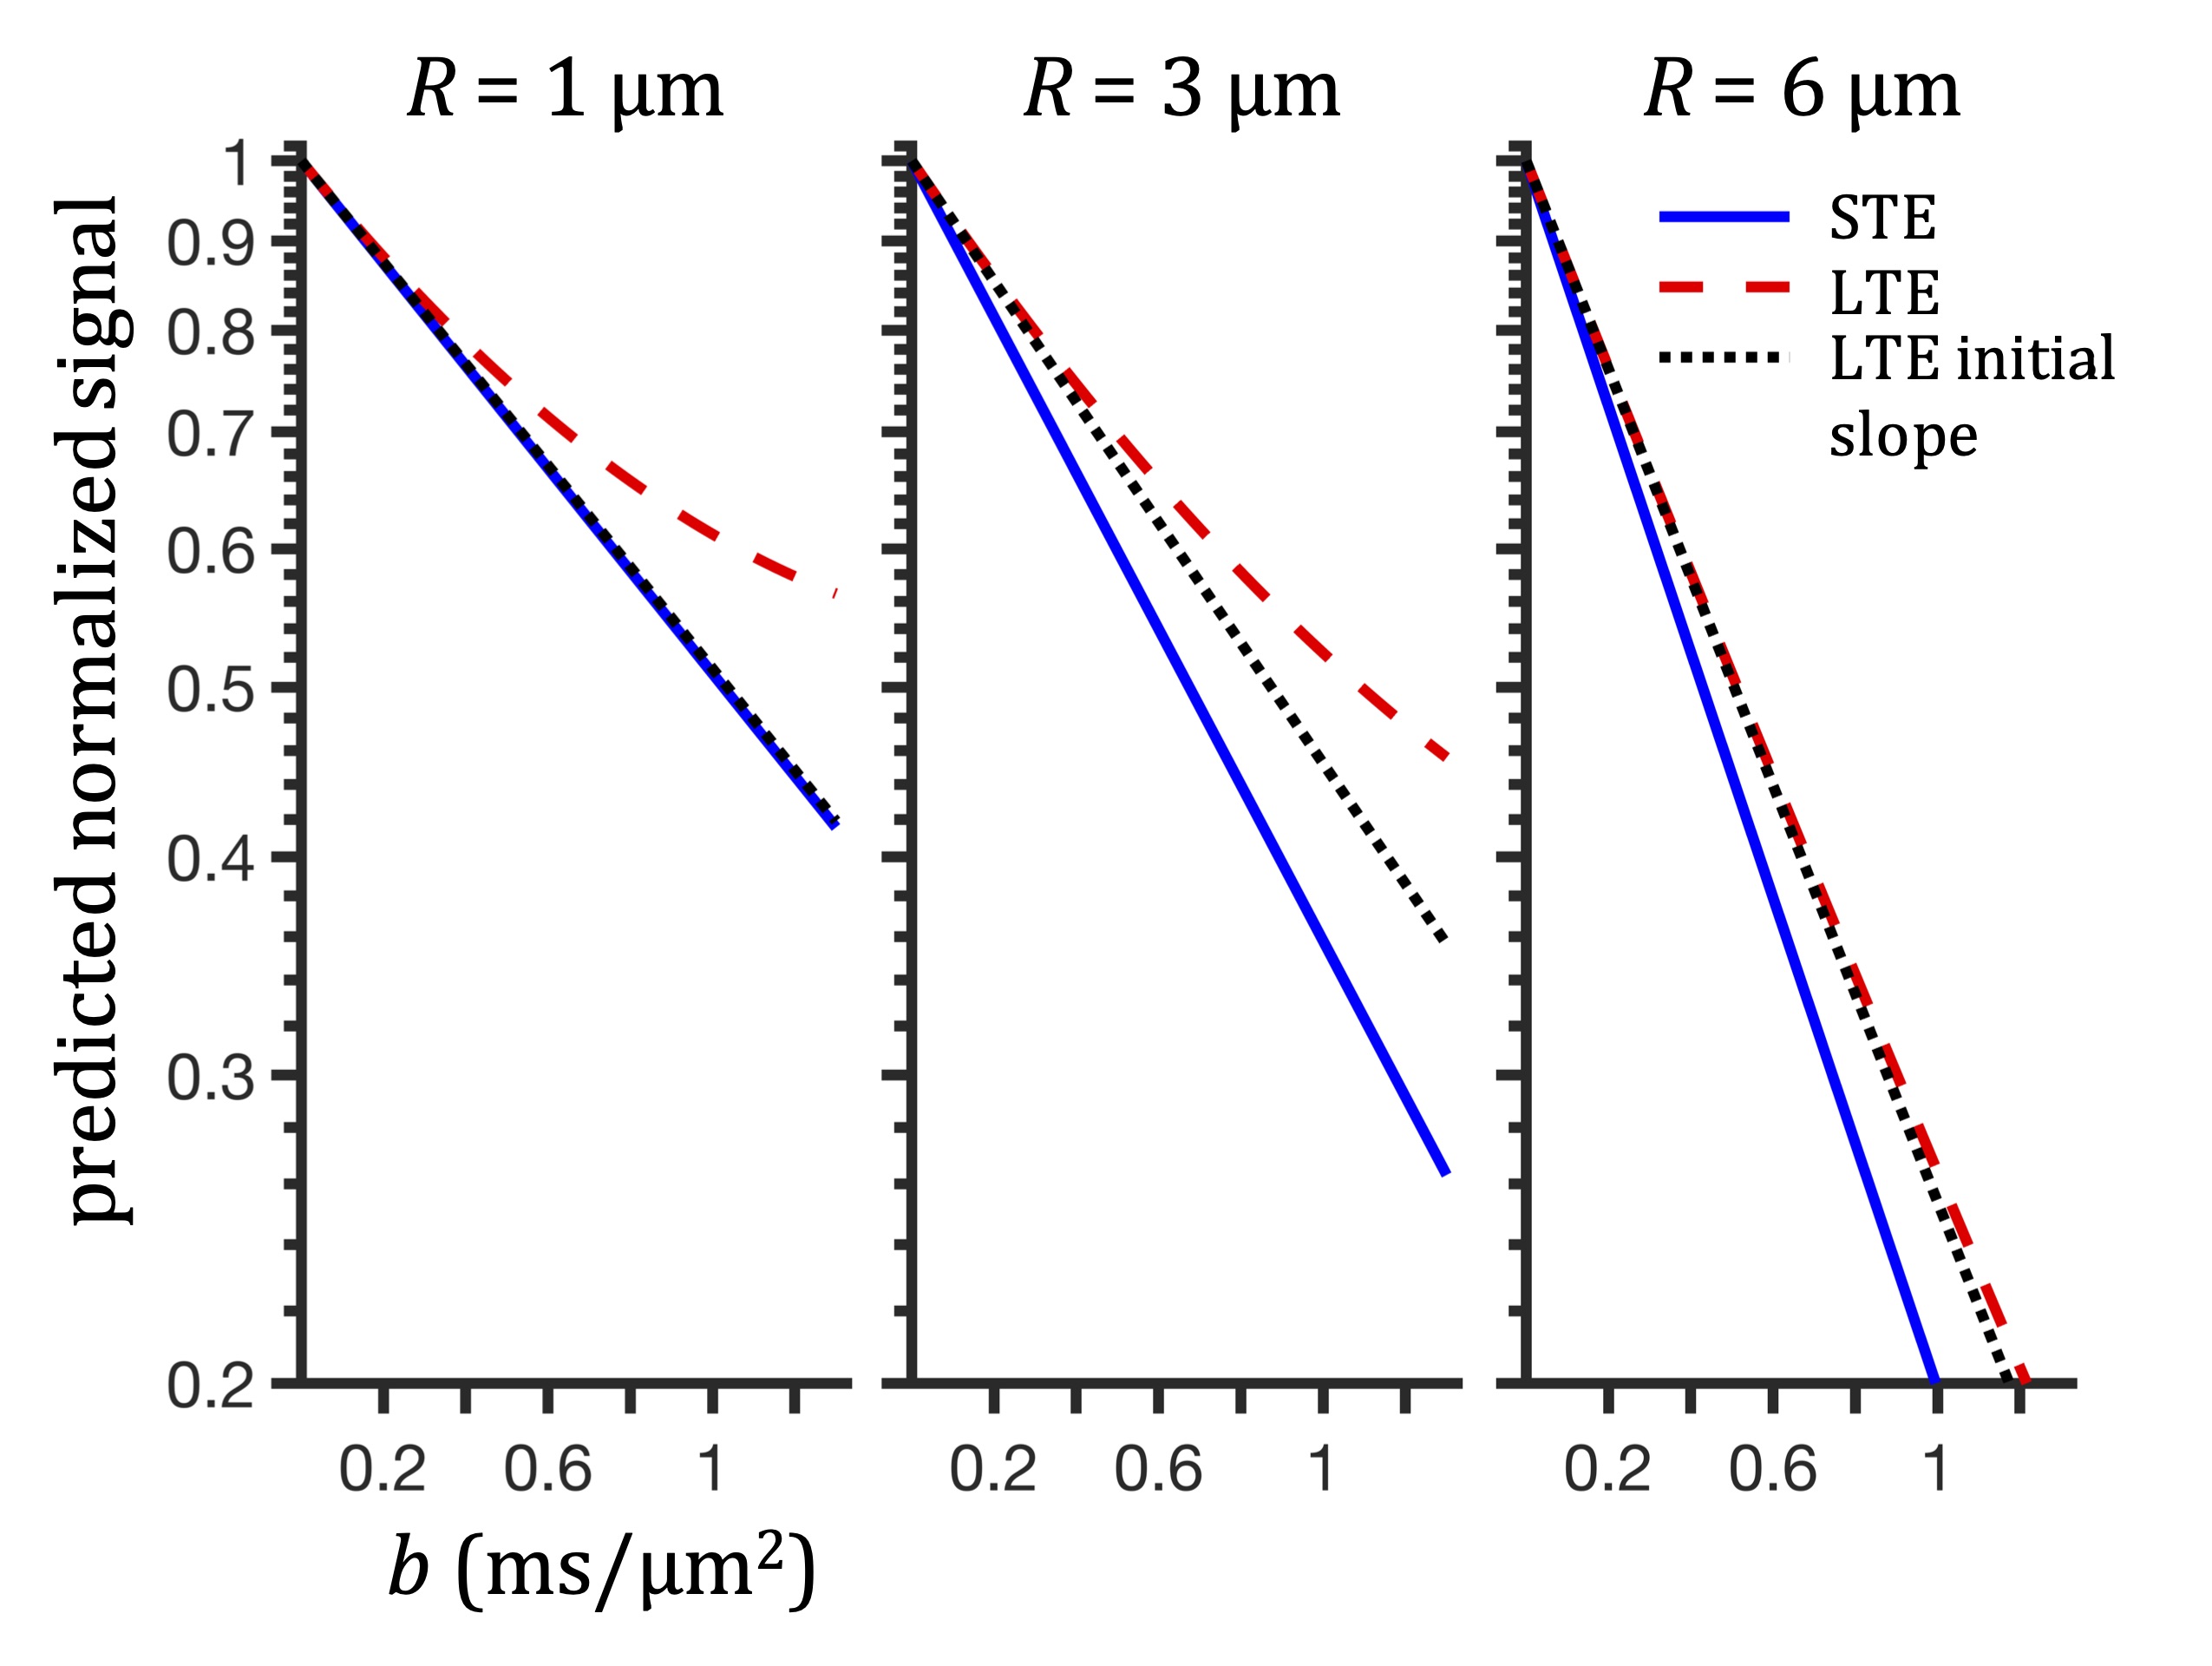
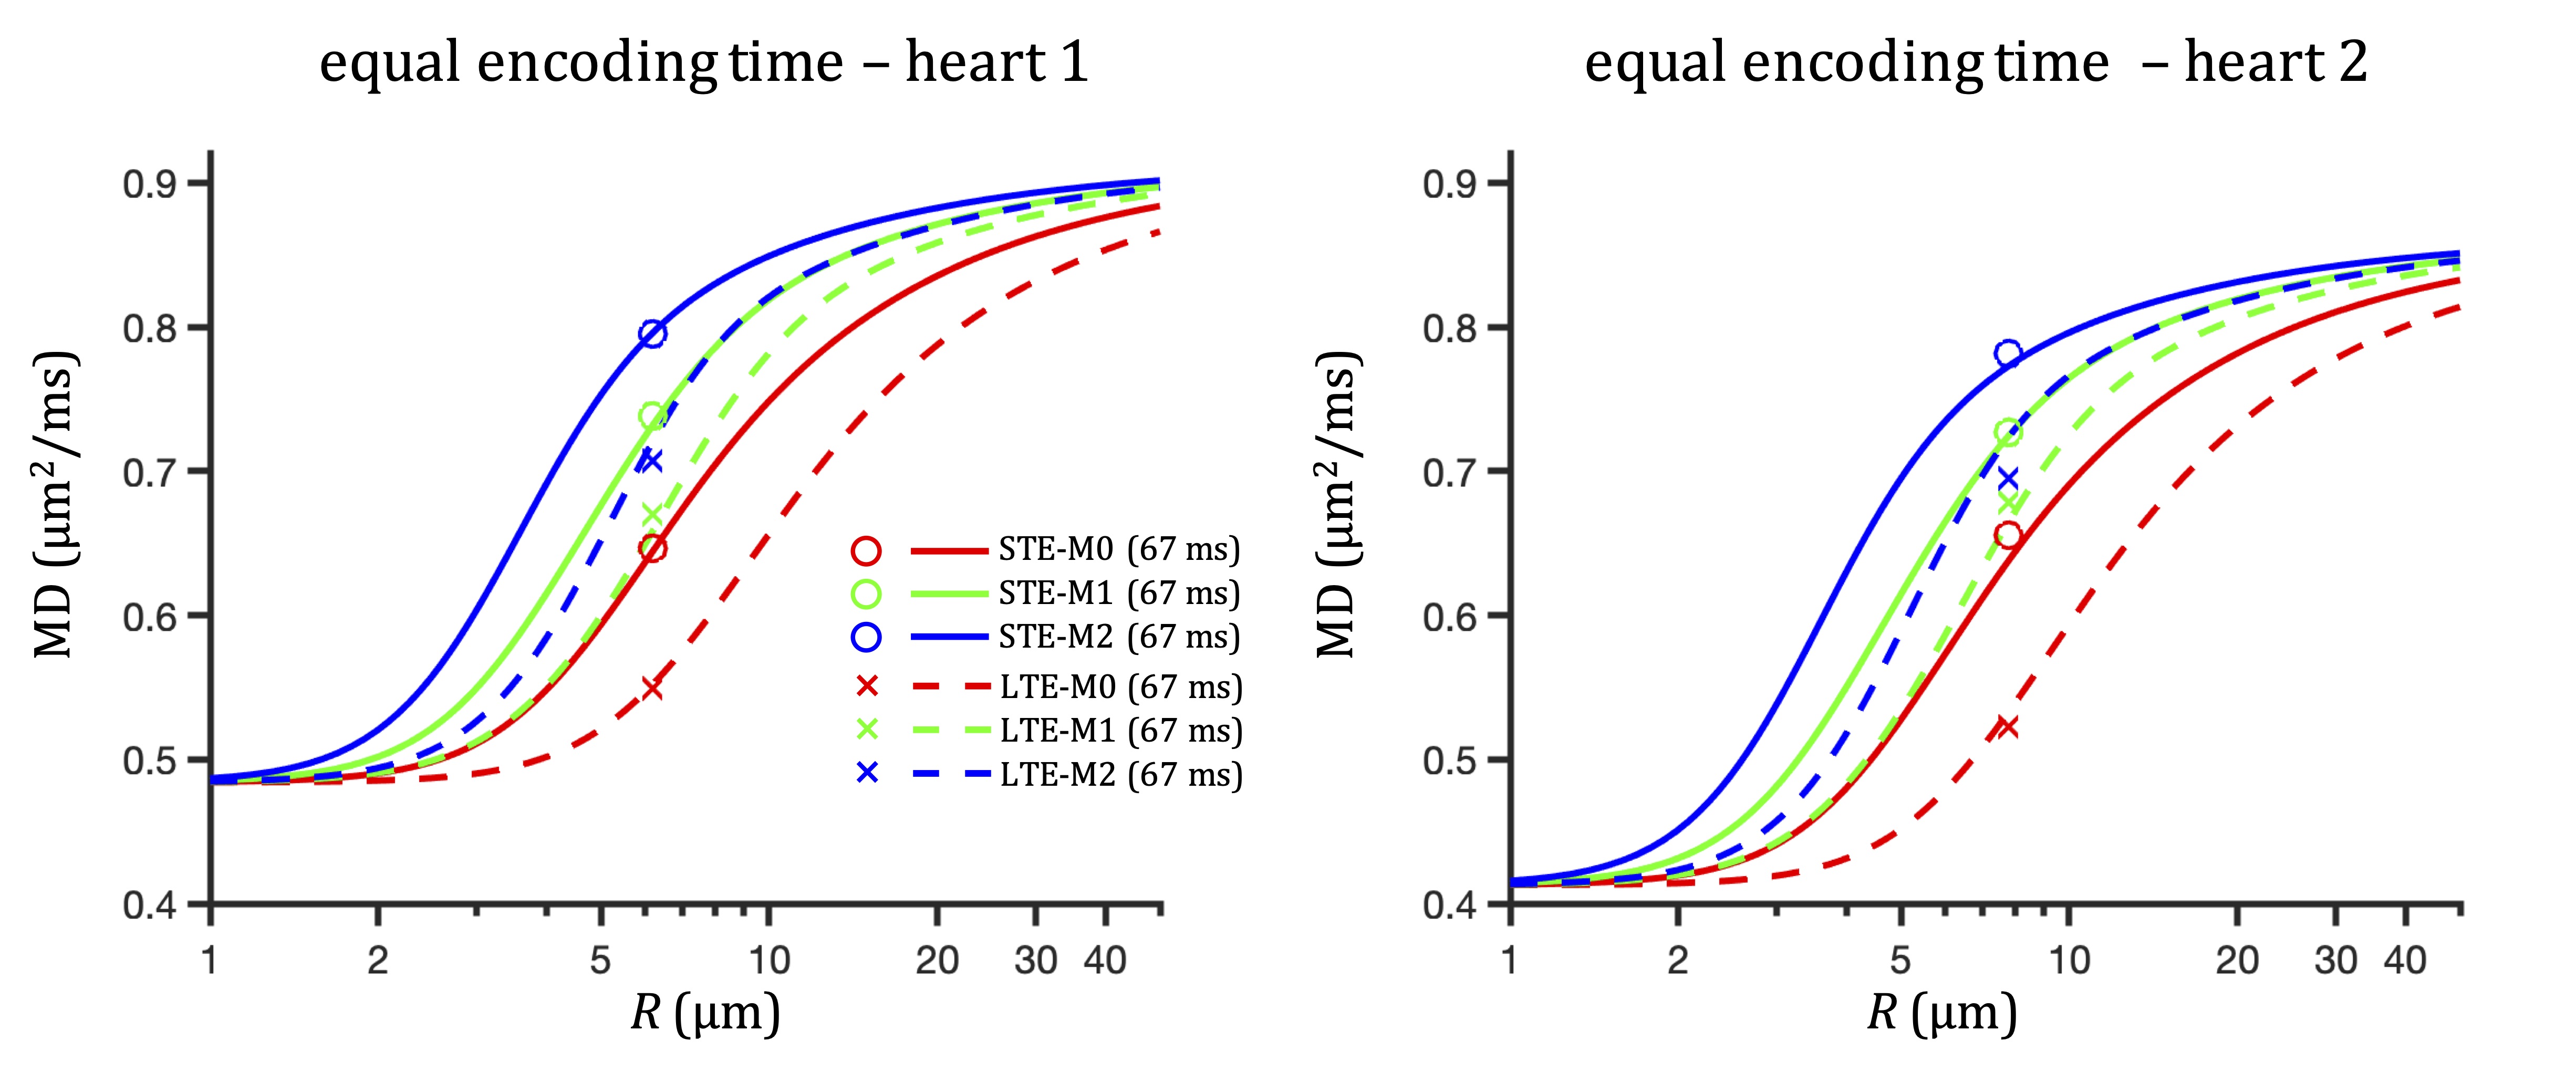
The two-compartment model fits experimental data well (see Figures 2 and 3) and yields comparable results for the two examined hearts. For heart 1, we get: R = 6.1 µm, fres = 0.31, Dh = 0.42 µm2/ms. The root mean square error (RMSE) was 0.010 µm2/ms and the sum of residuals was 0.002 µm2/ms. For heart 2, we get: R = 7.5 µm, fres = 0.33, Dh = 0.32 µm2/ms. RMSE and sum of residuals were 0.014 s and 0.001 µm2/ms, respectively. The fitted size corresponds well to the sizes observed in human hearts with microscopy and Coulter Channelyzer22, while a relatively low signal fractions fres could be a consequence of cell degradation in the non-fixed samples.A small tendency toward negative fit residuals was observed from LTE data (see Figure 2). Fitting only STE data (see Figure 3) but accounting for residuals from the entire dataset yields comparable RMSE values (0.013 and 0.026 µm2/ms) but large negative sums of residuals (-0.055 and -0.164 µm2/ms). This could potentially be a consequence of diffusion anisotropy, which causes higher signals for LTE compared to STE at larger b-values (see Figure 4) leading to negatively biased MD values. The effect of time-dependent diffusion becomes dominant for larger restrictions, where different MD estimates are expected from LTE and STE data. Our results suggest that the time-dependent diffusion effect is significant.
As we have demonstrated, strong time-dependent diffusion effects in the heart may lead to different MD (in the range 0.5-0.8 µm2/ms) estimated with different diffusion encoding waveforms even when equal encoding times are used (see Figure 5). This can be particularly significant if LTE and STE with different degrees of motion compensation are compared.
Acknowledgements
SL and HL have received funding from the European Research Council (ERC) under the European Union’s Horizon 2020 research and innovation programme (grant agreement No 804746). This work was supported by the British Heart Foundation, UK (SI/14/1/30718). SL is supported also by Random Walk Imaging.References
1. Wong EC, Cox RW, Song AW, Optimized isotropic diffusion weighting, Magn. Reson. Med., 1995, 34, (2), 139–143.
2. Mori S, Van Zijl PCM, Diffusion Weighting by the Trace of the Diffusion Tensor within a Single Scan, Magn. Reson. Med., 1995, 33, (1), 41–52.
3. Eriksson S, Lasič S, Topgaard D, Isotropic diffusion weighting in PGSE NMR by magic-angle spinning of the q-vector., J. Magn. Reson., 2013, 226, 13–8.
4. Topgaard D, Multidimensional diffusion MRI, J. Magn. Reson., 2017, 275, 98–113.
5. Westin C, Knutsson H, Pasternak O, Szczepankiewicz F, Kubicki M, Topgaard D, Nilsson M, Q-space trajectory imaging for multidimensional diffusion MRI of the human brain, Neuroimage, 2016, Neuroimage, (135), 345–62.
6. Basser PJ, Mattiello J, LeBihan D, MR diffusion tensor spectroscopy and imaging., Biophys. J., 1994, 66, (1), 259–67.
7. Gamper U, Boesiger P, Kozerke S, Diffusion imaging of the in vivo heart using spin echoes-considerations on bulk motion sensitivity, Magn. Reson. Med., 2007, 57, (2), 331–337.
8. Stoeck CT, Von Deuster C, GeneT M, Atkinson D, Kozerke S, Second-order motion-compensated spin echo diffusion tensor imaging of the human heart, Magn. Reson. Med., 2016, 75, (4), 1669–1676.
9. Welsh CL, Dibella EVR, Member S, Hsu EW, Cardiac Diffusion Tensor Imaging in Rats, Trans. Med. Imaging, 2015, 34, (9), 1843–1853.
10. Lasič S, Szczepankiewicz F, Dall’Armellina E, Das A, Kelly C, Plein S, E. Schneider J, Nilsson M, Teh I, Motion compensated b-tensor encoding for in vivo cardiac diffusion-weighted imaging, NMR Biomed., 2019, Accepted.
11. Woessner DE, N.M.R. spin-echo self-diffusion measurements on fluids undergoing restricted diffusion., J. Phys. Chem., 1963, 67, 1365–1367.
12. Stejskal EO, Tanner JE, Spin Diffusion Measurements: Spin Echoes in the Presence of a Time-Dependent Field Gradient, J. Chem. Phys., 1965, 42, (1), 288.
13. Latour LL, Svoboda K, Mitra PP, Sotak CH, Time-dependent diffusion of water in a biological model system, Proc. Natl. Acad. Sci. U. S. A., 1994, 91, (4), 1229–1233.
14. Stepišnik J, Time-dependent self-diffusion by NMR spin-echo, Phys. B, 1993, 183, 343–350.
15. Parsons EC, Does MD, Gore JC, Modified oscillating gradient pulses for direct sampling of the diffusion spectrum suitable for imaging sequences., Magn. Reson. Imaging, 2003, 21, (3–4), 279–285.
16. Lundell H, Sønderby CK, Dyrby TB, Diffusion weighted imaging with circularly polarized oscillating gradients, Magn. Reson. Med., 2015, 73, (3), 1171–1176.
17. Lundell H, Nilsson M, Dyrby TB, Parker GJM, Cristinacce PLH, Zhou FL, Topgaard D, Lasič S, Multidimensional diffusion MRI with spectrally modulated gradients reveals unprecedented microstructural detail, Sci. Rep., 2019, 9, (1), 1–12.
18. Jespersen SN, Lundell H, Sønderby CK, Dyrby TB, Orientationally invariant metrics of apparent compartment eccentricity from double pulsed field gradient diffusion experiments, NMR Biomed., 2013, 26, (12), 1647–1662.
19. Lasič S, Szczepankiewicz F, Eriksson S, Nilsson M, Topgaard D, Microanisotropy imaging: quantification of microscopic diffusion anisotropy and orientational order parameter by diffusion MRI with magic-angle spinning of the q-vector, Front. Phys., 2014, 2, (11), 1–14.
20. Szczepankiewicz F, Lasič S, van Westen D, Sundgren PC, Englund E, Westin C-F, Ståhlberg F, Lätt J, Topgaard D, Nilsson M, Quantification of microscopic diffusion anisotropy disentangles effects of orientation dispersion from microstructure: applications in healthy volunteers and in brain tumors., Neuroimage, 2015, 104, 241–52.
21. Szczepankiewicz F, Sjölund J, Ståhlberg F, Lätt J, Nilsson M, Tensor-valued diffusion encoding for diffusional variance decomposition (DIVIDE): Technical feasibility in clinical MRI systems, PLoS One, 2019, 14, (3), 1–20.
22. Gerdes AM, Kellerman SE, Moore JA, Muffly KE, Clark LC, Reaves PY, Malec KB, McKeown PP, Schocken DD, Structural remodeling of cardiac myocytes in patients with ischemic cardiomyopathy, Circulation, 1992, 86, (2), 426–430.
Figures