4299
Rapid DTI-based free water elimination and mapping with explicit T2 modelling using a dual-echo Stejskal-Tanner EPI sequence1Institute of Neuroscience and Medicine 4, Forschungszentrum Jülich, Jülich, Germany, 2Institute of Biomedical Engineering and Nanomedicine, National Health Research Institutes, Miaoli, Taiwan, 3Institute of Medical Device and Imaging, National Taiwan University College of Medicine, Taipei, Taiwan, 4Department of Neurology, RWTH Aachen University, Aachen, Germany, 5JARA - BRAIN - Translational Medicine, Aachen, Germany, 6Institute of Neuroscience and Medicine 11, JARA, Forschungszentrum Jülich, Jülich, Germany
Synopsis
We propose and investigate a dual-echo (DE) Stejskal-Tanner EPI sequence for rapid DTI-based free water elimination and mapping with explicit T2 modelling (FWET2) in vivo. DTI maps from the DE sequence are artefact-free and similar to the standard, individual echo (IE) approach. Compared to the IE case, an underestimation of T2 values calculated from the DE sequence is observed. The T2 underestimation stems from reduced signal amplitudes in the second echo of the DE sequence, which we demonstrate to correlate with imperfect refocusing RF pulses. A simple correction method is proposed. FWET2 model parameters derived from both sequences are comparable.
Introduction
Multidimensional MRI methods have recently been used in several in vivo investigations, offering a non-invasive characterisation of tissue heterogeneity with an unprecedented level of detail.1,2 In particular, simultaneous modelling of transverse relaxation- and diffusion-weighted data leads to a more accurate, precise and robust estimation of the model parameters in the case of ill-conditioned estimation problems, such as in the free water elimination (FWE) method.2,3 In this work, we investigate a dual-echo (DE) Stejskal-Tanner EPI sequence4 to acquire diffusion- and T2-weighted data two times faster than normal. We first validate the sequence using the conventional DTI model with explicit T2 attenuation and compare it with the case of data acquired using the conventional, individual echo (IE) approach, i.e. one echo per repetition time. The effect of imperfections in the refocusing radiofrequency (RF) pulses is investigated and a simple correction approach is proposed. Finally, we analyse the data from both sequences using the recently introduced FWE with explicit T2 attenuation model3,5 (FWET2).Methods
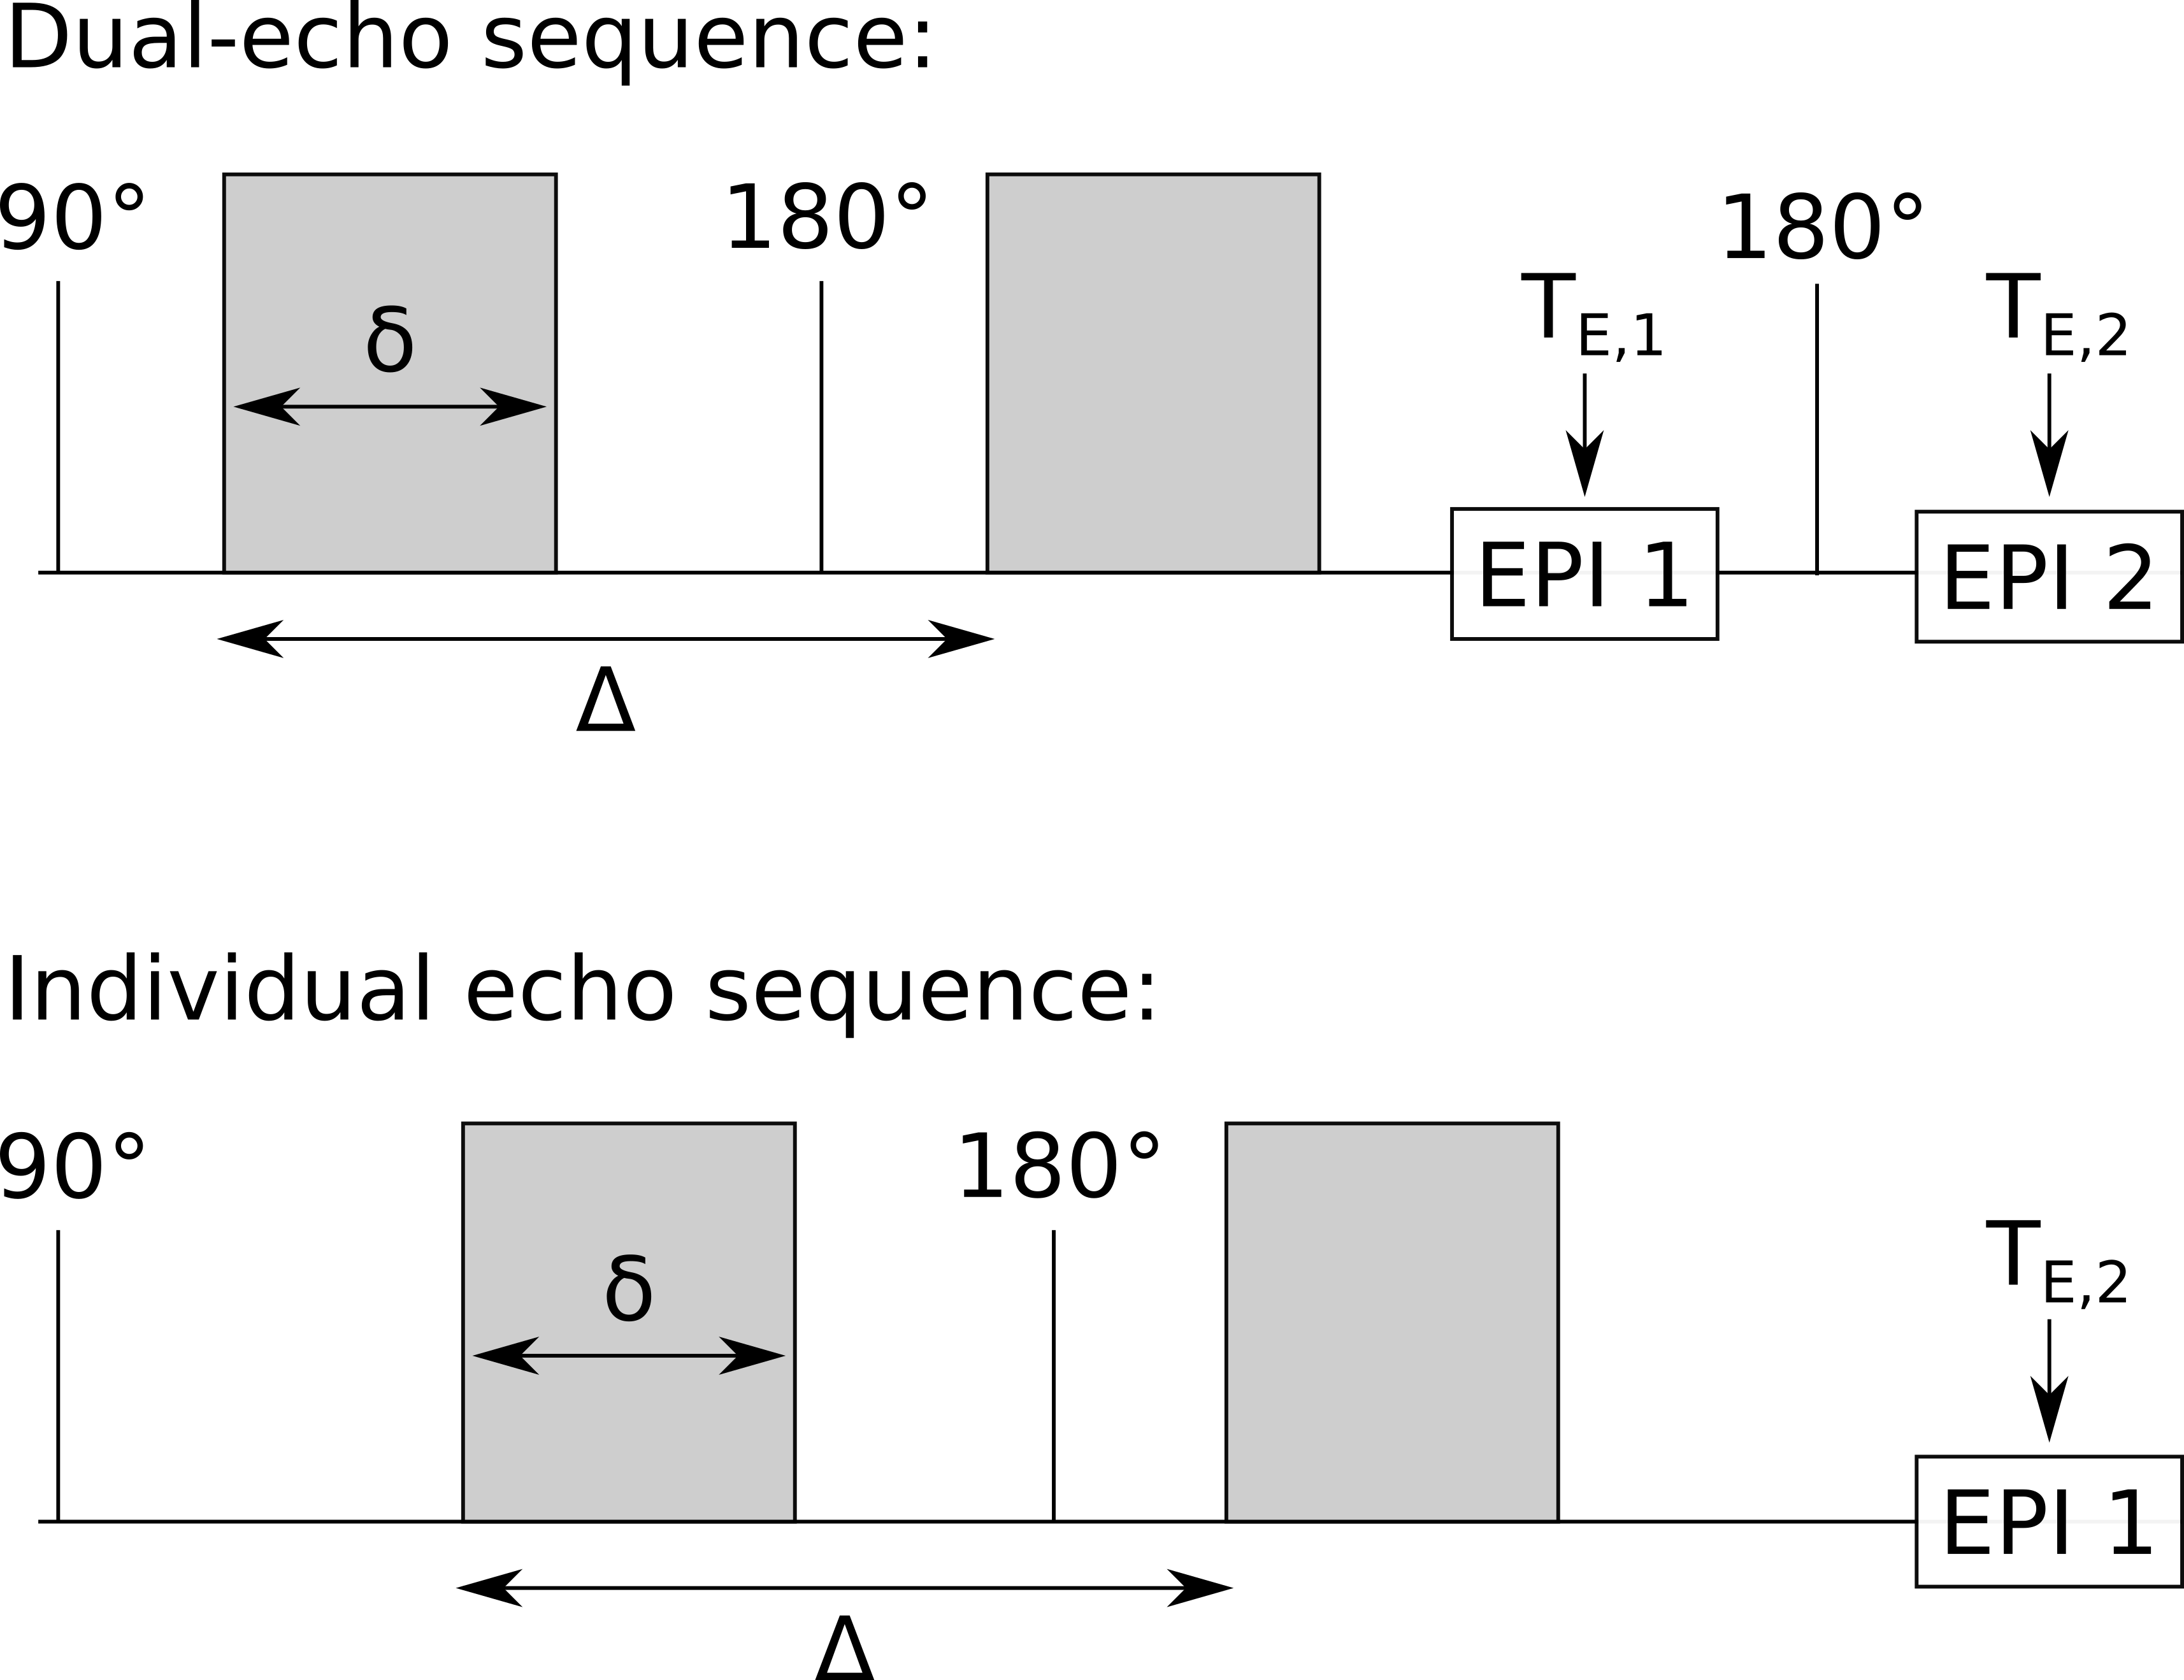
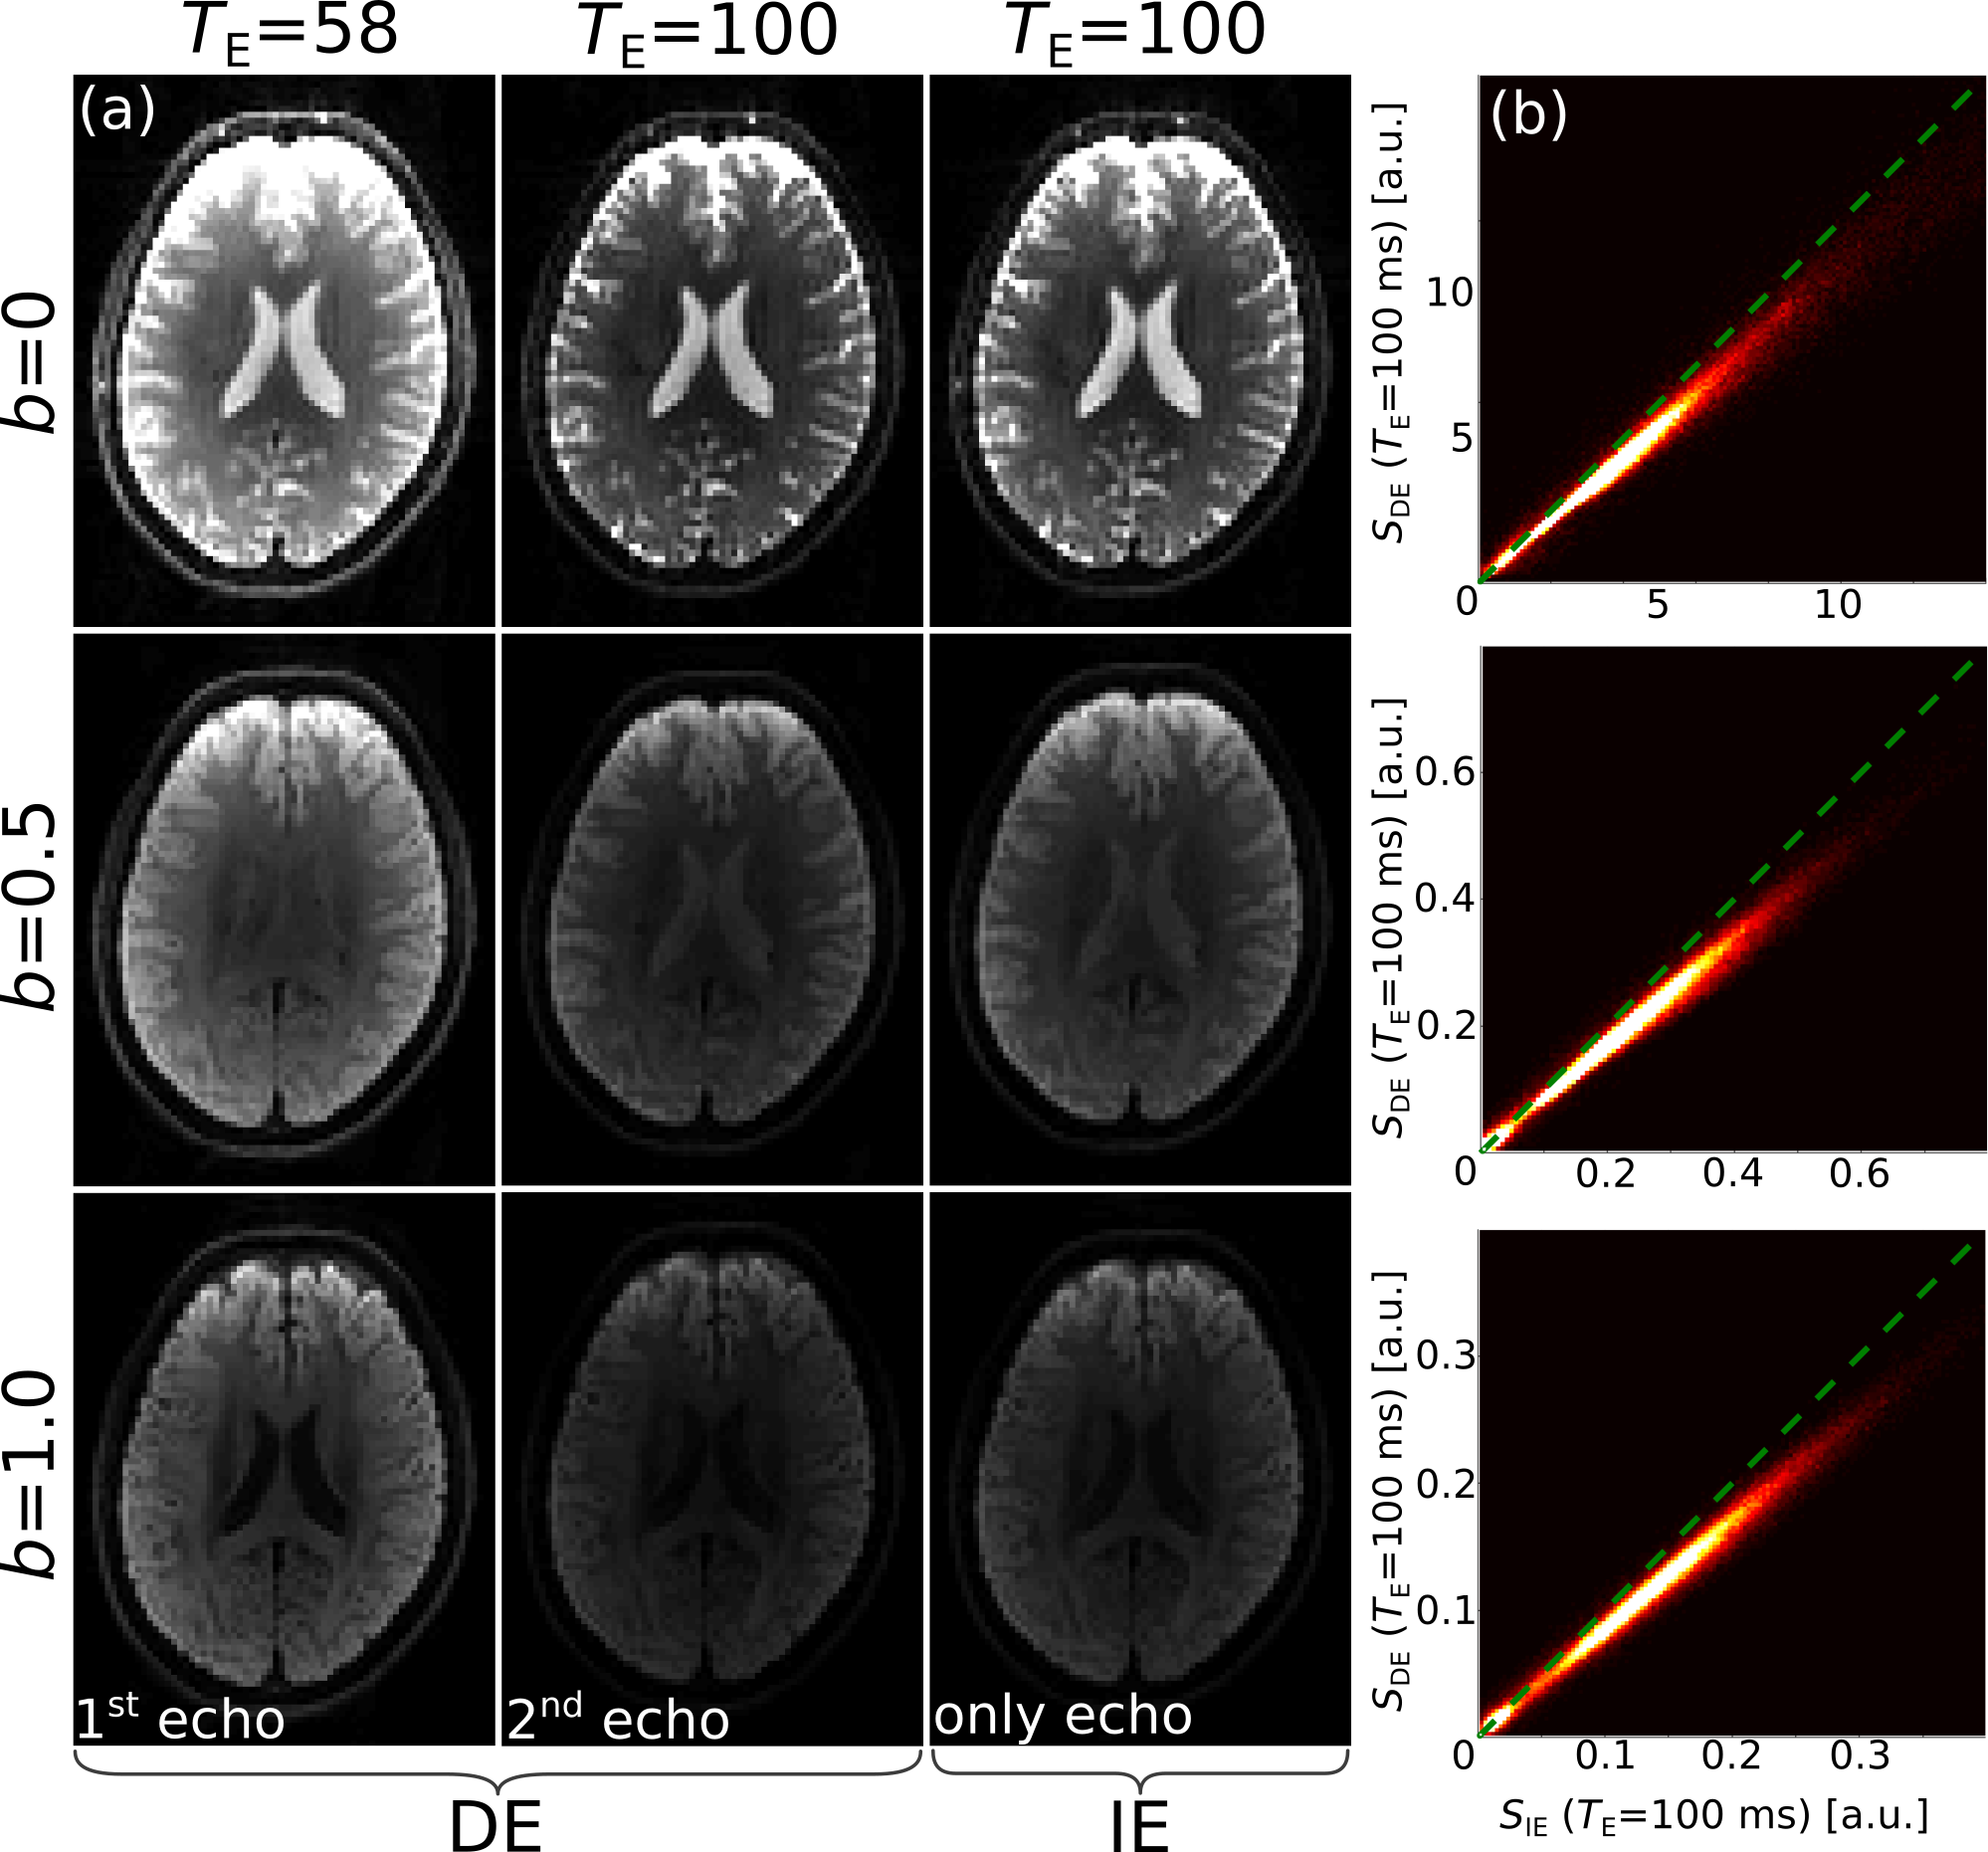
The proposed DE Stejskal-Tanner sequence acquires two spin-echo EPI readouts per repetition time (TR) (Fig.1). It was implemented on a clinical 3T PRISMA scanner (Siemens Healthineers, Germany). In vivo measurements were performed on 8 healthy volunteers, from whom written informed consent was obtained. The DE experimental protocol included: TE,1=58ms and TE,2=100ms; TR=9s; δ=14ms and Δ=31ms; b-values(directions)=0(9), 0.5(15) and 1.0(30)ms/μm2; matrix-size=96⨉96⨉40; voxel-size=2.53mm3. An extra IE experiment, echo-time TE,2=100ms, was acquired for comparison. Due to the equivalence of the first echo from both approaches, the IE dataset comprises the first echo from the DE experiment (TE,1=58ms) and a second echo individually acquired at TE,2=100ms (Fig.1).All diffusion- and T2-weighted datasets were firstly denoised.6 Secondly, corrections of susceptibility- and eddy current-induced distortions were performed using TOPUP and EDDY from FSL.7
We analysed the datasets first using the conventional DTI method with explicit, monoexponential T2 attenuation (DTIT2), in which the signal is written as: $$S_\mathrm{DTIT_2}(T_\mathrm{E},b,\mathbf{n})=S_0e^{-T_\mathrm{E}/T_2}e^{-b\mathbf{n}^\mathrm{T}\mathbf{D}\mathbf{n}}\;\;\;(1)$$ where $$$S_0$$$, $$$T_2$$$ and $$$\mathbf{D}$$$ are the proton density, the transverse relaxation time and diffusion tensor, respectively; $$$b$$$ and $$$\mathbf{n}$$$ are the diffusion weighting strength and direction. DTIT2 model parameters, $$$\mathbf{θ}_\mathrm{DTIT_2}=[\mathrm{ln}S_0,D_{11},D_{12},…,D_{33},1/T_2 ]^\mathrm{T}$$$, were estimated by fitting Eq.1 to the experimental datasets, using the weighted-linear least-squares method: $$\mathbf{θ}_\mathrm{DTIT_2}=(\mathbf{X}^\mathrm{T}\mathbf{wX})^{-1}\mathbf{X}^\mathrm{T}\mathbf{wy}\;\;\;(2)$$ where $$$\mathbf{y}$$$ is a column vector whose elements are given by $$$y_i=\mathrm{ln}S_i$$$ and the weighting matrix, $$$\mathbf{w}$$$, is a diagonal matrix whose elements are given by $$$w_{i,i}=S_i^2$$$ ($$$i=1...N$$$, the number of measurements). The ith row of $$$\mathbf{X}$$$ is written as $$$X_{i,:}=[1,-b_in^2_{ix},-2b_in_{ix}n_{iy},…,-b_{iz}n^2_{iz},-T_{\mathrm{E},i}]$$$.
Secondly, datasets were analysed with the FWET2 model,3,5 where the signal is written as: $$S_\mathrm{FWET_2}(T_\mathrm{E},b,\mathbf{n})=S_0[f_we^{-T_\mathrm{E}/T_{2,\mathrm{w}}}e^{-bD_\mathrm{w}}+(1-f_\mathrm{w})e^{-T_\mathrm{E}/T_{2,t}}e^{-b\mathbf{n}^\mathrm{T}\mathbf{D}_\mathrm{t}\mathbf{n}}]\;\;\;(3)$$ $$$T_{2,\mathrm{w}}$$$ and $$$T_{2,\mathrm{t}}$$$ are the free water and tissue transverse relaxation times, respectively, and $$$D_\mathrm{w}$$$ and $$$D_\mathrm{t}$$$ are the diffusion coefficient and tensor for the free water and tissue compartments, respectively. FWET2 model parameters, $$$\mathbf{θ}_\mathrm{FWET_2}=[S_0,f_\mathrm{w},D_{11},D_{12},…,D_{33},T_{2,\mathrm{t}}]^\mathrm{T}$$$, were estimated using a non-linear least-squares method, with $$$\mathbf{θ}_\mathrm{DTIT_2}$$$ as an initial guess. All models parameters estimations were performed using in-house Matlab scripts. DTI metrics MD and FA were evaluated.8 Bulk parameters were estimated at the ventricles and fixed during estimation: $$$T_{2,\mathrm{w}}=0.87\mathrm{s}$$$ and $$$D_\mathrm{w}=3.13\mathrm{μm^2/ms}$$$.
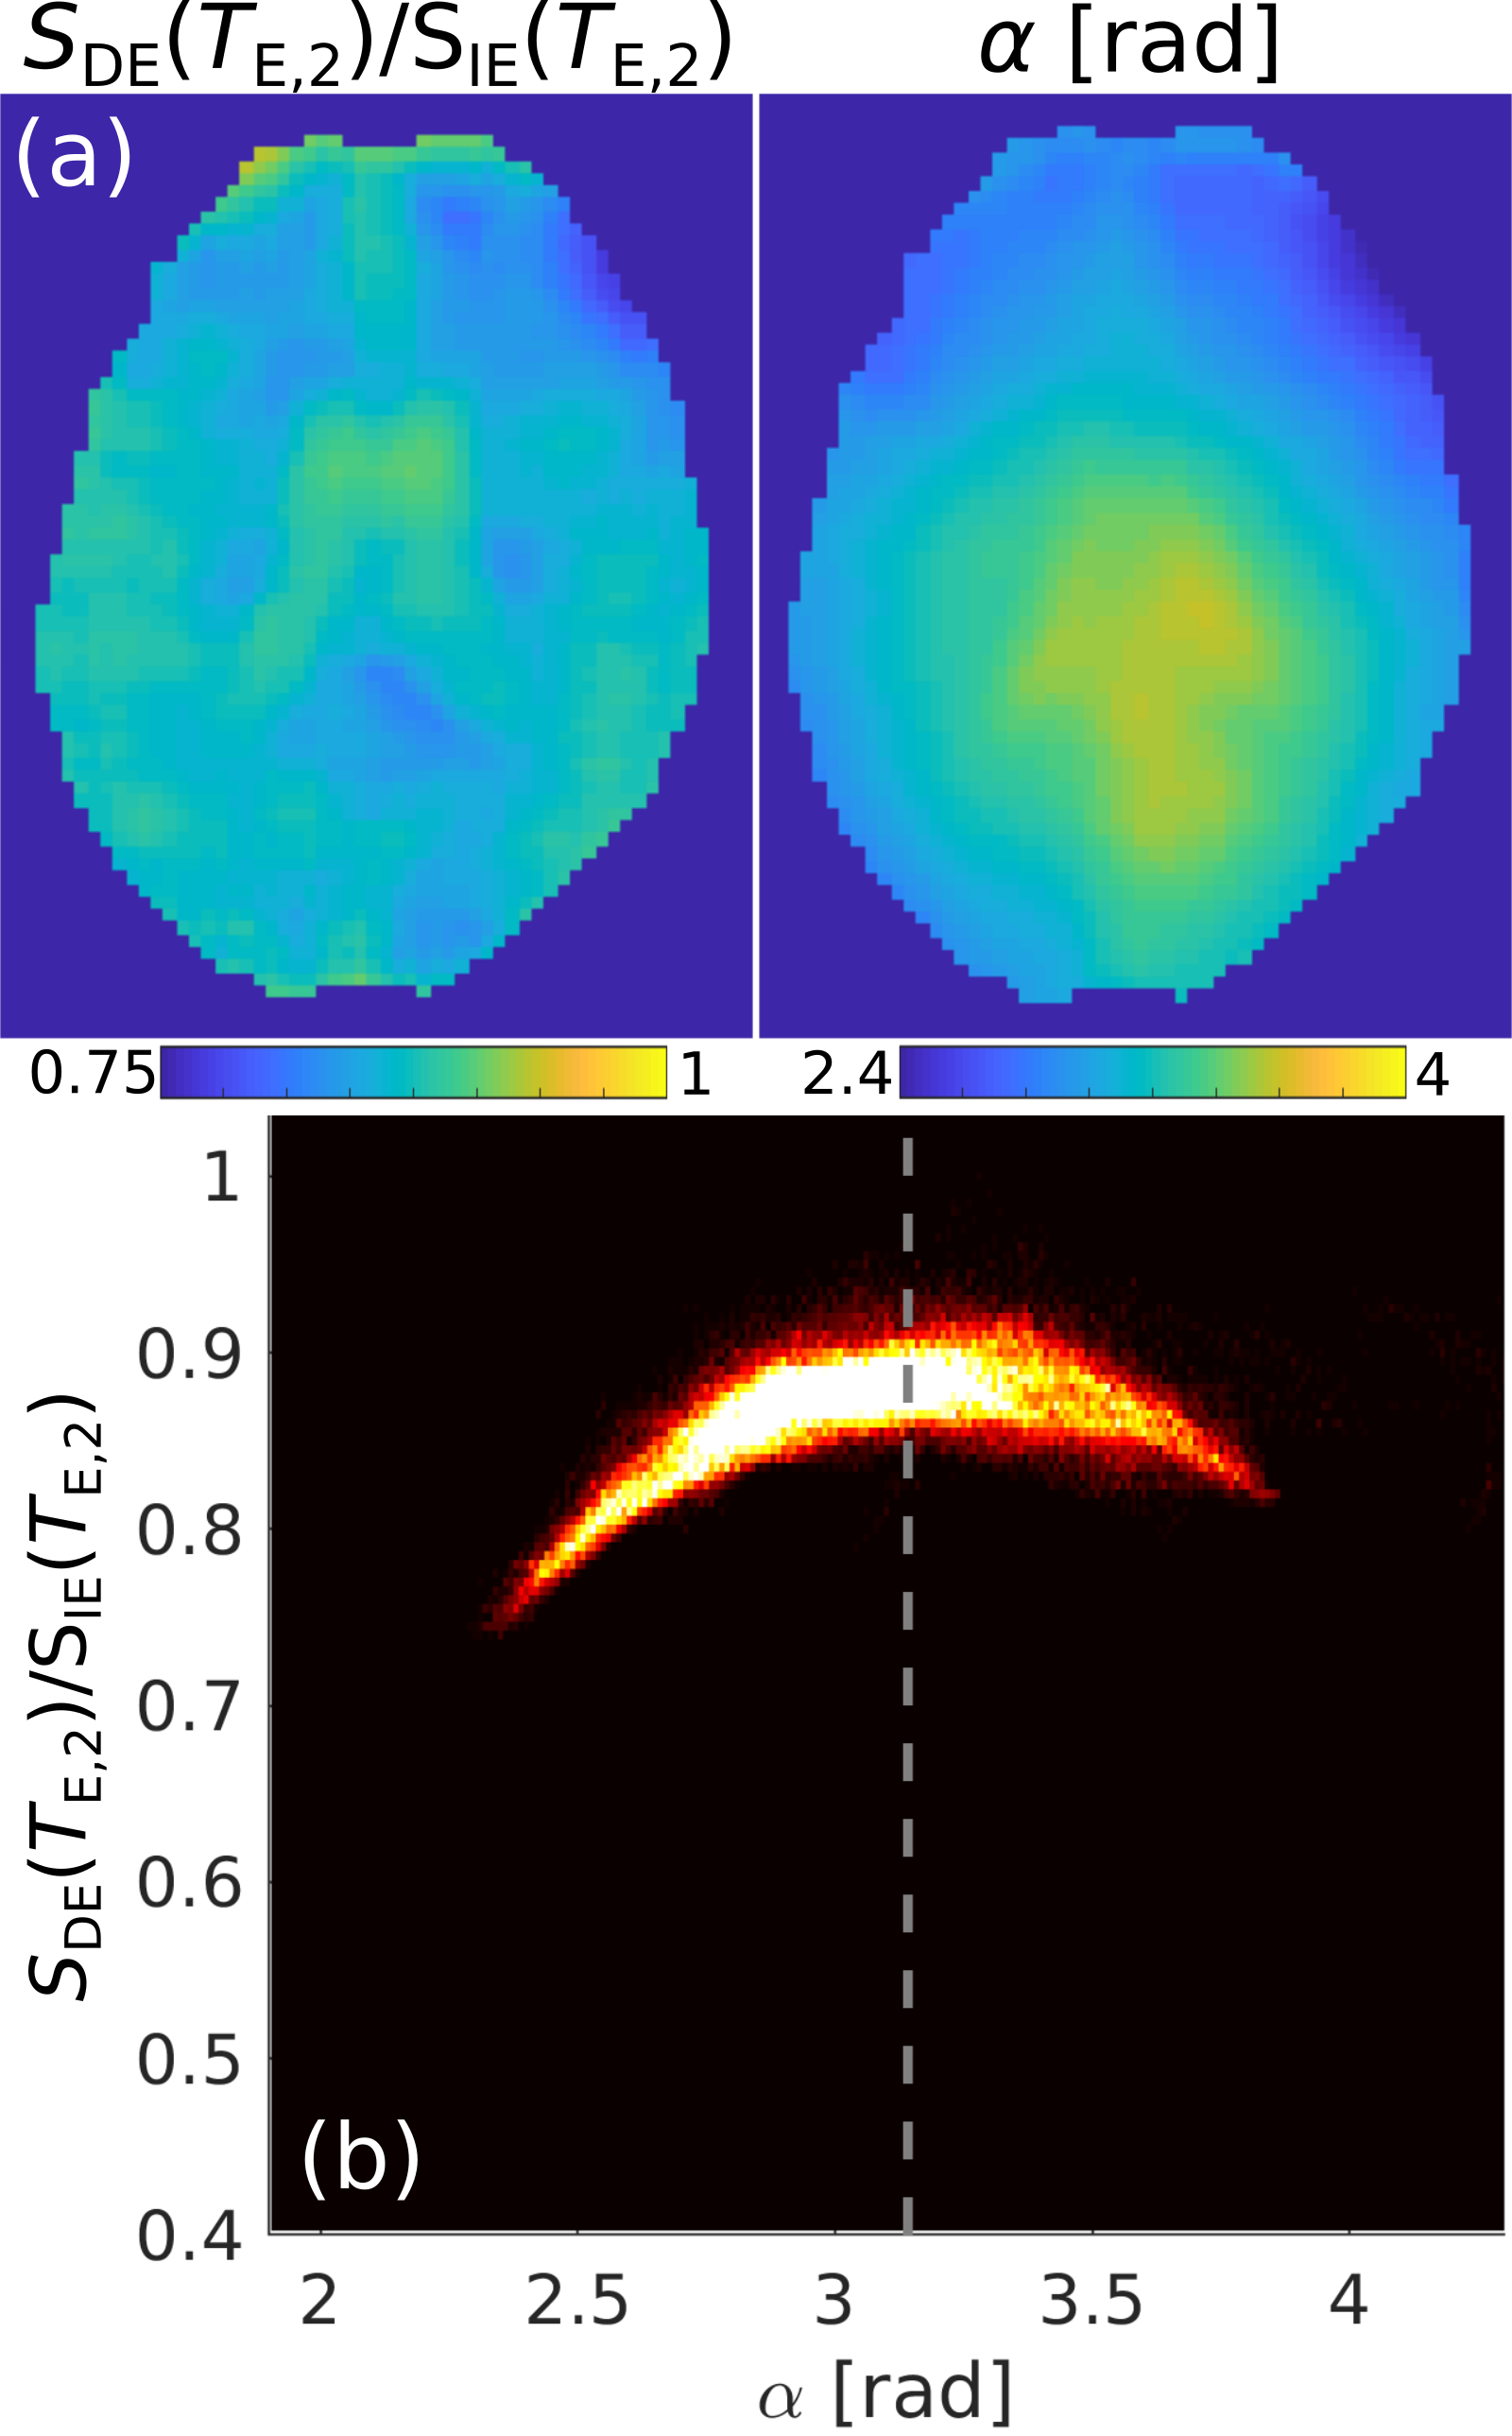
In order to assess imperfections in the refocusing flip-angle, $$$B_1$$$ mapping was performed with 5 IE EPI volumes9 having nominal flip-angles: 30°, 60°, 90° and 120°. Other protocol parameters were the same as above.
Finally, the lower signal amplitude of the second echo of the DE sequence, $$$S_\mathrm{DE}(T_{\mathrm{E},2})$$$, caused by imperfections in the refocusing RF pulses, was corrected by estimating the slope versus the corresponding signal of the IE sequence, $$$S_\mathrm{IE}(T_{\mathrm{E},2})$$$ (Fig.2b). We refer to this dataset as the DE corrected (DEC).
Results
Fig.2 shows the diffusion- and T2-weighted images from the DE and the IE sequences. The joint histograms on the right-hand side indicate a lower signal amplitude in the 2nd echo of the DE sequence, $$$S_\mathrm{DE}(T_{\mathrm{E},2})$$$, versus the only echo of the IE sequence, $$$S_\mathrm{IE}(T_{\mathrm{E},2})$$$. The slope of the plot of $$$S_\mathrm{DE}(T_{\mathrm{E},2})$$$ vs. $$$S_\mathrm{IE}(T_{\mathrm{E},2})$$$, averaged over the eight subjects, was: 0.878±0.007.Fig.3 demonstrates that the reduced signal amplitude of $$$S_\mathrm{DE}(T_{\mathrm{E},2})$$$ with respect to $$$S_\mathrm{IE}(T_{\mathrm{E},2})$$$ is tightly correlated with the imperfections in the refocusing flip-angle.
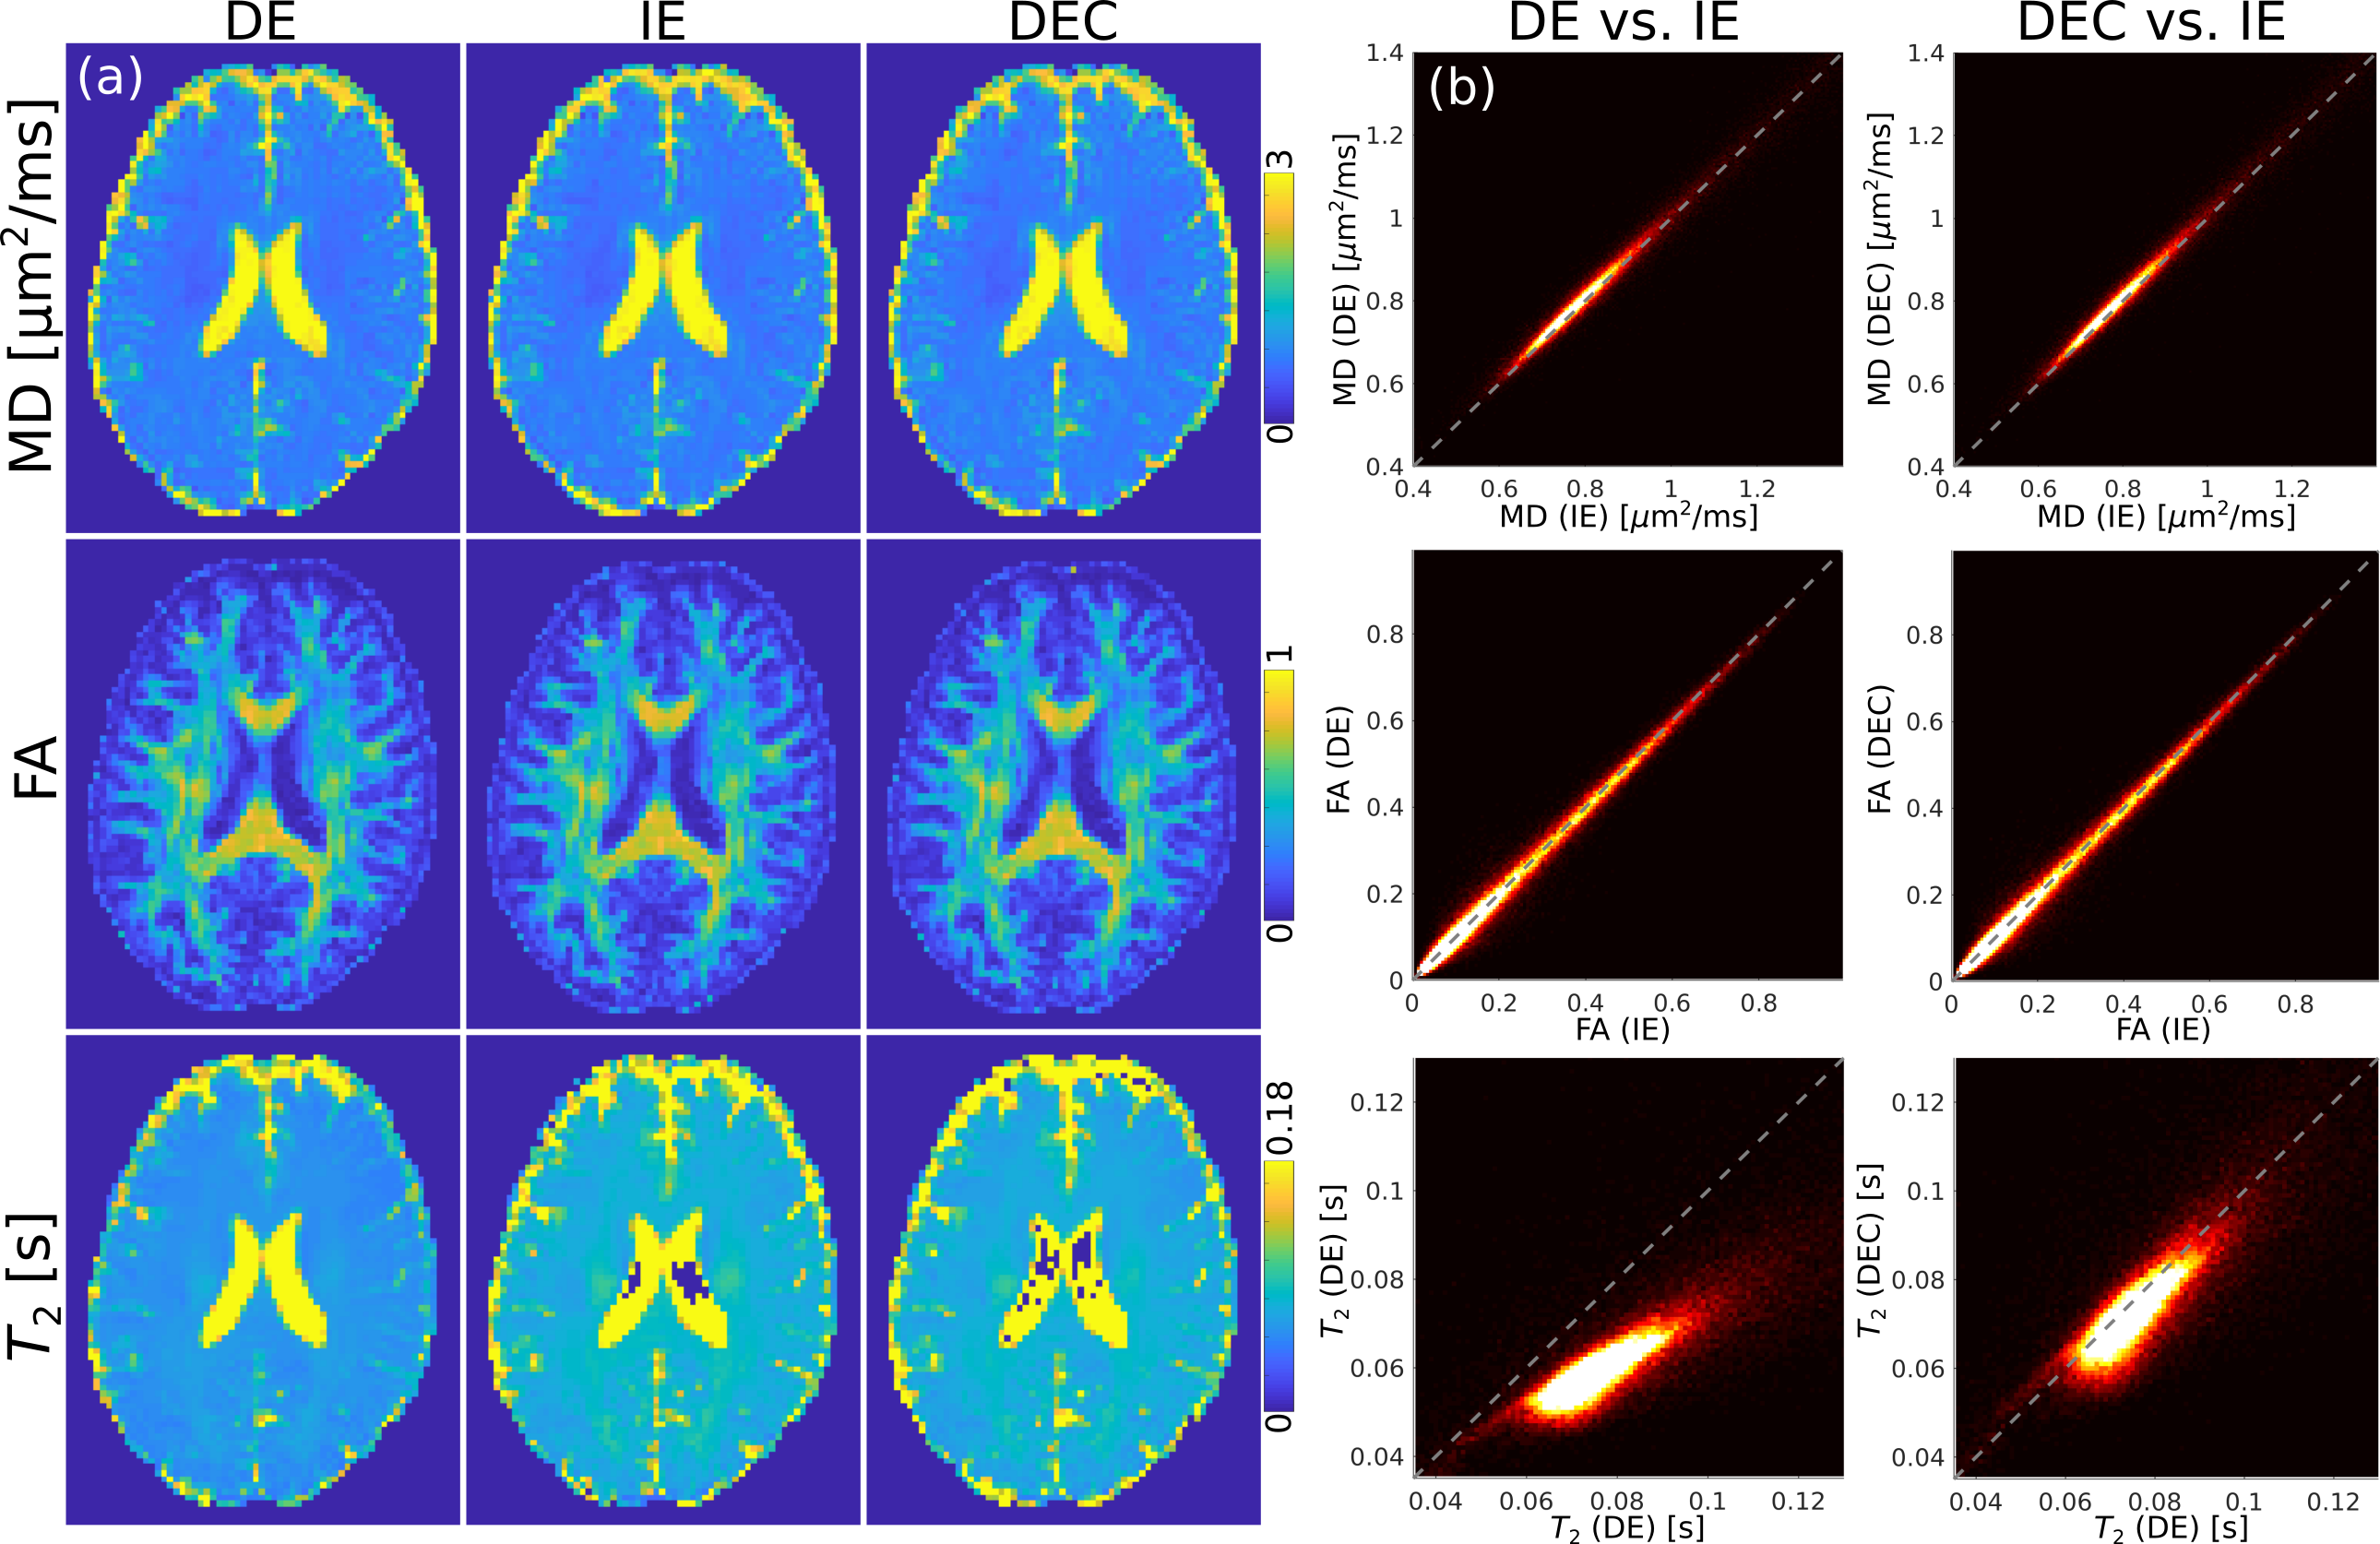
Fig.4 depicts the DTIT2 maps for the DE, IE and DEC data. We observe that DTI maps are not affected by the reduced signal amplitude of the second echo, whereas the values in T2 for the DE sequence are underestimated, compared to the IE sequence. The DEC data provide DTIT2 parameters more similar to the IE case.
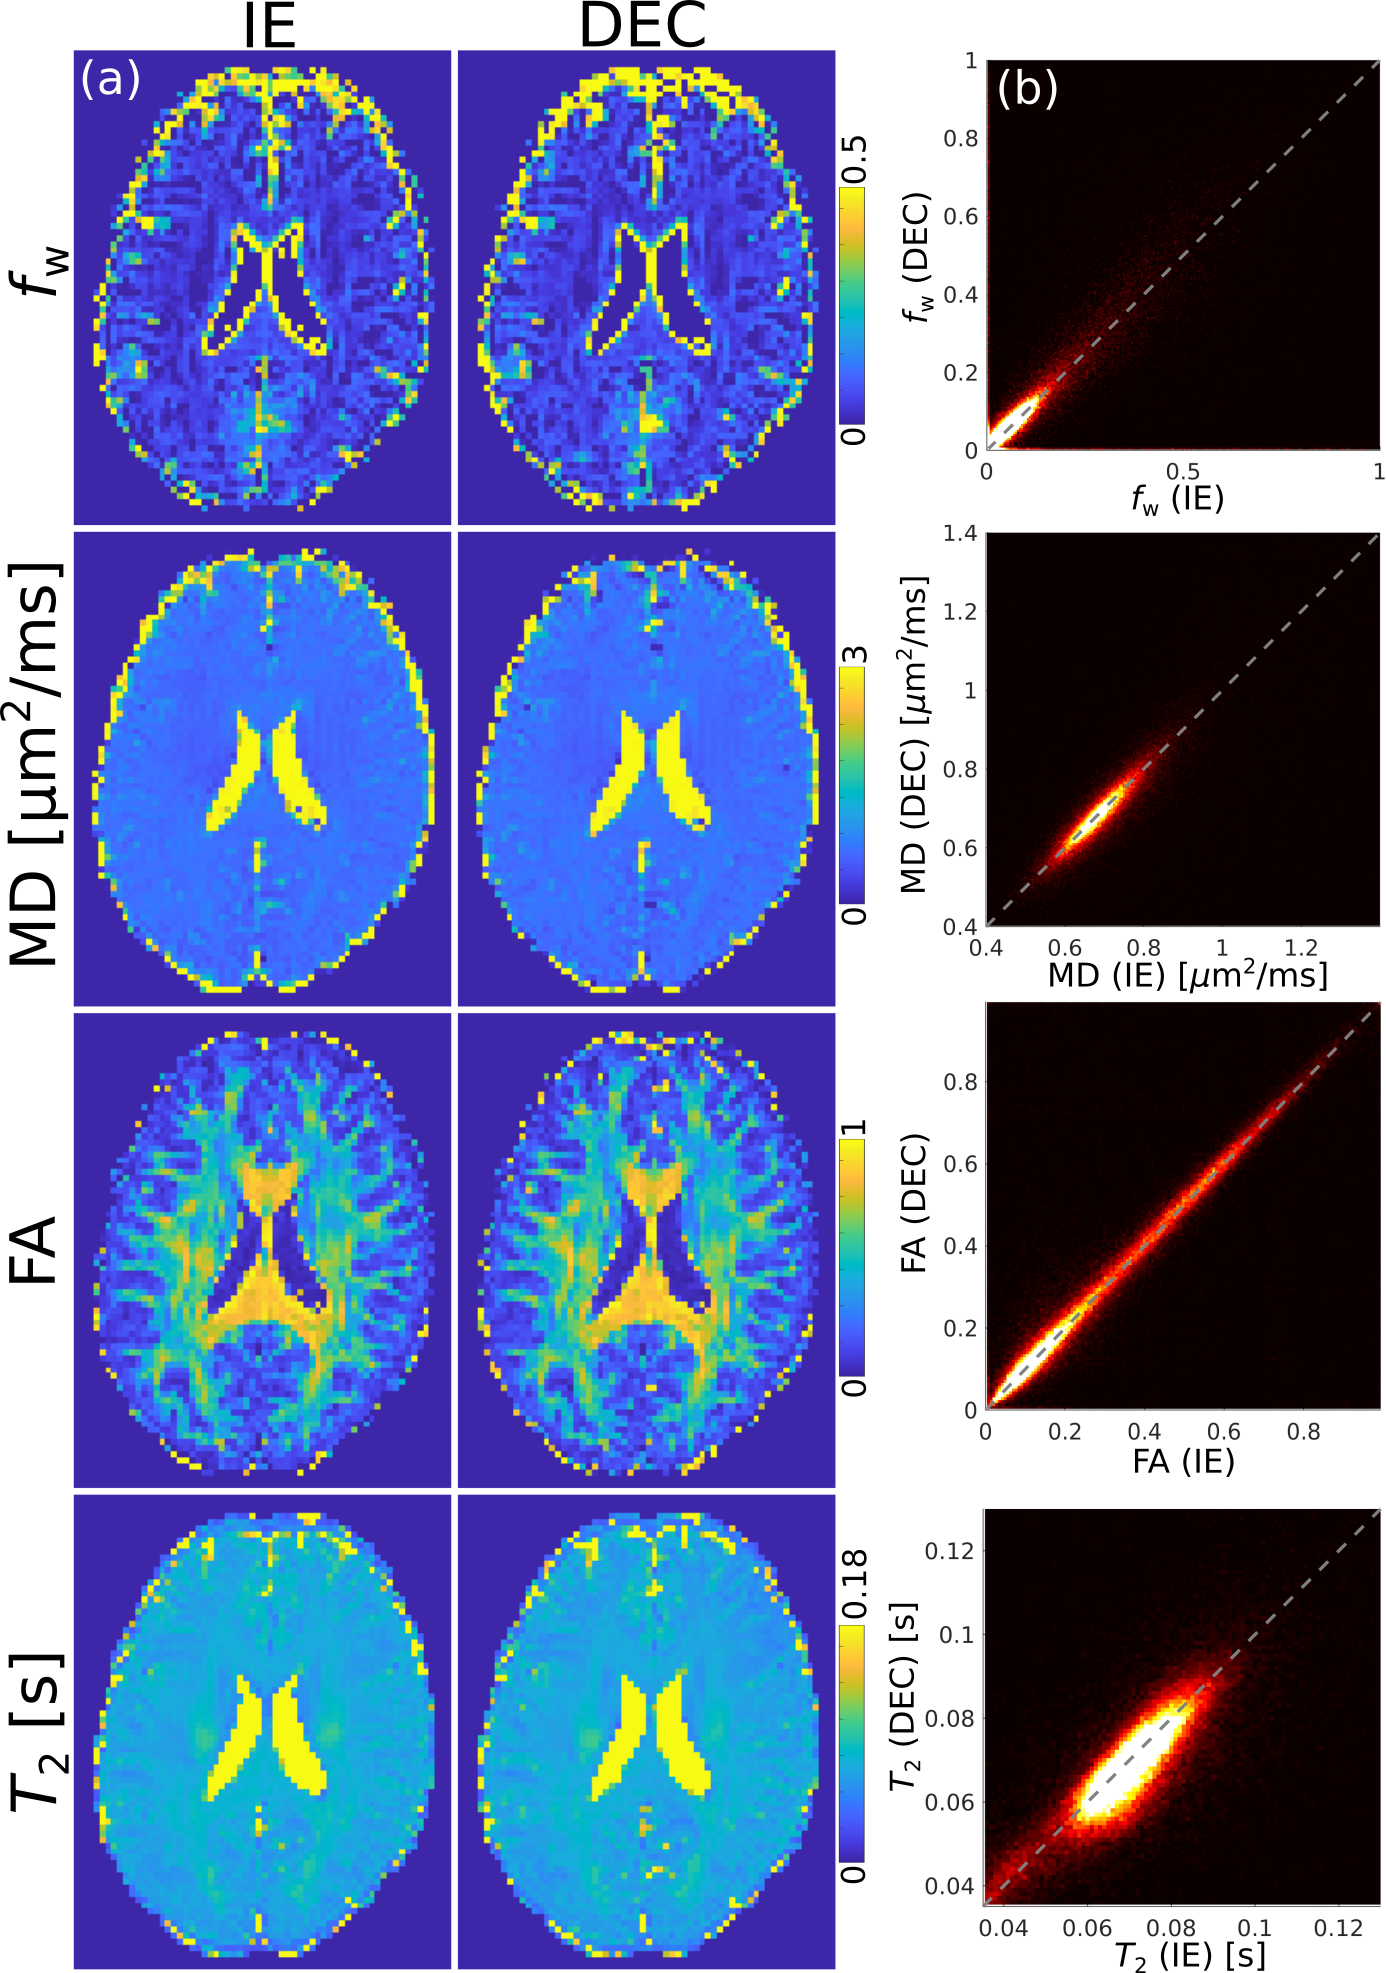
Fig.5 demonstrates the application of the DEC approach for the assessment of FWET2 parameters.
Discussion and conclusions
The acquisition of a dual-echo Stejskal-Tanner sequence reduced the acquisition time by a factor of two in the presented diffusion- and T2-weighted experiments, for the case in which 2 echoes are required. Imperfections in the refocusing flip-angle lead to a reduction of the signal amplitude of the second echo in the DE sequence, $$$S_\mathrm{DE}(T_{\mathrm{E},2})$$$, compared to the IE signal, $$$S_\mathrm{IE}(T_{\mathrm{E},2})$$$ (Fig.3).10 We demonstrated that the signal reduction factor is stable over subjects and used this factor to correct $$$S_\mathrm{DE}(T_{\mathrm{E},2})$$$. The DTIT2 maps calculated from the DEC data are very similar to the standard IE (Fig.4). Finally, we analysed the experimental data using the FWET2 model, showing that there is a high correlation between model parameters from IE data and DEC data.Acknowledgements
We thank Mrs Claire Rick for proof reading the manuscript.References
1. de Almeida Martins JP, Topgaard D. Multidimensional correlation of nuclear relaxation rates and diffusion tensors for model-free investigations of heterogeneous anisotropic porous materials. Scientific Reports. 2018;8(1).
2. Veraart J, Novikov DS, Fieremans E. TE dependent Diffusion Imaging (TEdDI) distinguishes between compartmental T2 relaxation times. NeuroImage. 2018;182:360-369. doi:10.1016/j.neuroimage.2017.09.030
3. Collier Q, Veraart J, den Dekker A, Vanhevel F, Parizel P, Sijbers J. Solving the free water elimination estimation problem by incorporating T2 relaxation properties. In: Proceedings of 25th Annual Meeting of ISMRM, Honolulu, Hawaii, USA. ; 2017:1783.
4. Buschbeck RP, Farrher E, Cho K-H, et al. A Multi-Echo Stejskal-Tanner EPI Sequence for Rapid Measurements of T2 and Diffusion Tensor Correlations. In: Proceedings of the Annual ISMRM Meeting 2019, Montreal, QC, Canada. ; 2019:3511. http://indexsmart.mirasmart.com/ISMRM2019/PDFfiles/3511.html.
5. Farrher E, Buschbeck RP, Choi C-H, et al. In vivo DTI-based free-water elimination with T2-weighting. In: Proceedings of the Joint Annual Meeting ISMRM-ESMRMB 2018, Paris, France. ; 2018:1629. http://indexsmart.mirasmart.com/ISMRM2018/PDFfiles/1629.html.
6. Manjón JV, Coupé P, Concha L, Buades A, Collins DL, Robles M. Diffusion Weighted Image Denoising Using Overcomplete Local PCA. PLOS ONE. 2013;8(9):e73021. doi:10.1371/journal.pone.0073021
7. Andersson JLR, Skare S, Ashburner J. How to correct susceptibility distortions in spin-echo echo-planar images: application to diffusion tensor imaging. NeuroImage. 2003;20(2):870-888. doi:10.1016/S1053-8119(03)00336-7
8. Basser PJ, Pierpaoli C. Microstructural and physiological features of tissues elucidated by quantitative-diffusion-tensor MRI. Journal of Magnetic Resonance. 2011;213(2):560-570. doi:10.1016/j.jmr.2011.09.022
9. Gras V, Abbas Z, Shah NJ. Spoiled FLASH MRI with slice selective excitation: Signal equation with a correction term. Concepts in Magnetic Resonance Part A. 2013;42(3):89-100. doi:10.1002/cmr.a.21264
10. Petrovic A, Scheurer E, Stollberger R. Closed-form solution for T2 mapping with nonideal refocusing of slice selective CPMG sequences. Magnetic Resonance in Medicine. 2015;73(2):818-827. doi:10.1002/mrm.25170
Figures