4298
Noninvasive Detection of Cell Membrane Permeability with Filter-Exchange Imaging
Athanasia Kaika1,2, Mathias Schillmaier1,2, Geoffrey J. Topping1,2, and Franz Schilling1,2
1Technical University of Munich, Munich, Germany, 2Nuclear Medicine, Klinikum rechts der Isar, Munich, Germany
1Technical University of Munich, Munich, Germany, 2Nuclear Medicine, Klinikum rechts der Isar, Munich, Germany
Synopsis
Filter-Exchange Imaging (FEXI) is a noninvasive double-diffusion imaging method, sensitive to transmembrane water exchange, which is strongly connected to cell viability. A FEXI sequence was implemented and tested in vitro with baker’s yeast. Upon permeabilization with ethanol, AXR increased whereas ADC decreased, more so with increasing ethanol concentration. AXR reduced over time, but only minor changes in ADC, intracellular volume and Trypan staining were detected.
Purpose
The alteration of cell membrane water permeability is a common cell feature that reflects fundamental biological processes involved in the development of cancer and during cell death1,2. Recently, a novel MRI method named ‘filter-exchange imaging’ (FEXI) has been presented that non-invasively detects transmembrane water exchange, quantified by the so-called apparent exchange rate (AXR)3-5. The aim of this work was to establish an imaging protocol to map relative cell membrane permeability changes under different permeabilization conditions in vitro by using FEXI.Methods
PhantomsIn vitro experiments were carried out in three phantoms containing suspensions of baker’s yeast.
- On top of the yeast suspension, a thick layer of detergent was added for cell permeabilization and to generate AXR contrast as described previously by Lasič et al.4
- Yeast was mixed with DPBS (2:1 w/w). After 15h, the suspension was centrifuged (10 min; 2000rpm). A temperature sensor with 0.1°C accuracy was placed in the phantom.
- Yeast cells were permeabilized with ethanol solutions (3%, 13%, 23%) containing DPBS8.
MR measurement
All experiments were performed on a 7T small animal MRI scanner (Agilent/GE/Bruker) using a 1H/13C dual channel resonator (RAPID Biomedical). Imaging parameters of the FEXI sequence (Figure 1) included: diffusion filter at b-value of 1300 s/mm2, diffusion encoding (parallel to diffusion filter) at b-values of [123, 277, 477, 677, 977]s/mm2 and [47.5, 222, 422, 622, 922]s/mm2 (for experiment with ethanol), mixing times (tm) of [33.4 93.4 163.4 213.4 303.4]ms, gradient separation (∆f,∆)=16ms, gradient duration (δf,δ)=4ms, TE=31.3ms and 24.5 ms (for experiment with ethanol), TR= 3500ms, matrix size=32x32, FOV=64x64mm and 48x48mm (for detergent layer experiment), slice thickness 5mm, averages=10, data acquisition time per AXR map = 17min 30sec. Phantoms 1 and 3 were at scanner room temperature (approx. 16°C) and phantom 2 was at 22°C and 31°C.
Image analysis
The signal acquired at different b-values in each FEXI acquisition was fitted voxel by voxel to equation 1 to generate parametric ADC maps for each mixing time. Then, parametric maps of AXR and filter efficiency (σ) were calculated according to equations 2 and 3.
$$ S (b,t_m) = S_f (t_m ) exp(-b\cdot ADC’(t_m)) \quad \quad [Eq. 1]$$
$$ ADC’(t_m)=ADC[1-σ \exp(-AXR \cdot t_m)] \quad \quad [Eq. 2] $$
$$ σ =1-\frac{ADC’(0)}{ADC} \quad \quad [Eq. 3] $$
where $$$ S_f (t_m ) $$$ is the signal intensity before the application of the detection module and $$$ ADC’(t_m) $$$ the filtered ADC for each mixing time.
Microscopy
Viability assessment of the baker’s yeast cells were performed with an optical microscope (Olympus BH2) and Trypan blue staining. The intracellular volume was calculated from the cell cross-section area which was estimated from fluorescence microscope (BZ-9000 (BIOREVO)) bright-field images. The cell cross-section images were analyzed with the software ImageJ.
Results and Discussion
An increase of permeability of a baker’s yeast cell suspension in contact with a detergent was observed by a hyperintense region within an AXR map (Figure 2), seen as peak in the AXR profiles across the sample (Figure 2e). Despite the lack of exchange between the water and the detergent, the AXR value is non-zero in the top layer of the AXR map. This non-zero AXR value stems from the longitudinal relaxation rate difference between the detergent and the water as observed previously4.Cell membrane permeability increases with temperature (Figure 3). The measured AXR value of the baker’s yeast pellet was ̴ 20% lower compared to the results from Åslund, I. et al.5, possibly related to differences in cell preparation.
Phantoms with higher ethanol concentration had higher AXR but lower ADC (Figure 4 and 5). The ethanol penetrates and softens the phosphatidylcholine membrane9.
The AXR values of the yeast pellets treated with 23%, 13% and 3% ethanol (Figure 4) were reduced by 77%, 66% and 63%, respectively, between 210 min and 294 min from start of treatment (Figure 5). However, the intracellular volume, estimated from fluorescence microscope bright-field images (Figure 5c), and the ADC were almost constant over this time. After pelleting the cell sample, the contribution of the intracellular water fractional population to the ADC becomes higher. The mean intracellular volume decreases with an increase in ethanol concentration (Figure 5) and thus leads to a reduction of the measured ADC.
No difference in the viability of treated cells with ethanol concentration was observed after staining the samples with Trypan blue.
Conclusion
FEXI is able to detect cell membrane permeability alterations of living cells without requiring contrast agents. Measurements of baker’s yeast cells permeabilized by different ethanol concentrations show changes of AXR over time, whereas no changes in ADC and in the Trypan staining were detected. As FEXI is compatible with the hardware constraints of clinical MRI scanners, it may be a valuable tool to monitor treatment response of pathologies which are subject to changes in membrane permeability.Acknowledgements
The present work was supported by the Deutsche Forschungsgemeinschaft (DFG, German Research Foundation – 391523415, SFB 824).References
- Ruggiero MR, Baroni S, Pezzana S, et al. Evidence for the Role of Intracellular Water Lifetime as a Tumour Biomarker Obtained by In Vivo Field-Cycling Relaxometry. Angew Chem Int Ed Engl. 2018;57(25):7468–7472.
- Galluzzi L, Vitale I, Aaronson SA, et al. Molecular mechanisms of cell death: recommendations of the Nomenclature Committee on Cell Death 2018. Cell Death Differ. 2018;25(3):486–541.
- Nilsson M, Lätt J, Westen D, et al. Noninvasive mapping of water diffusional exchange in the human brain using filter-exchange imaging. Magn Reson Med. 2013; 69(6): 1573–1581.
- Lasič S, Nilsson M, Lätt J, et al. Apparent exchange rate mapping with diffusion MRI. Magn Reson Med. 2011; 66(2):356-65.
- Aslund I, Nowacka A, Nilsson M, et al. Filter-exchange PGSE NMR determination of cell membrane permeability. Magn Reson Med. 2011; 66(2):356-65.
- Trawczyńska I, Miłek J, Sylwia JK. Effect of temperature, concentration of alcohols and time on baker’s yeast permeabilization process. Technical Sciences. 2018; 21(3), 195–206.
- Shinoda W. Permeability across lipid membranes. Biochimica et Biophysica Acta. 2016; 1858 (10), 2254-2265.
Figures
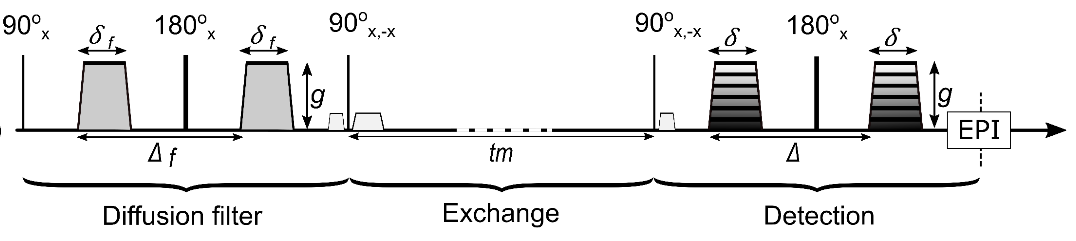
Figure 1: Schematic
representation of FEXI pulse sequence. 1. A diffusion filter module that
filters the fast diffusing component such as water in the extracellular space.
2. A storage/exchange module during which the magnetization is stored along the
longitudinal axis, during which exchange between intra and extracellular compartments
takes place. 3. A detection module including an imaging-readout. The spoiler
gradient is applied to dephase the transversal magnetization excited by the
second 90°-pulse.
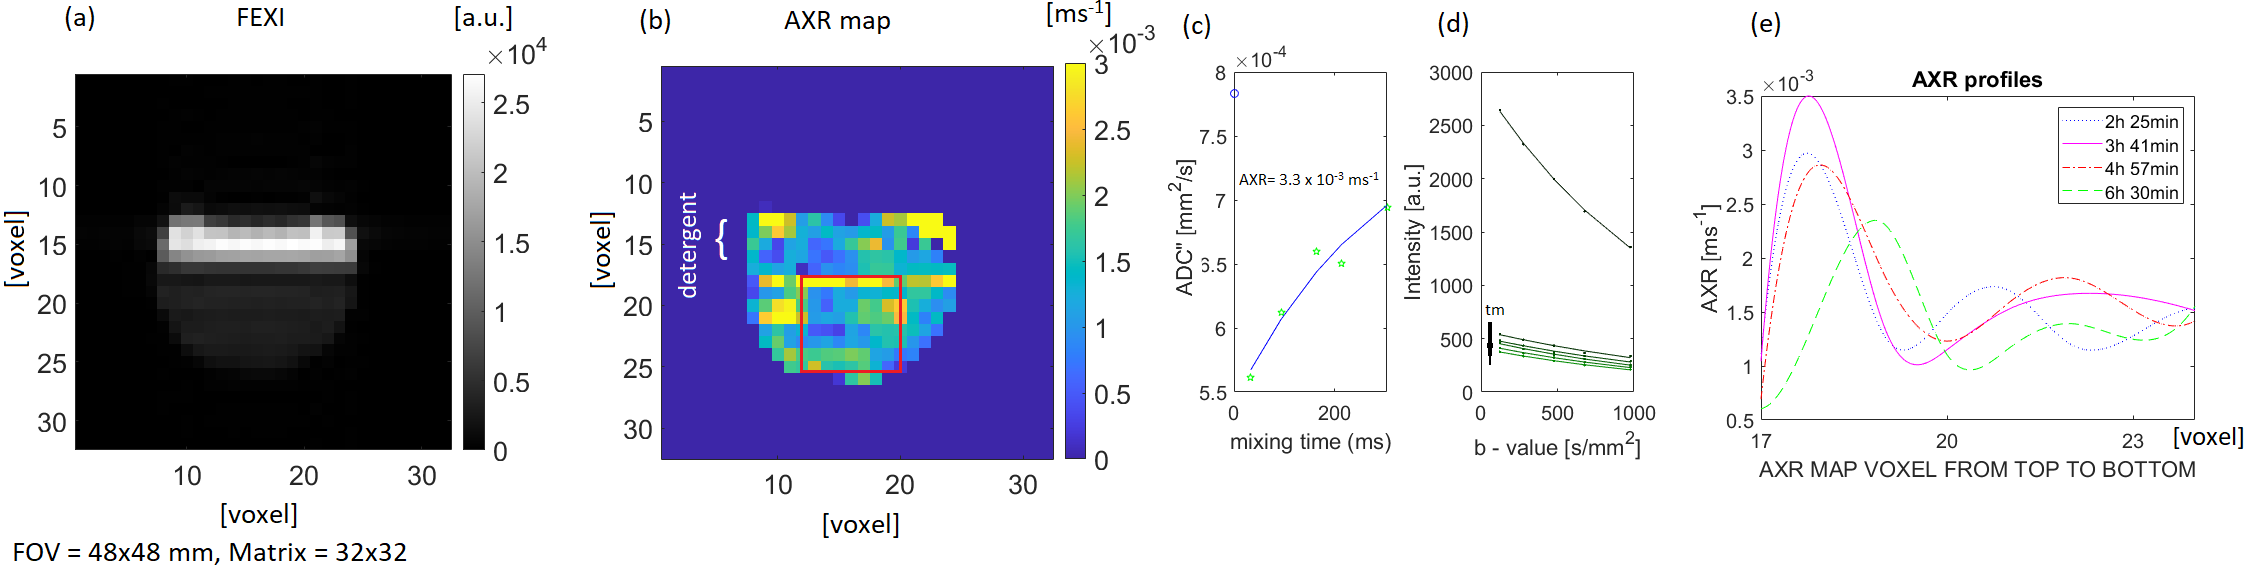
Figure 2: (a)
FEXI image with diffusion filter off, detection module b=123 s/mm2
and minimum mixing time 3.4 ms. (b) AXR map with a hyperintense region
of increased cell membrane permeability at the yeast-detergent interface. (c)
AXR relaxation curve with AXR fit. (d) Single voxel ADC curves fit to the FEXI
signal decay as a function of the detection module b-value without (top curve)
and with diffusion filter. (e) AXR profiles from the red ROI in (b) at
different time intervals after detergent placement.
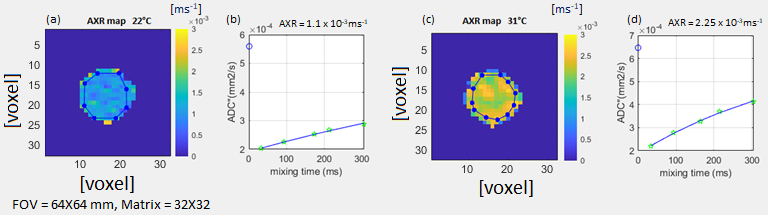
Figure 3: AXR maps of yeast cell pellets when equilibrated
at 22° C (a, b) and 31° C (c, d). The AXR curves were calculated from the mean ROI
signals of the FEXI acquisition (ROIs depicted in blue colour).
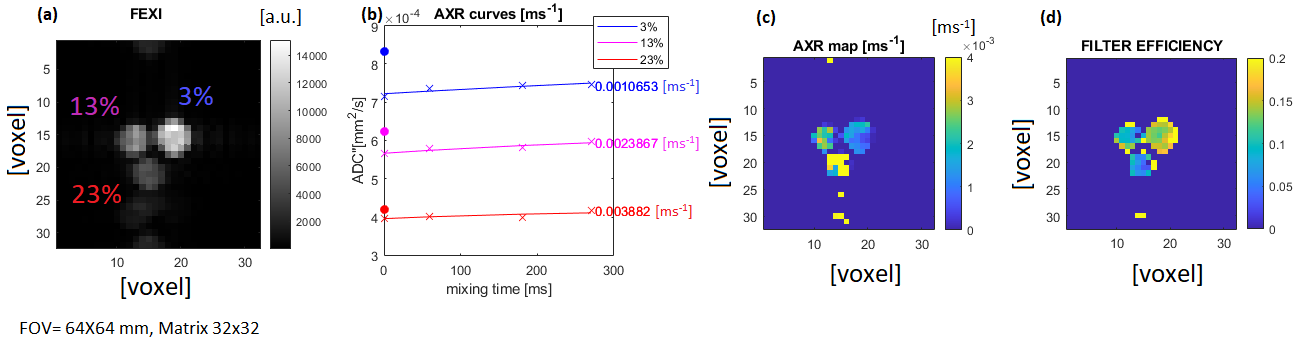
Figure 4: (a)
FEXI reference image of three yeast cell
pellets treated with 3%, 13% and 23% ethanol concentrations.
(b) AXR curves were calculated from the signal mean value in ROIs on the FEXI
images. The ROIs were drawn in the centre of each tube. (c) AXR map. (d) Filter
efficiency map.
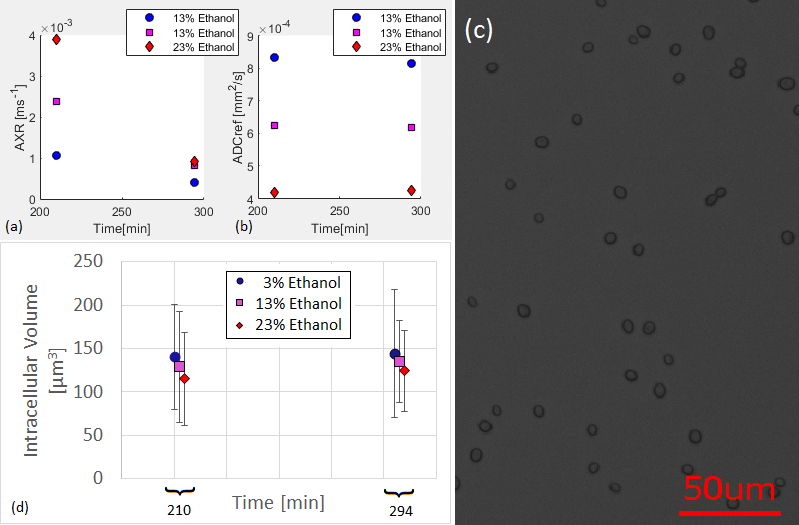
Figure 5: (a, b) FEXI
measurements in yeast cell pellets treated with ethanol over time. The time on
the horizontal axis corresponds to the time interval between the mixing of the
cells with the permeabilizing
solutions and the beginning of
the measurement. The AXR and ADC values were calculated from the signal mean
value in ROIs of the FEXI images. The ROIs were drawn in the centre of each
tube. (c) Fluorescence
microscope bright-field image. (d) Yeast
cells’ intracellular volume.