4291
Relationship between thrombus and aneurysm wall in partially thrombosed intracranial aneurysms visualized with 7T MPRAGE1Erwin L. Hahn Institute for Magnetic Resonance Imaging, University Duisburg-Essen, Essen, Germany, 2Department of Neurosurgery, University Hospital Essen, University Duisburg-Essen, Essen, Germany, 3Department of Neurosurgery, Fukushima Medical University, Fukushima, Japan, 4Department of Diagnostic and Interventional Radiology and Neuroradiology, University Hospital Essen, University Duisburg-Essen, Essen, Germany, 5High Field and Hybrid MR Imaging, University Hospital Essen, University Duisburg-Essen, Essen, Germany, 6Medical Physics in Radiology, German Cancer Research Center (DKFZ), Heidelberg, Germany
Synopsis
This in-vivo study aimed to investigate the relationship between thrombus characteristics and the aneurysm wall (AW) in partially thrombosed intracranial aneurysms (pTIAs) using MPRAGE at 7T MRI. The AWs with the highest signal intensity ratio of thrombus were significantly thicker. In the histopathological examinations, three cases with hypointensity of the thrombus showed only a few macrophages in the thrombus and a thin AW. Three cases with hyperintensity of the thrombus in the MPRAGE showed abundant macrophages in the thrombus. In 7T MPRAGE, the signal intensity ratio of thrombus in pTIAs correlates with AW thickness and histologic features indicating wall instability.
Introduction
Thrombosed intracranial aneurysms are often associated with increased aneurysm wall instability and present a challenge for treatment1. Recently, contrast enhancement in the aneurysm wall of thrombosed ICAs could be visualized in vivo using high-resolution gadolinium-enhanced 7 Tesla (T) magnetic resonance imaging (MRI)2. However, no studies have evaluated the relationship between the thrombus characteristics and the aneurysm wall. This in-vivo study aimed to investigate the relationship between thrombus characteristics and the aneurysm wall in partially thrombosed intracranial aneurysms using MPRAGE at 7T MRI3, 4.Methods
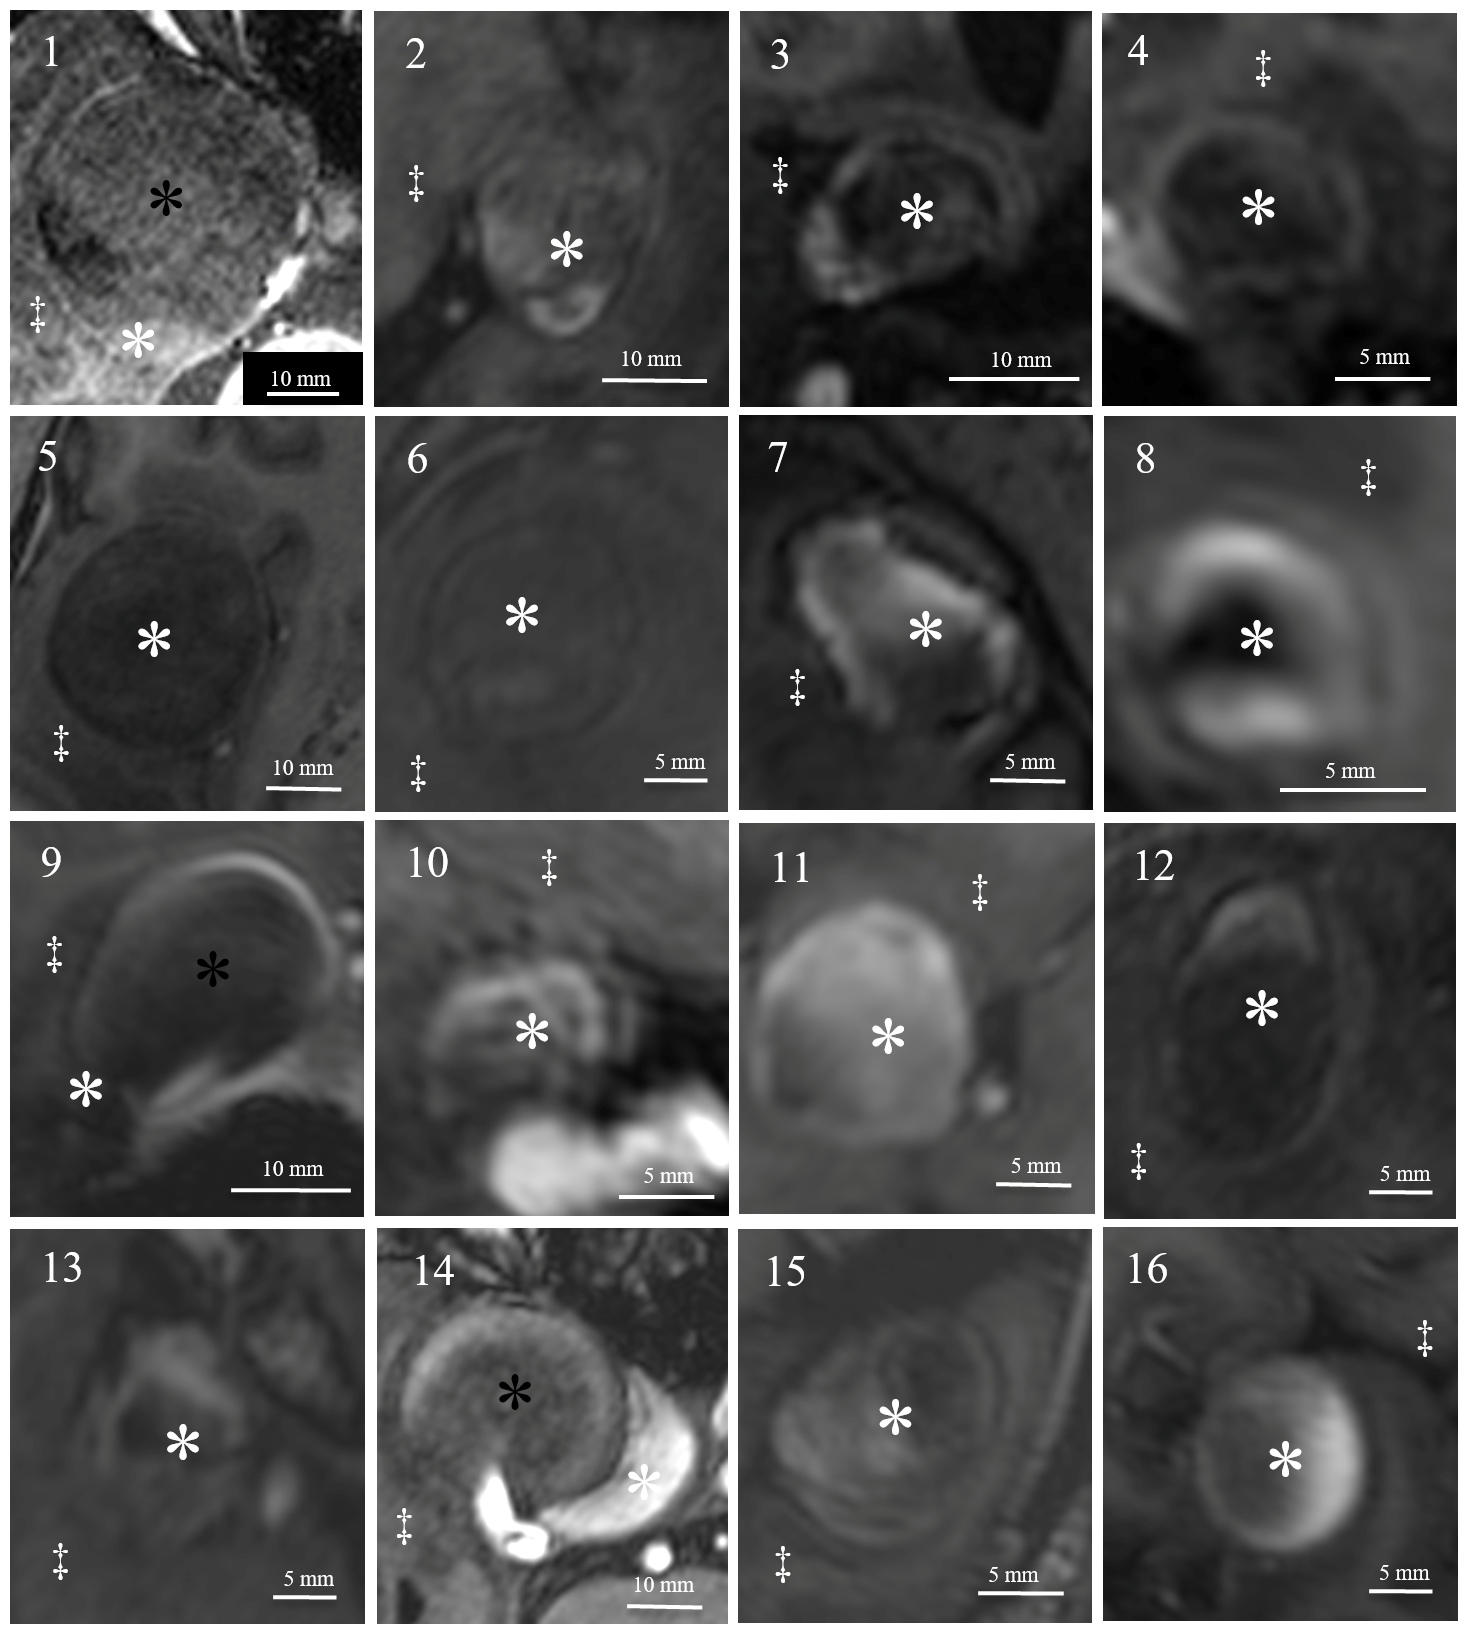
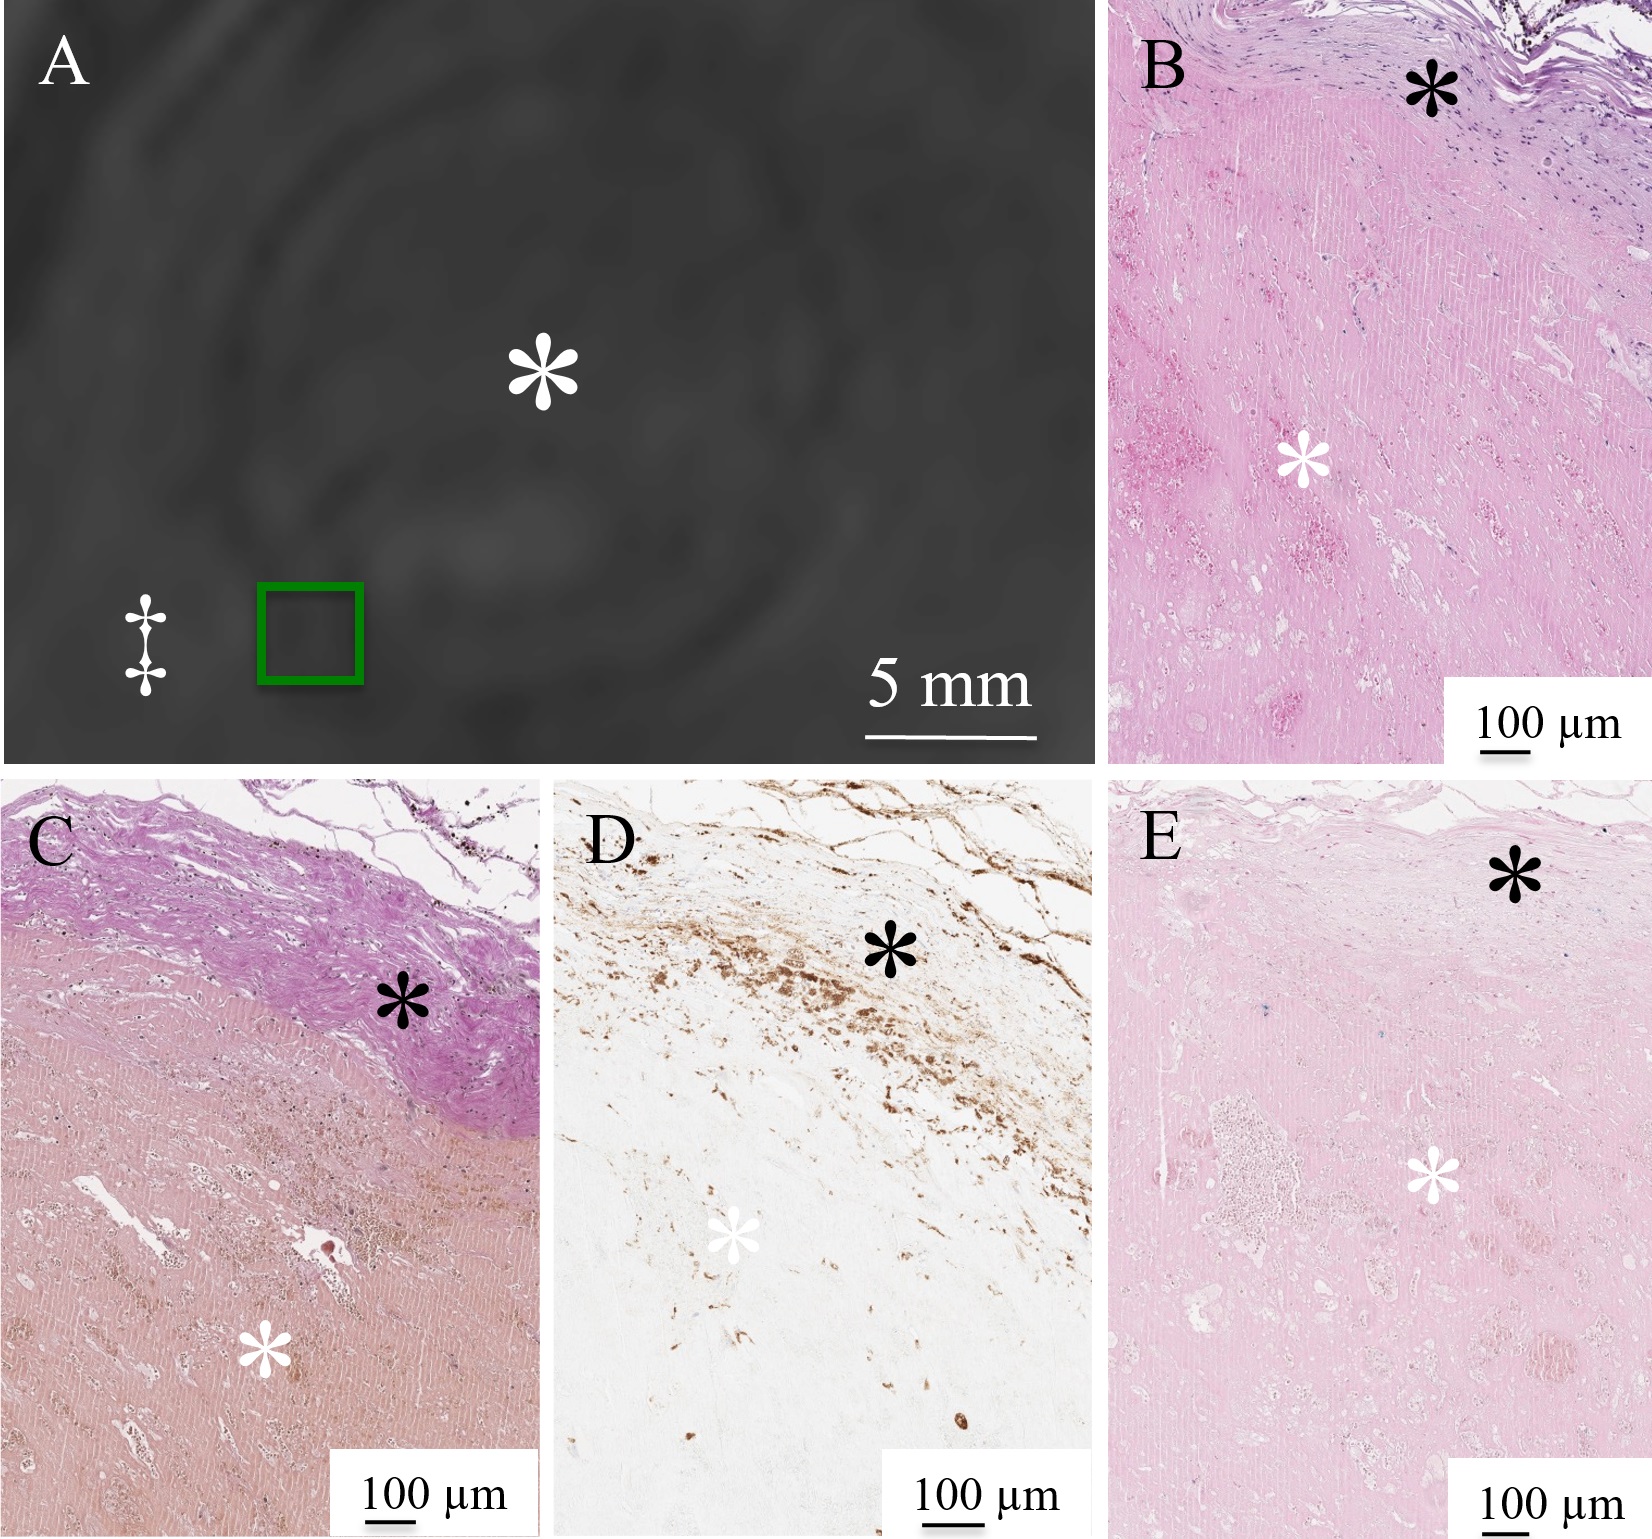
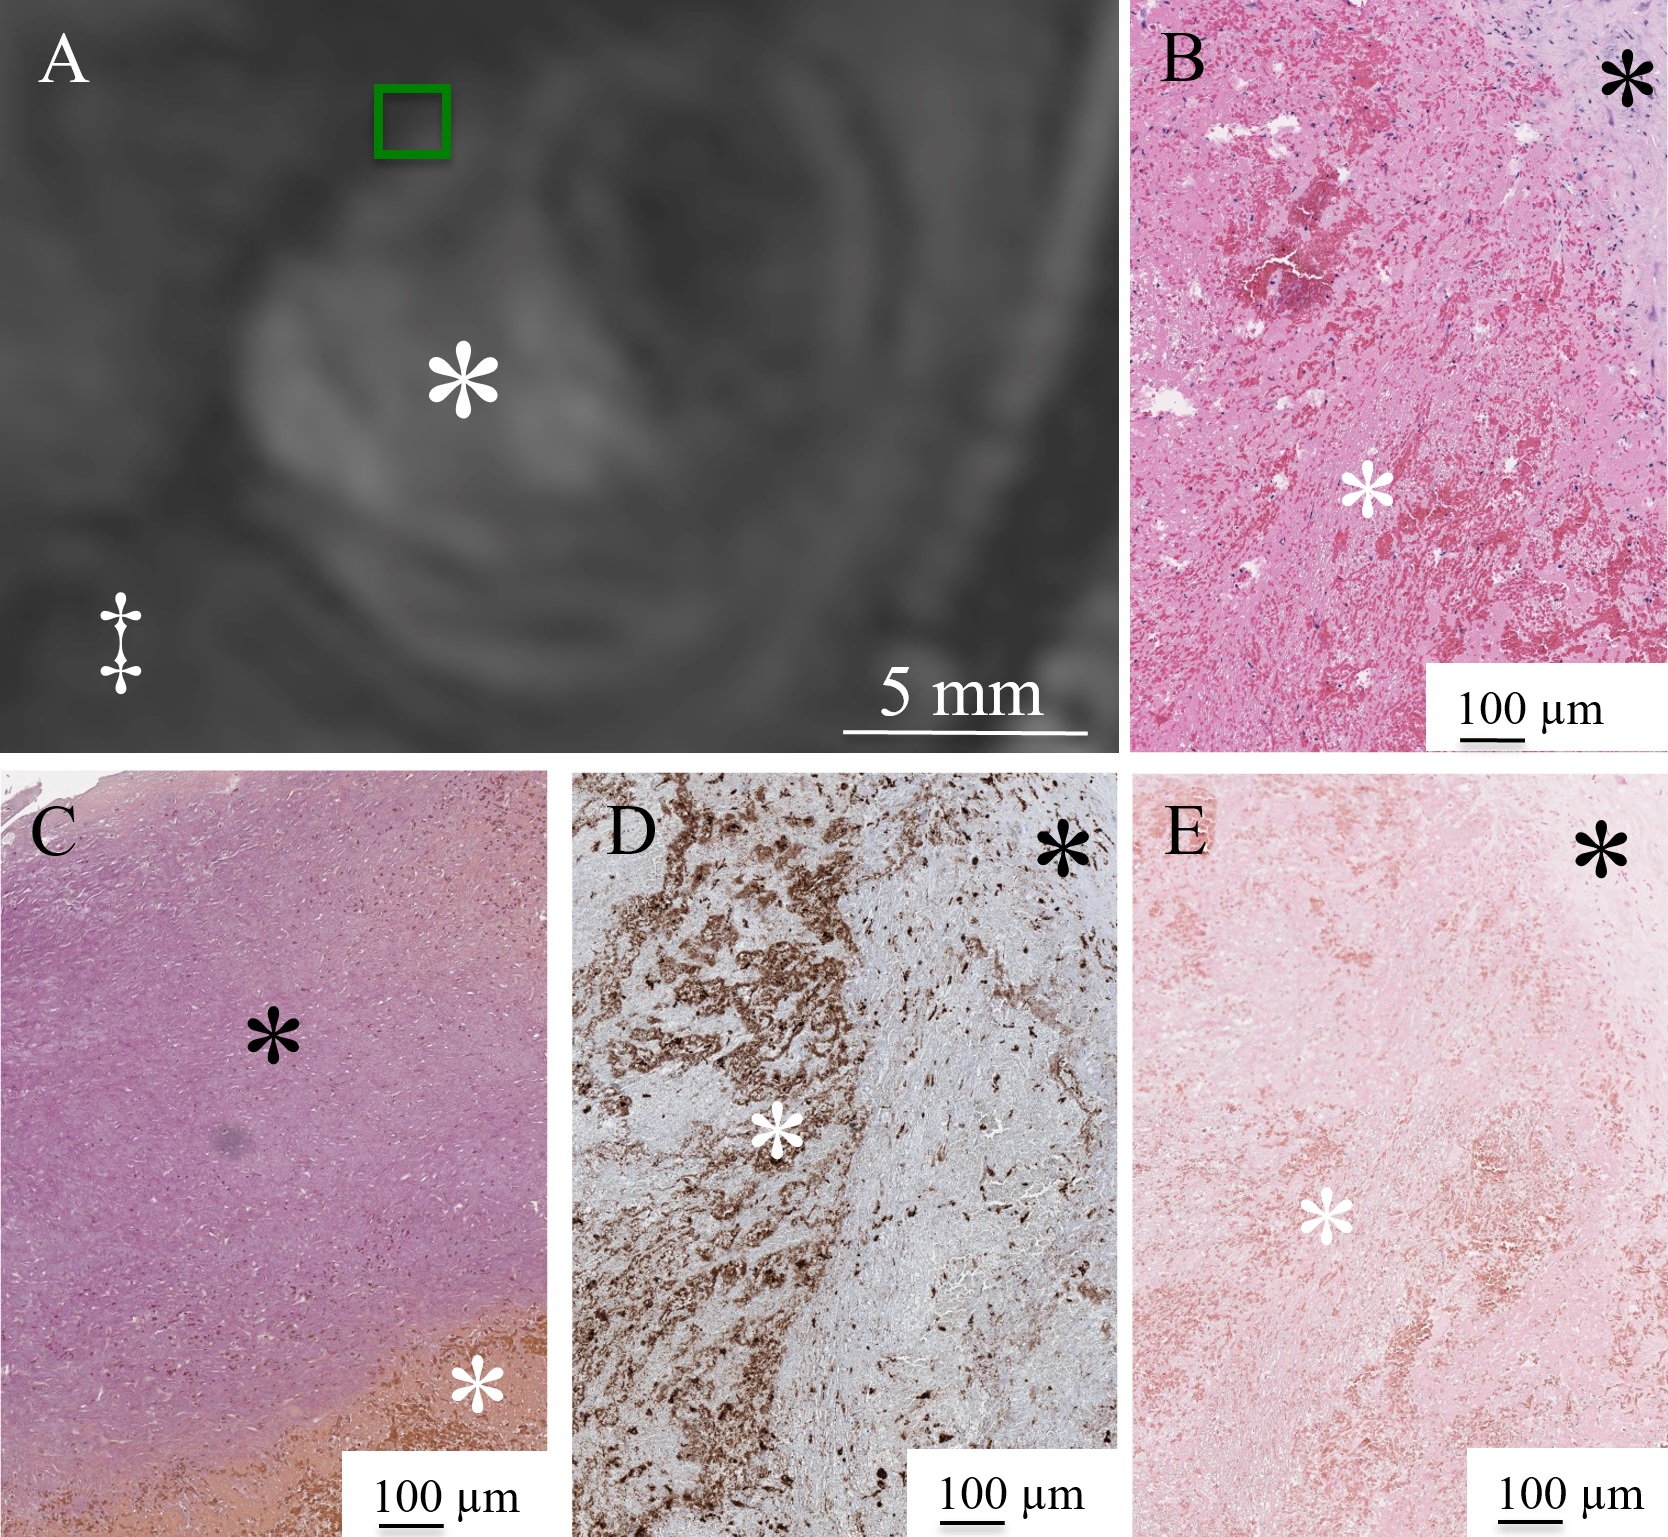
Methods The study cohort included fifteen patients (7 males, 8 females) with sixteen partially thrombosed intracranial aneurysms. All subjects were evaluated utilizing a 7T whole-body MR system (MAGNETOM 7T, Siemens Healthcare GmbH, Erlangen, Germany) equipped with a 1/32-channel Tx/Rx head radiofrequency coil (Nova Medical, Wilmington, USA). The gradient system provides 40 mT/m maximum amplitude and a slew rate of 200 mT /m/ms. A modified MPRAGE sequence was obtained with the following sequence parameters: field of view = 270×236 mm2, matrix = 384×336, resolution = 0.7×0.7 mm 2, slice thickness = 0.7mm, repetition time (TR) = 2500 ms, echo time (TE) = 1.54 ms, flip angle = 7 degrees, bandwidth = 570 Hz/pixel, acquisition time = 6 min 13 sec. The signal intensity ratio in the thrombus was defined as the highest signal intensity in the thrombus divided by the signal intensity in the anterior corpus callosum. The signal intensity ratio in the thrombus was compare d to the thickness of the aneurysm wall at 7T MPRAGE. Histopathological findings in six tissue samples were correlated with 7T MRI to identify the microstructures.Results
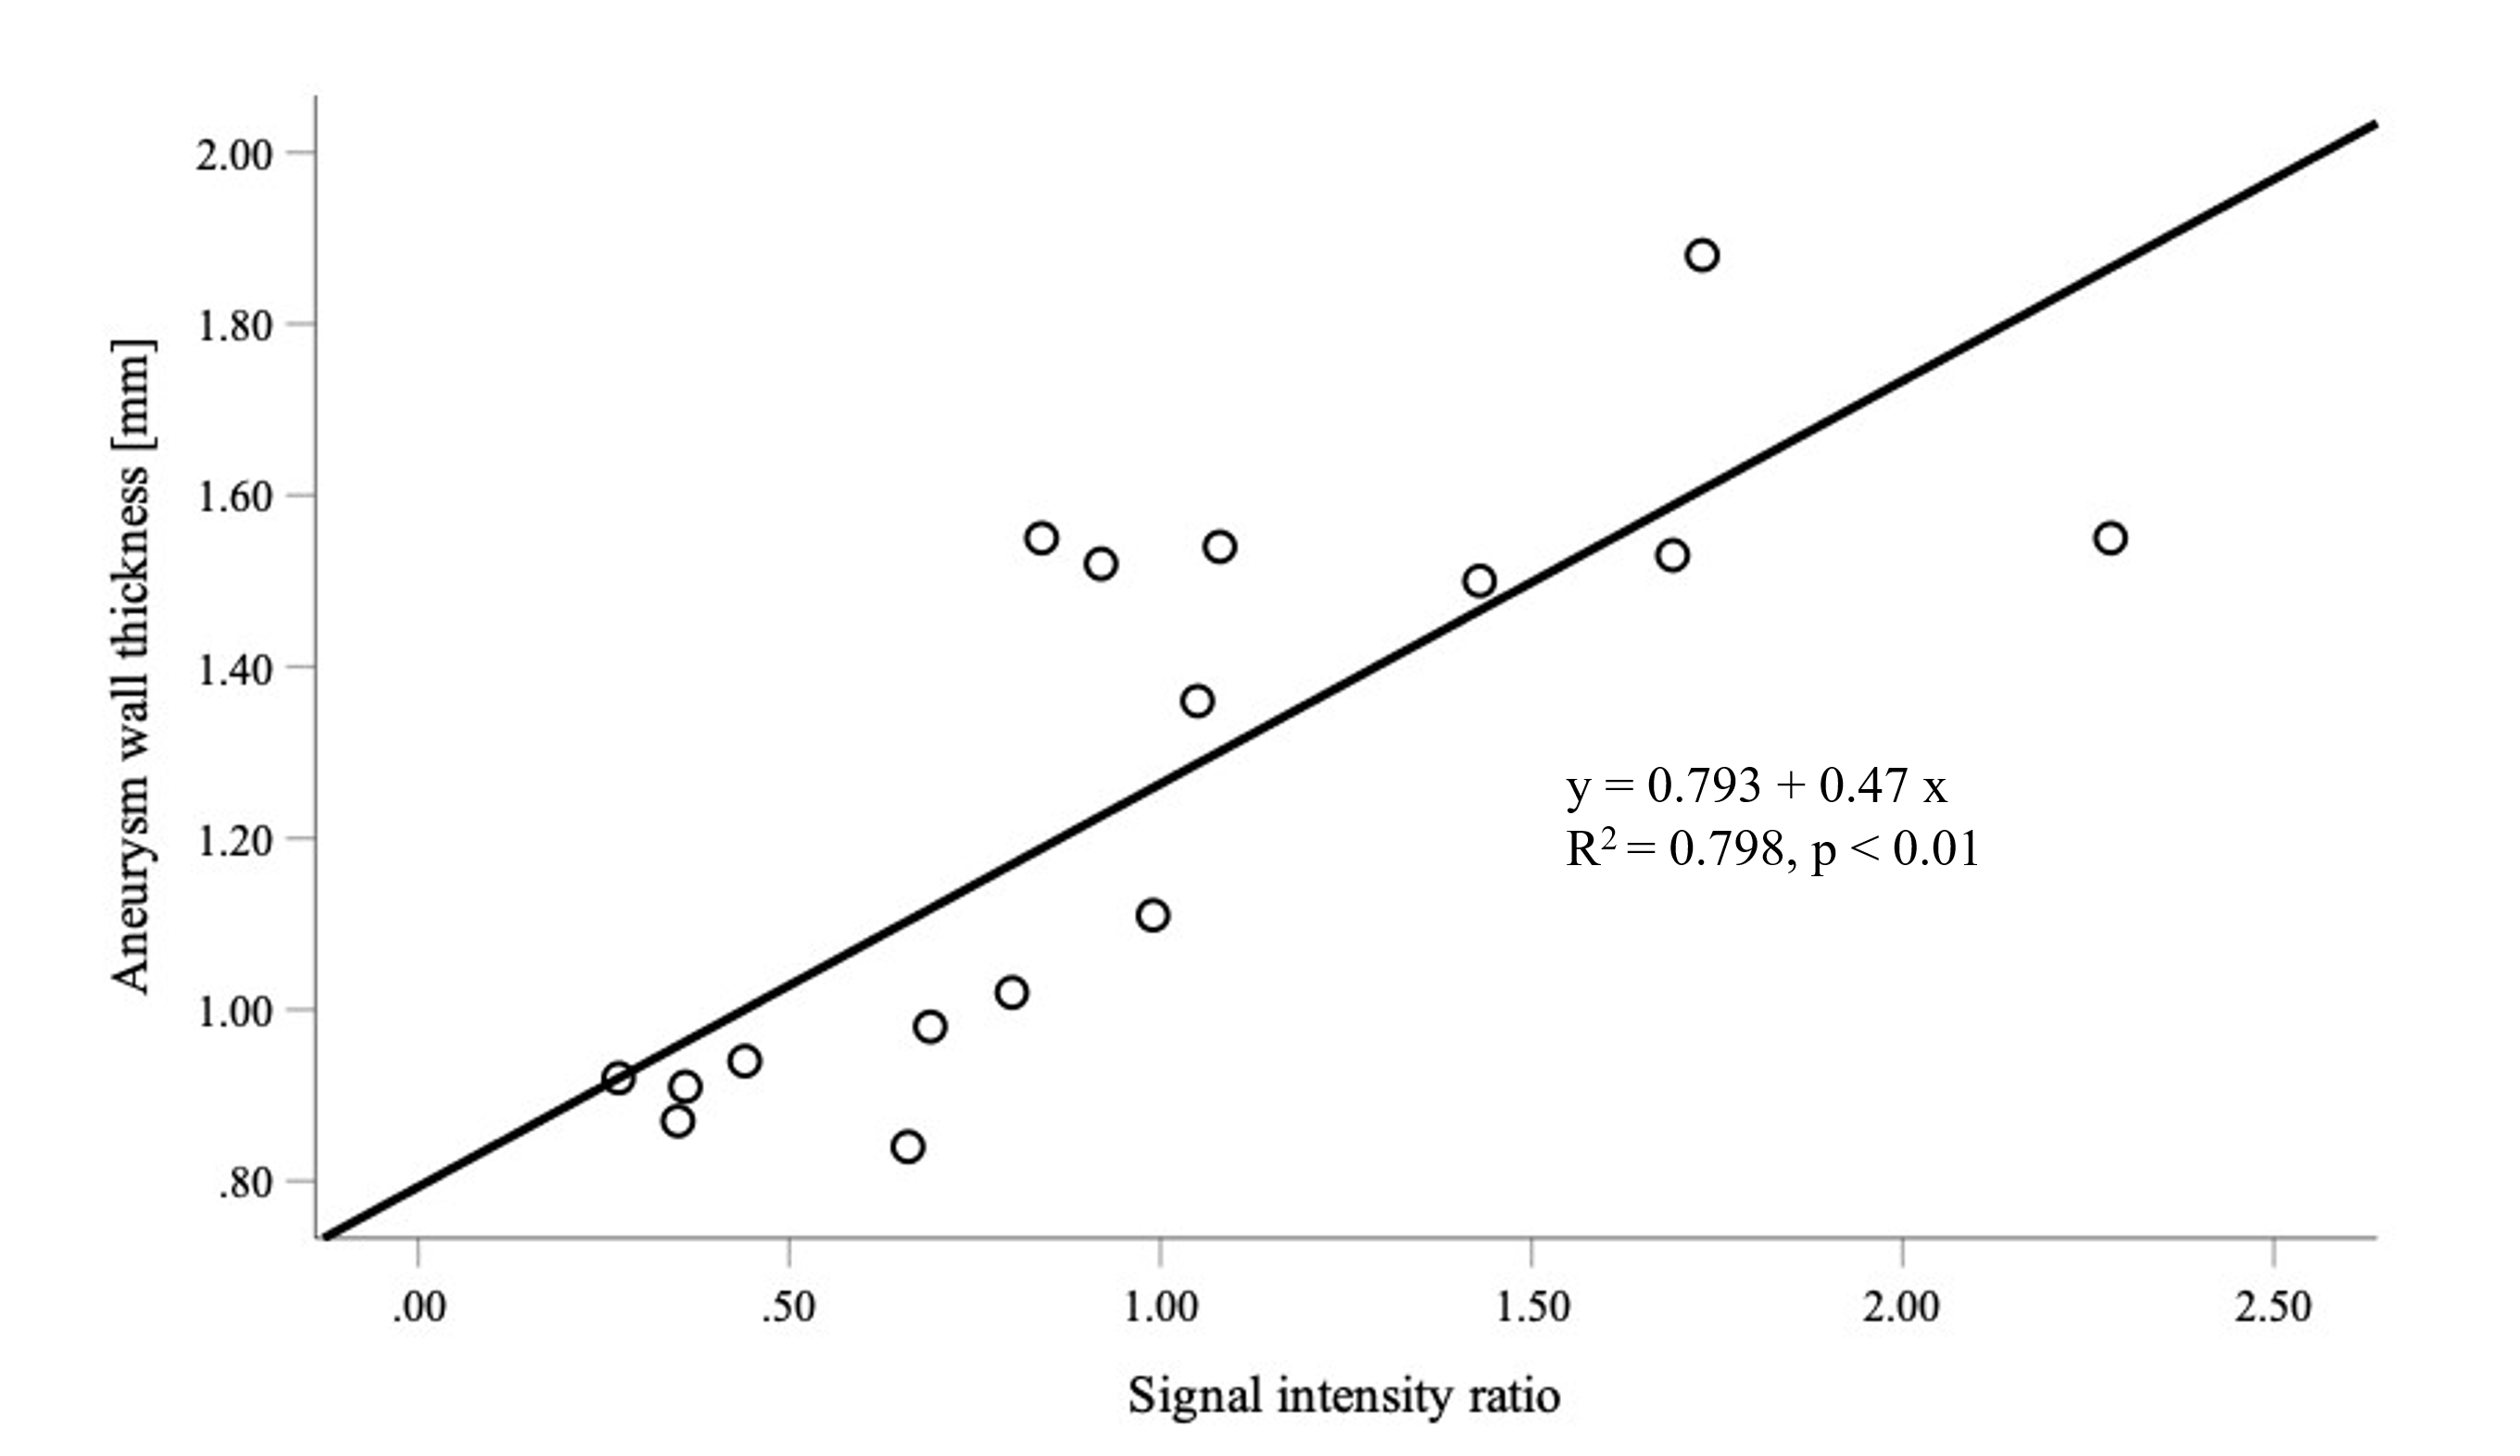
The mean signal intensity ratio of thrombus was 0.97 (standard error of the mean 0.14, range 0.27-2.28). The mean thickness of the aneurysm wall was 1.25 mm (standard error of the mean 0.08, range 0.84-1.55 mm). The signal intensity ratio of thrombus significantly correlated with the thickness of the aneurysm wall (p < 0.01) as shown in Figure 2. The aneurysm walls with the highest signal intensity ratio of thrombus were significantly thicker. In the histopathological examinations, three cases with hypointensity of the thrombus in MPRAGE showed only a few macrophages in the thrombus and a thin, degenerated aneurysmal wall (Figure 3). On the other hand, three cases with hyperintensity of the thrombus in the MPRAGE showed abundant macrophages in the thrombus (Figure 4).Conclusions
In MPRAGE at 7T MRI, the signal intensity ratio of thrombus in partially thrombosed intracranial aneurysms correlates with aneurysm wall thickness and histologic features indicating wall instability.Acknowledgements
No acknowledgement found.References
1. Guresir E, Wispel C, Borger V, et al. Treatment of partially thrombosed intracranial aneurysms: Single-center series and systematic review. World Neurosurg . 2018;118:e834-41
2. Sato T, Matsushige T, Chen B, et al. Wall contrast enhancement of thrombosed intracranial aneurysms at 7t mri. AJNR Am J Neuroradiol. 2019;40:1106-11
3. Wrede KH, Johst S, Dammann P, et al. Caudal image contrast inversion in mprage at 7 tesla: Problem and solution. Acad Radiol. 2012;19:172-78
4. Umutlu L, Theysohn N, Maderwald S, et al. 7 tesla mprage imaging of the intracranial arterial vasculature: Nonenhanced versus contrast-enhanced. Acad Radiol. 2013;20:628-34
Figures