4290
A Comparative Study on High Resolution Prostate Imaging at 7T and 3T MRI1School of Information Technology and Electrical Engineering, The University of Queensland, Brisbane, Australia, 2Centre for Advanced Imaging, The University of Queensland, Brisbane, Australia, 3School of Human Movement and Nutrition Sciences, The University of Queensland, Brisbane, Australia
Synopsis
High-resolution prostate imaging for both 3T and 7T MRI are challenging, given the deep location of this exocrine gland which accentuates technical issues related to the reduced electromagnetic penetration and B1 inhomogeneity. In this work, high-resolution (0.3 x 0.3mm in-plane) non-interpolated T2w-TSE prostate images from a healthy volunteer were acquired at 3T using a commercial 18-channel body matrix and 32-channel spine coil and an 8-channel prototype coil at 7T at 15 slices and 11 slices, respectively. Compared with standard clinical prostate imaging at 3T, the 7T prostate images provided higher SNR and better differentiation of various zones of the prostate.
INTRODUCTION
The prostate is a multi-gland organ located deep within the pelvic region. High resolution prostate imaging is challenging for both 3T and 7T for a variety of reasons. At 7T, the wavelength is only about 11cm inside of the human body 1, leading to reduced field penetration for visualisation of the prostate. In addition, the prominent wavelength effect produces destructive and constructive interferences that may cause signal void in/around the prostate. Although the wavelength effect is not problematic at 3T, the whole-body coil is distant from the patient, resulting in reduced transmit efficiency. In addition, standard commercial receive-only body coil array generally only activate a few elements for imaging the prostate, which undermines the potential signal-to-noise ratio (SNR) improvement. In previous works that using non-invasive surface coil array 2-4, images with 0.8 x 0.8 mm in-place resolution were normally acquired. High resolution (0.35 x 0.35 mm) prostate image was also achievable 5 but with only one slice mainly due to the high SAR. In this work, we acquired high resolution (0.3 x 0.3mm in-plane, non-interpolated) T2 weighted Turbo Spin Echo (T2w-TSE) prostate images at 15 slices and 11 slices at 3T and 7T MRI. The results demonstrated the advantage of 7T prostate imaging with higher SNR and clearer differentiation of different zones of the prostate.METHODS
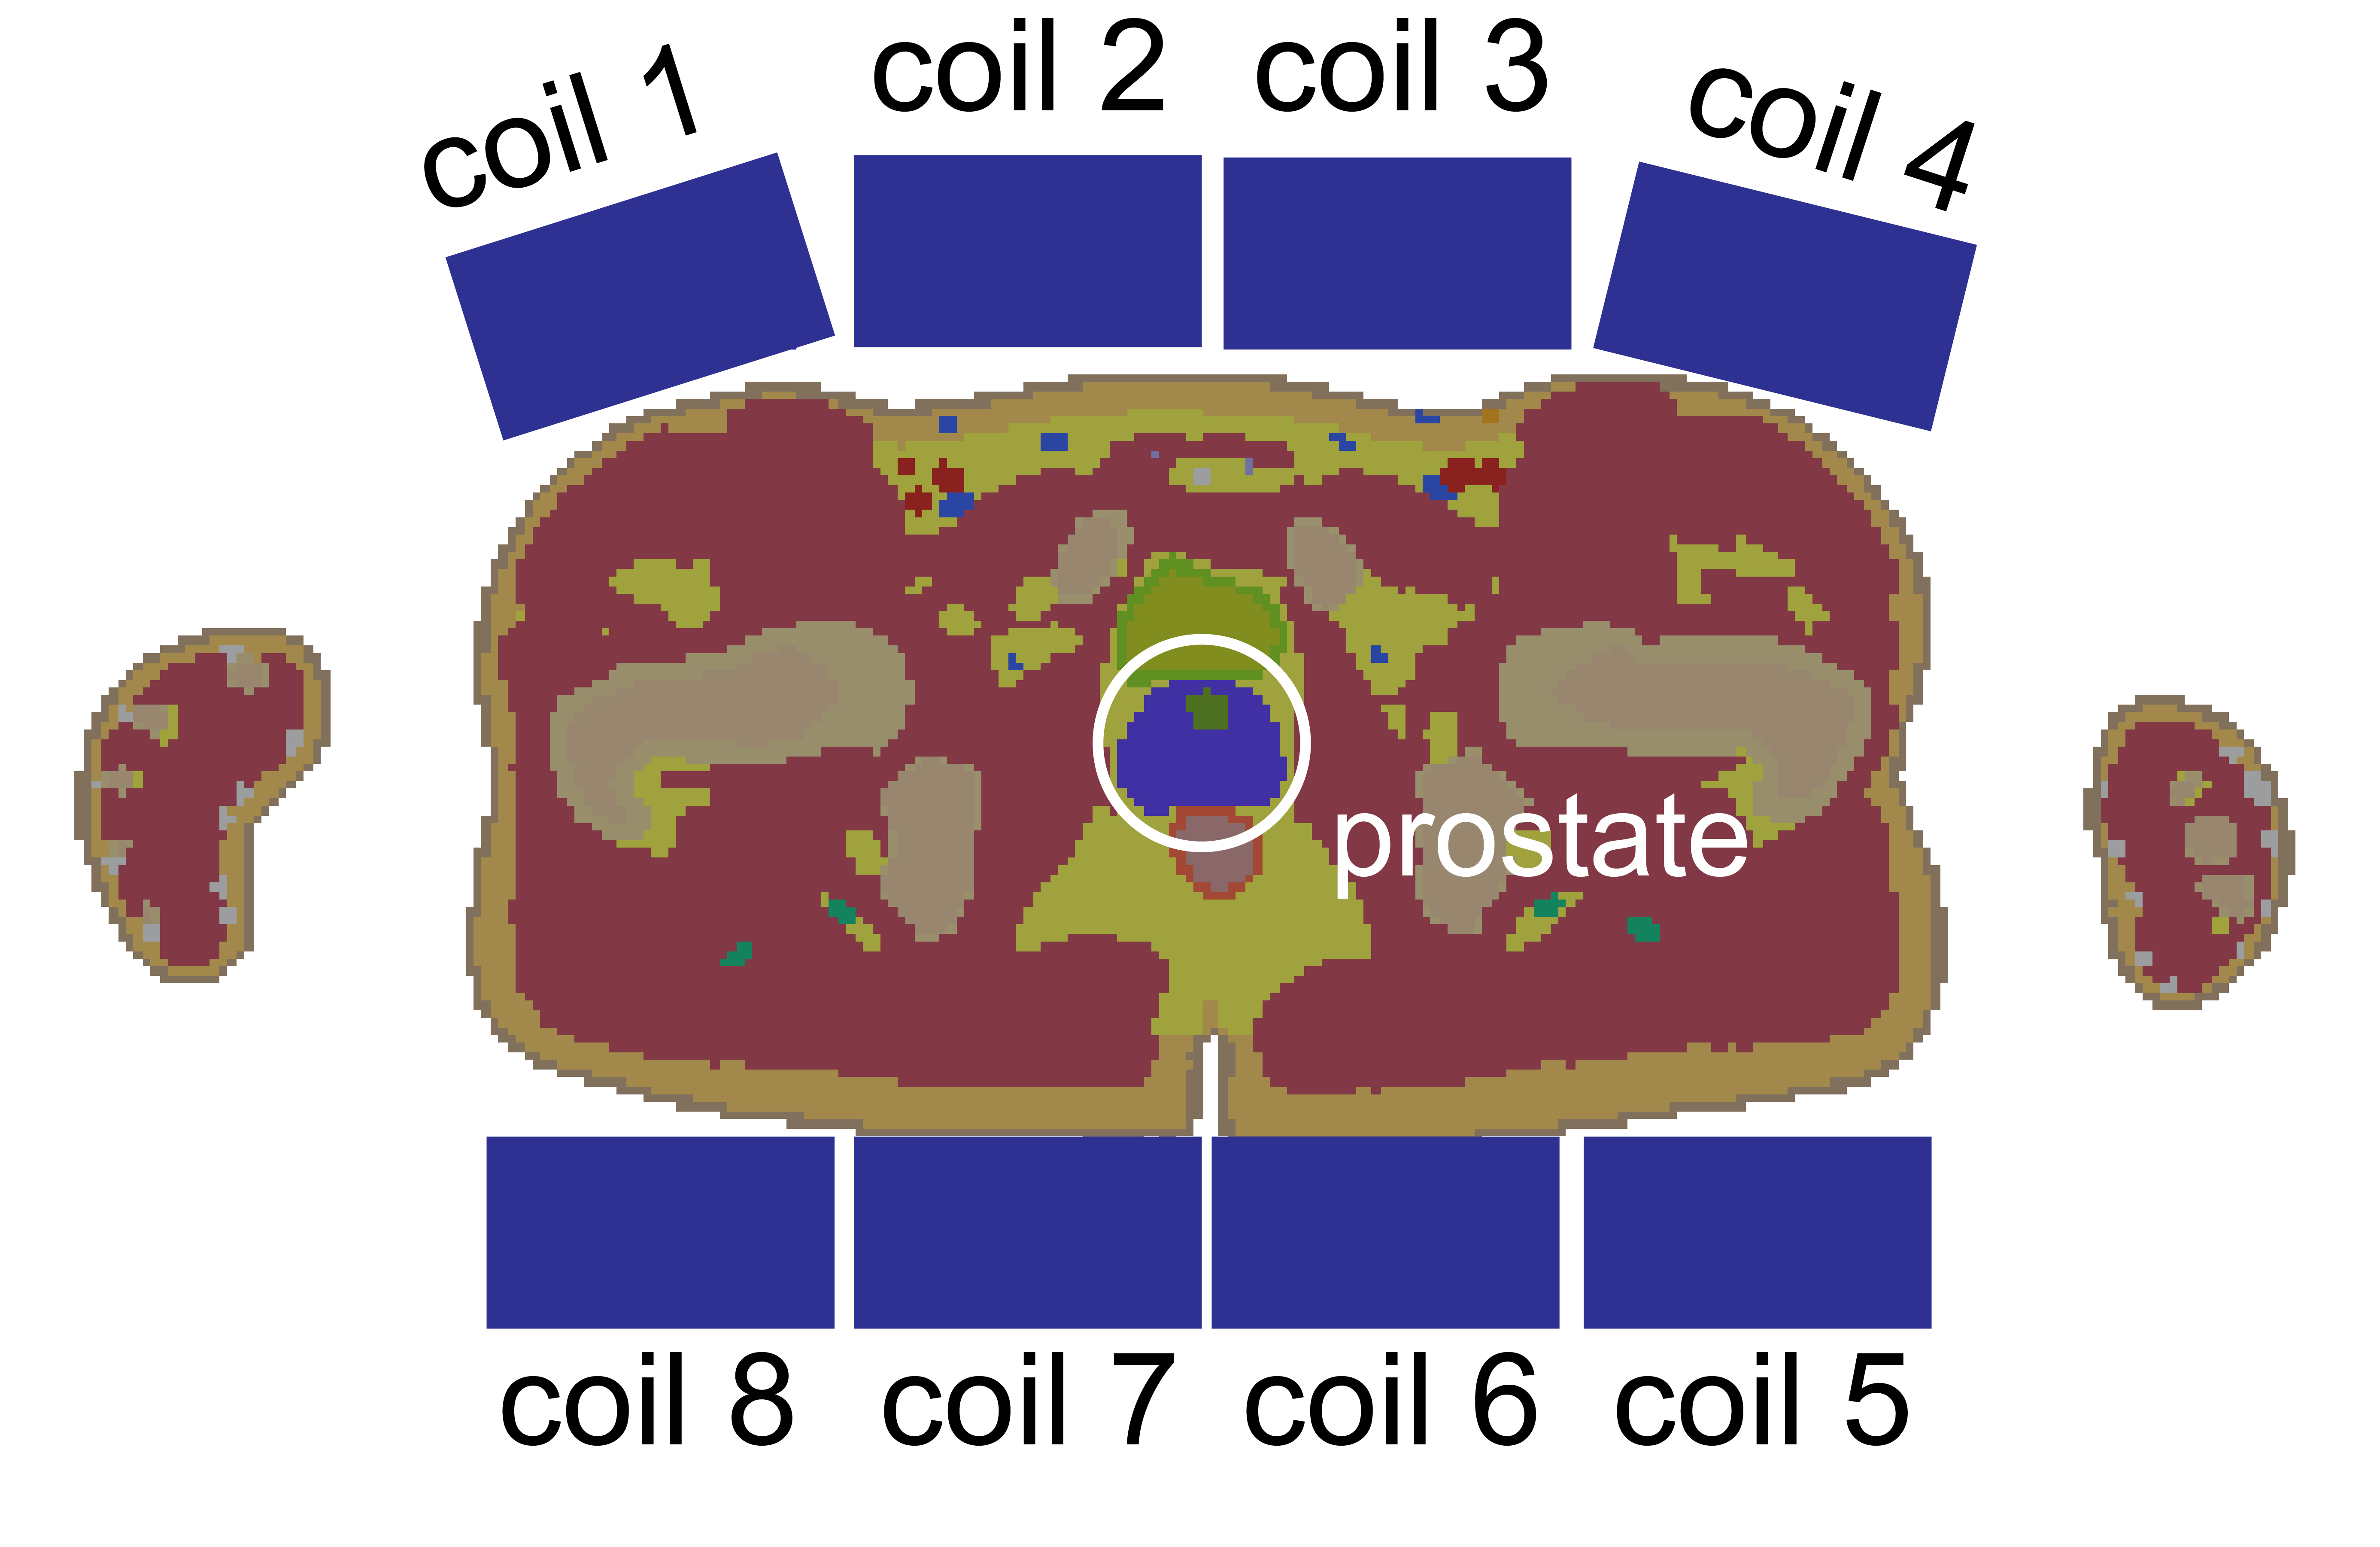
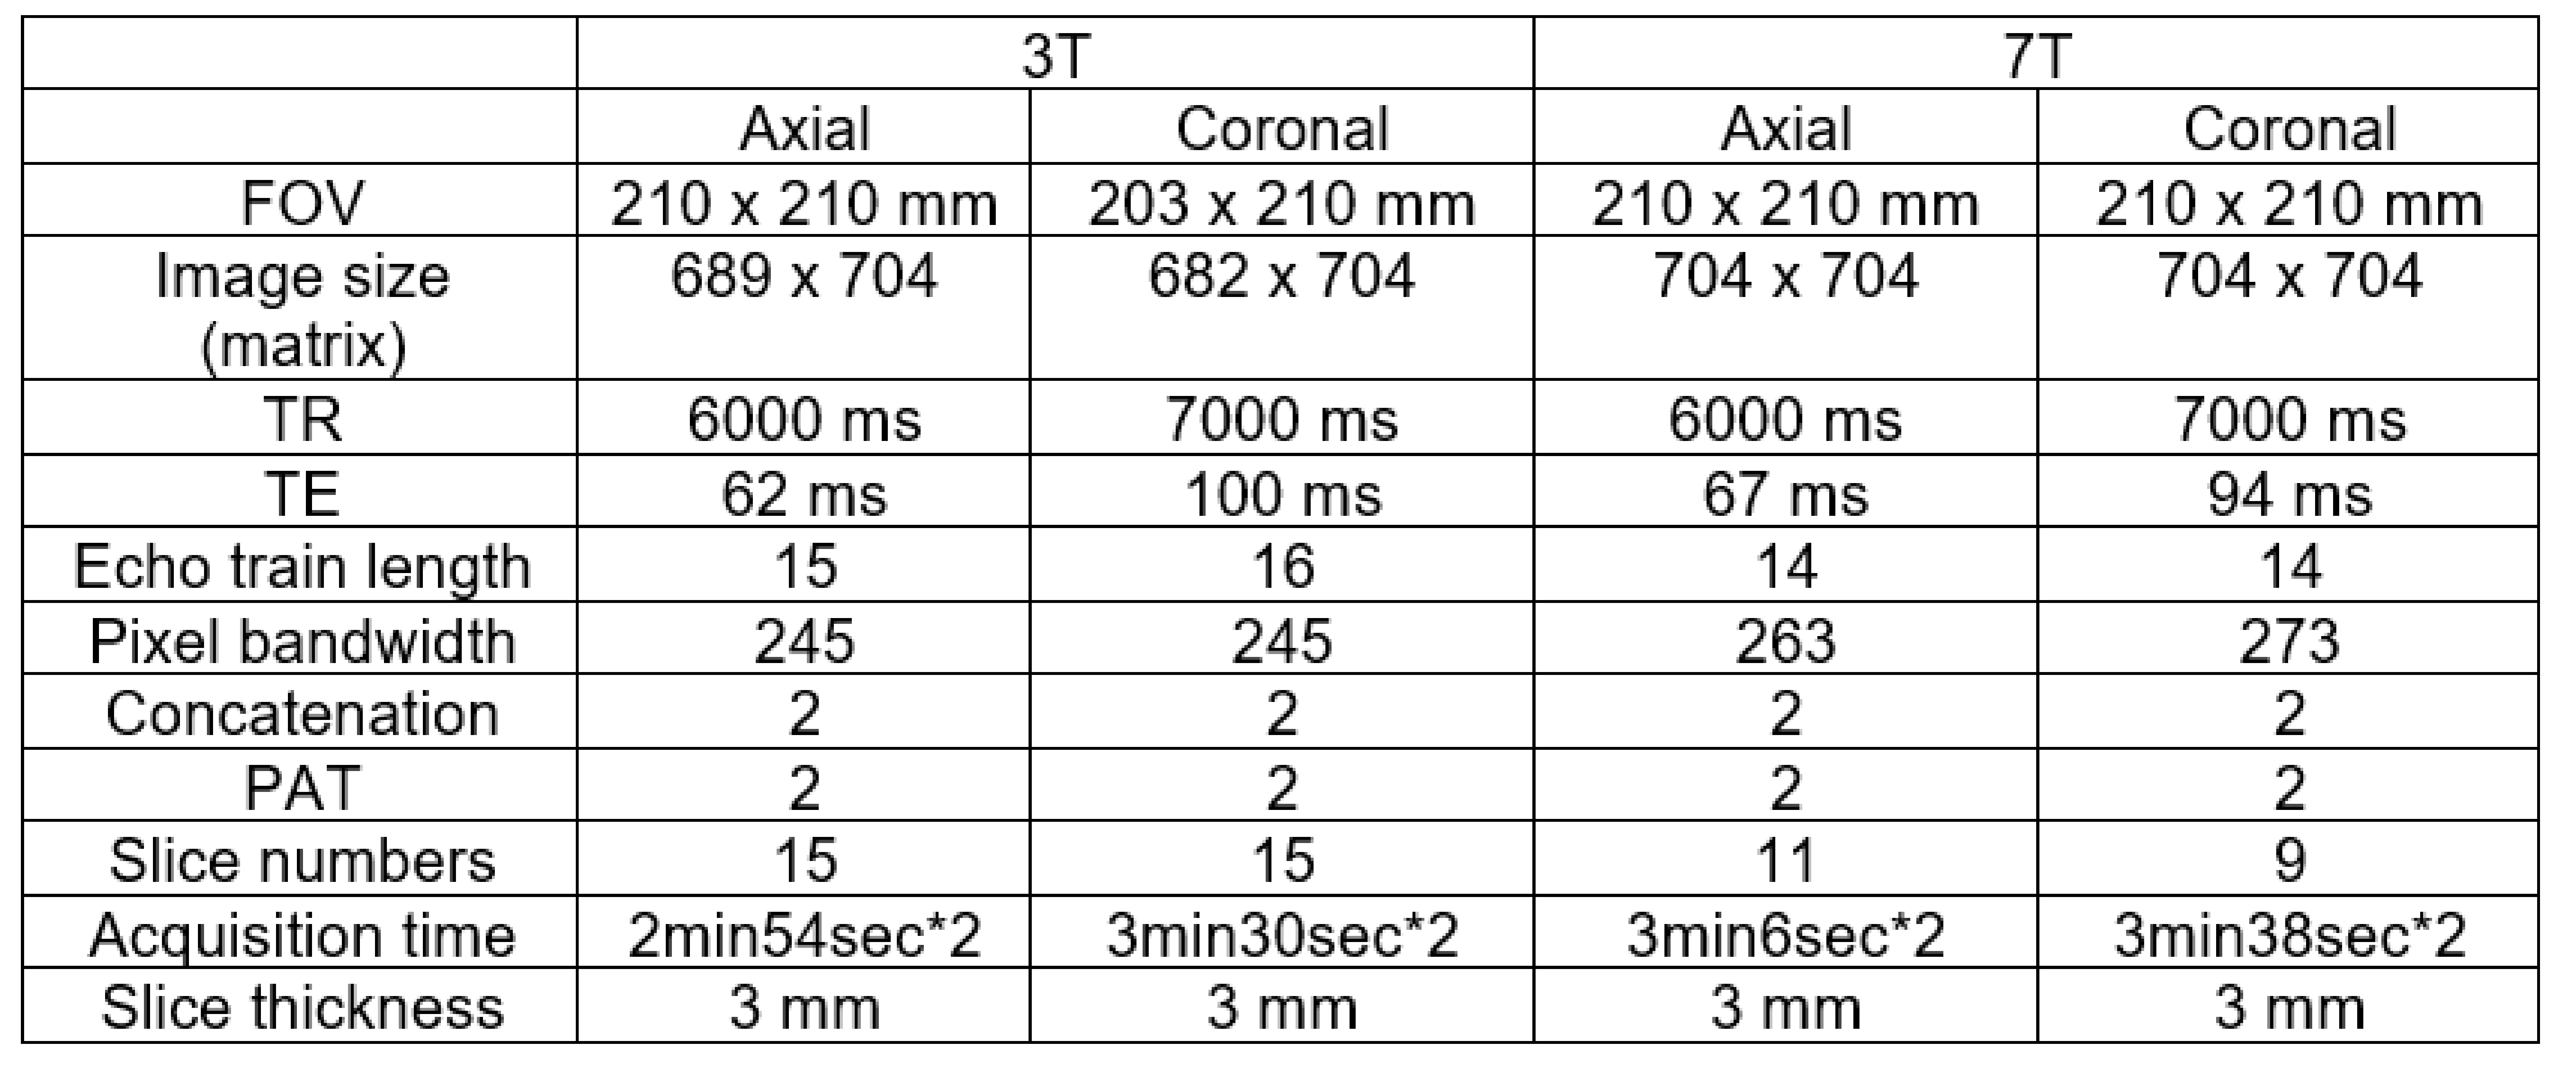
The 7T prostate images were acquired on a 7T research system Magnetom (Siemens Healthcare, Erlangen, Germany) with an 8-element prototype radiofrequency parallel transmission (pTx) coil, which is a modified version of the previous work 6. The 3T prostate images were acquired from a 3T Magnetom Prisma fit (Siemens Healthcare, Erlangen, Germany) using an 18-channel receive-only body coil (anterior) and 32-channel receive-only spine coil (posterior). Both scanners are located at the Centre for Advanced Imaging, The University of Queensland. All prostate images were acquired from the same healthy, 29-year-old volunteer. Axial and coronal images were collected with an in-plane resolution of 0.3 x 0.3mm (non-interpolated) and a slice thickness of 3mm. Sequence parameters are listed in Table I. A configuration of the coil and patient setup for 7T in the transverse plan is shown in Figure 1. Four coil elements of the prototype coil array were positioned over the anterior and posterior surfaces of the pelvis. A custom designed phase-only B1 shimming code was implemented to improve the B1 uniformity and amplitude in the prostate region 7, and included constraints based on virtual observation points 8 to limit the 10g-averaged specific absorption rate (SAR10g) 9. The B1 maps were acquired with a system provided turbo-FLASH sequence 10. Participant informed consent form was obtained and all protocols were approved by the institutional review board.RESULTS
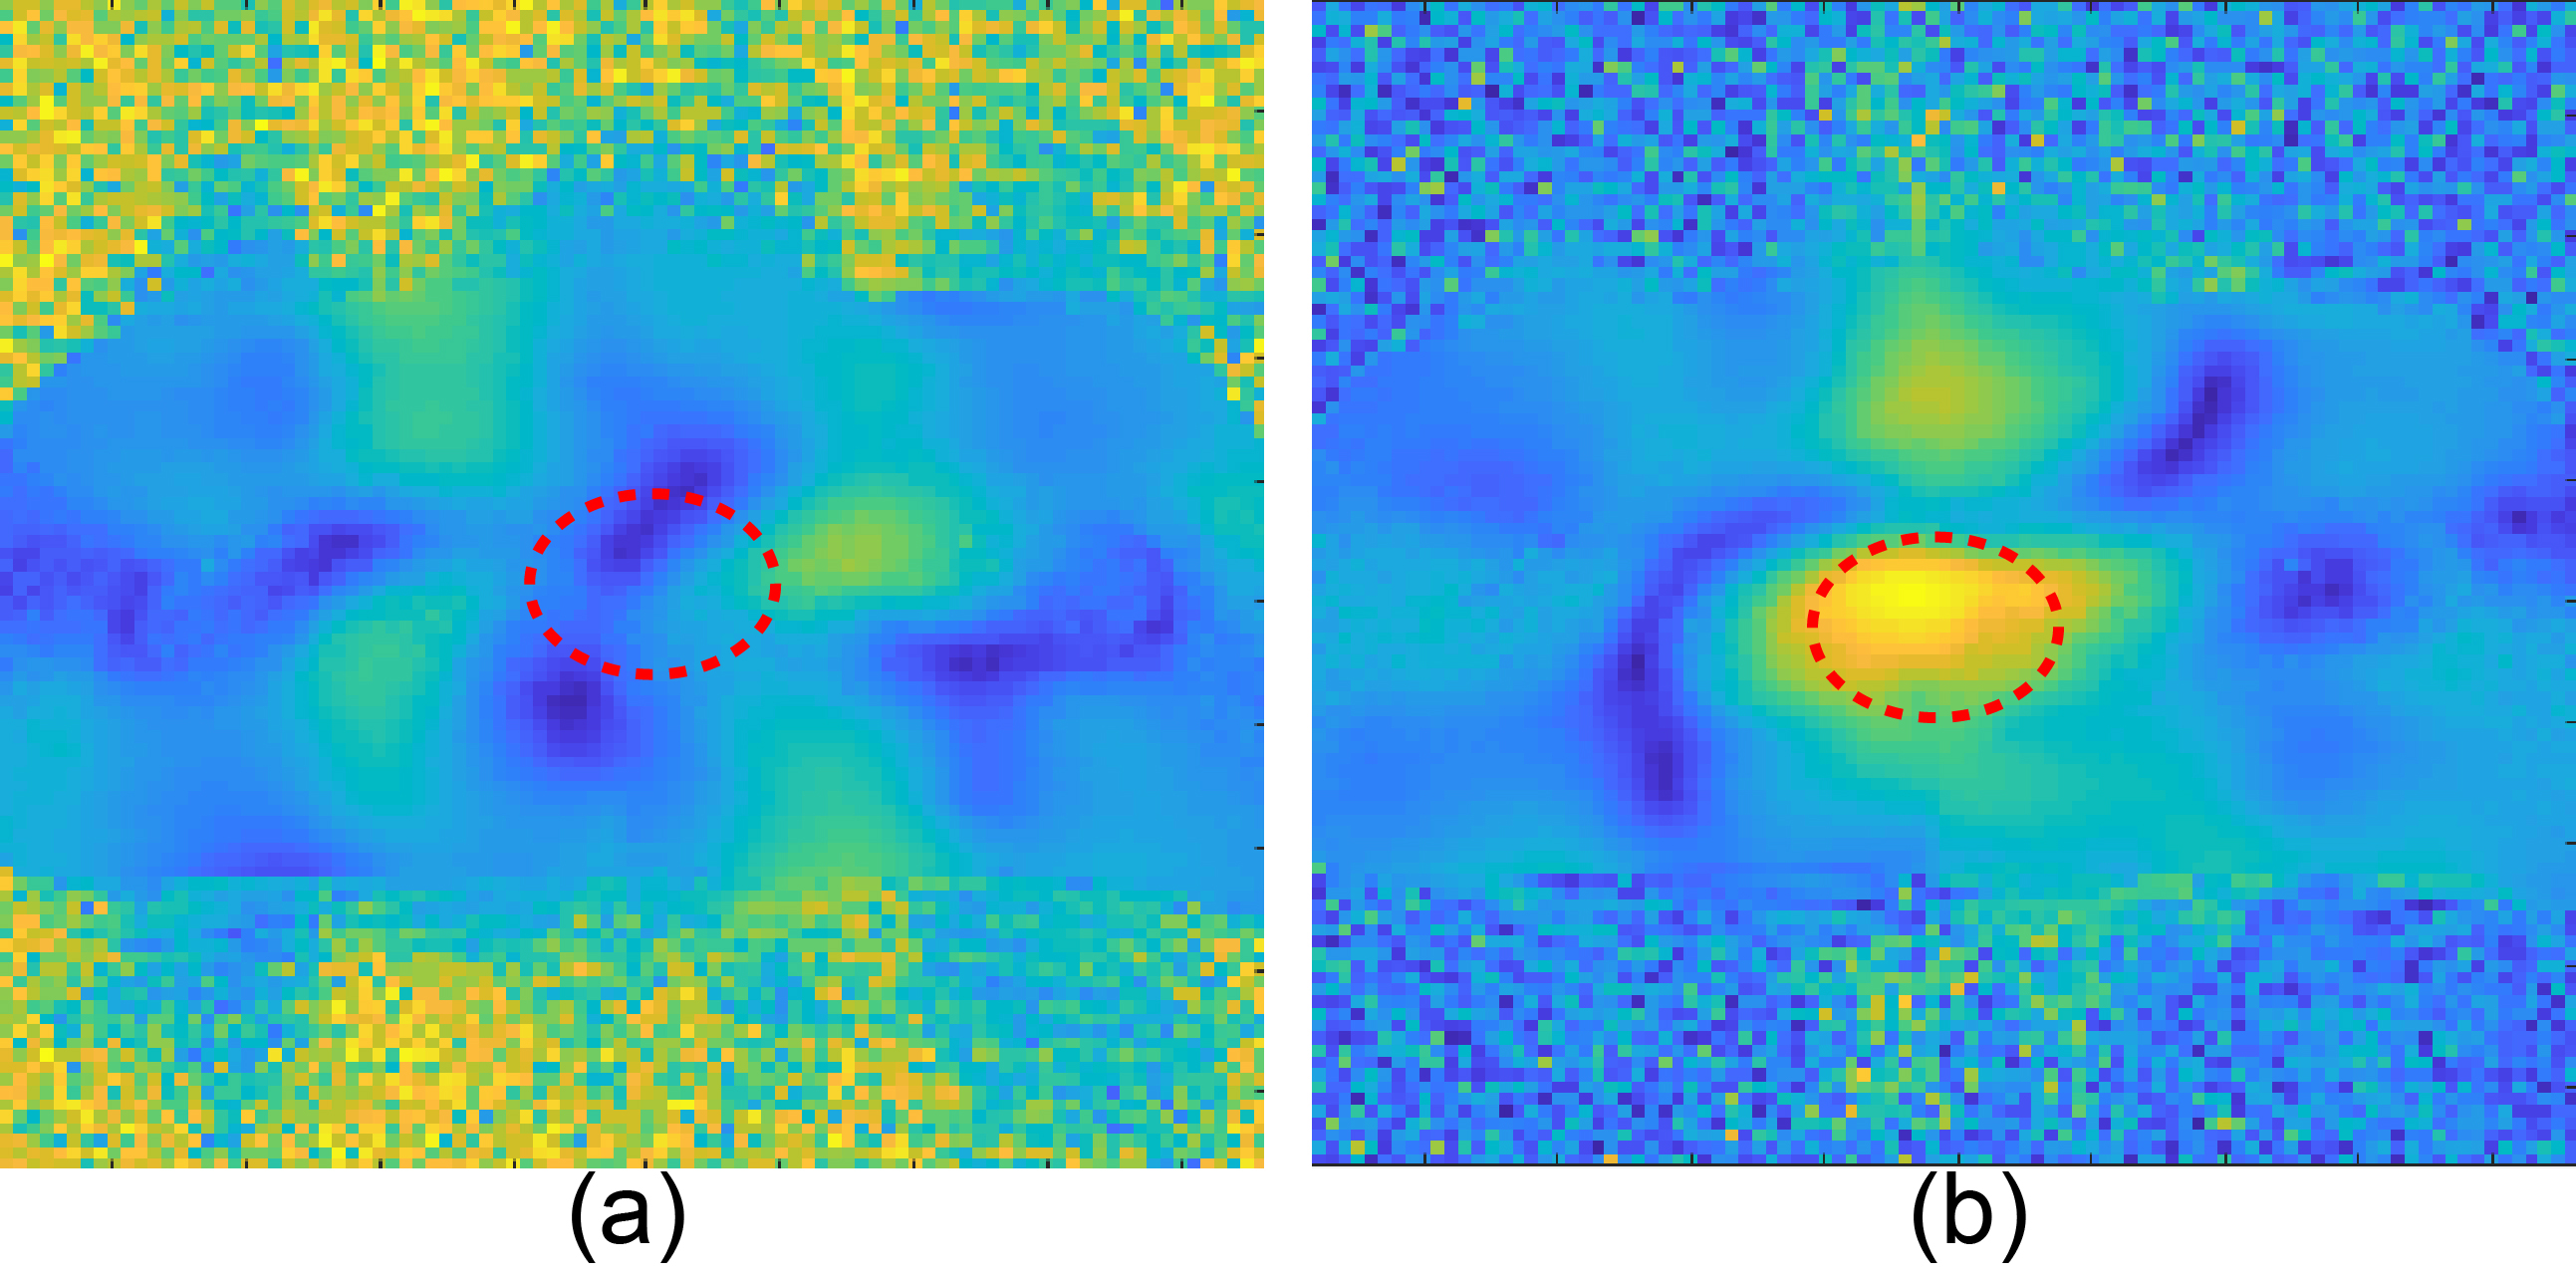
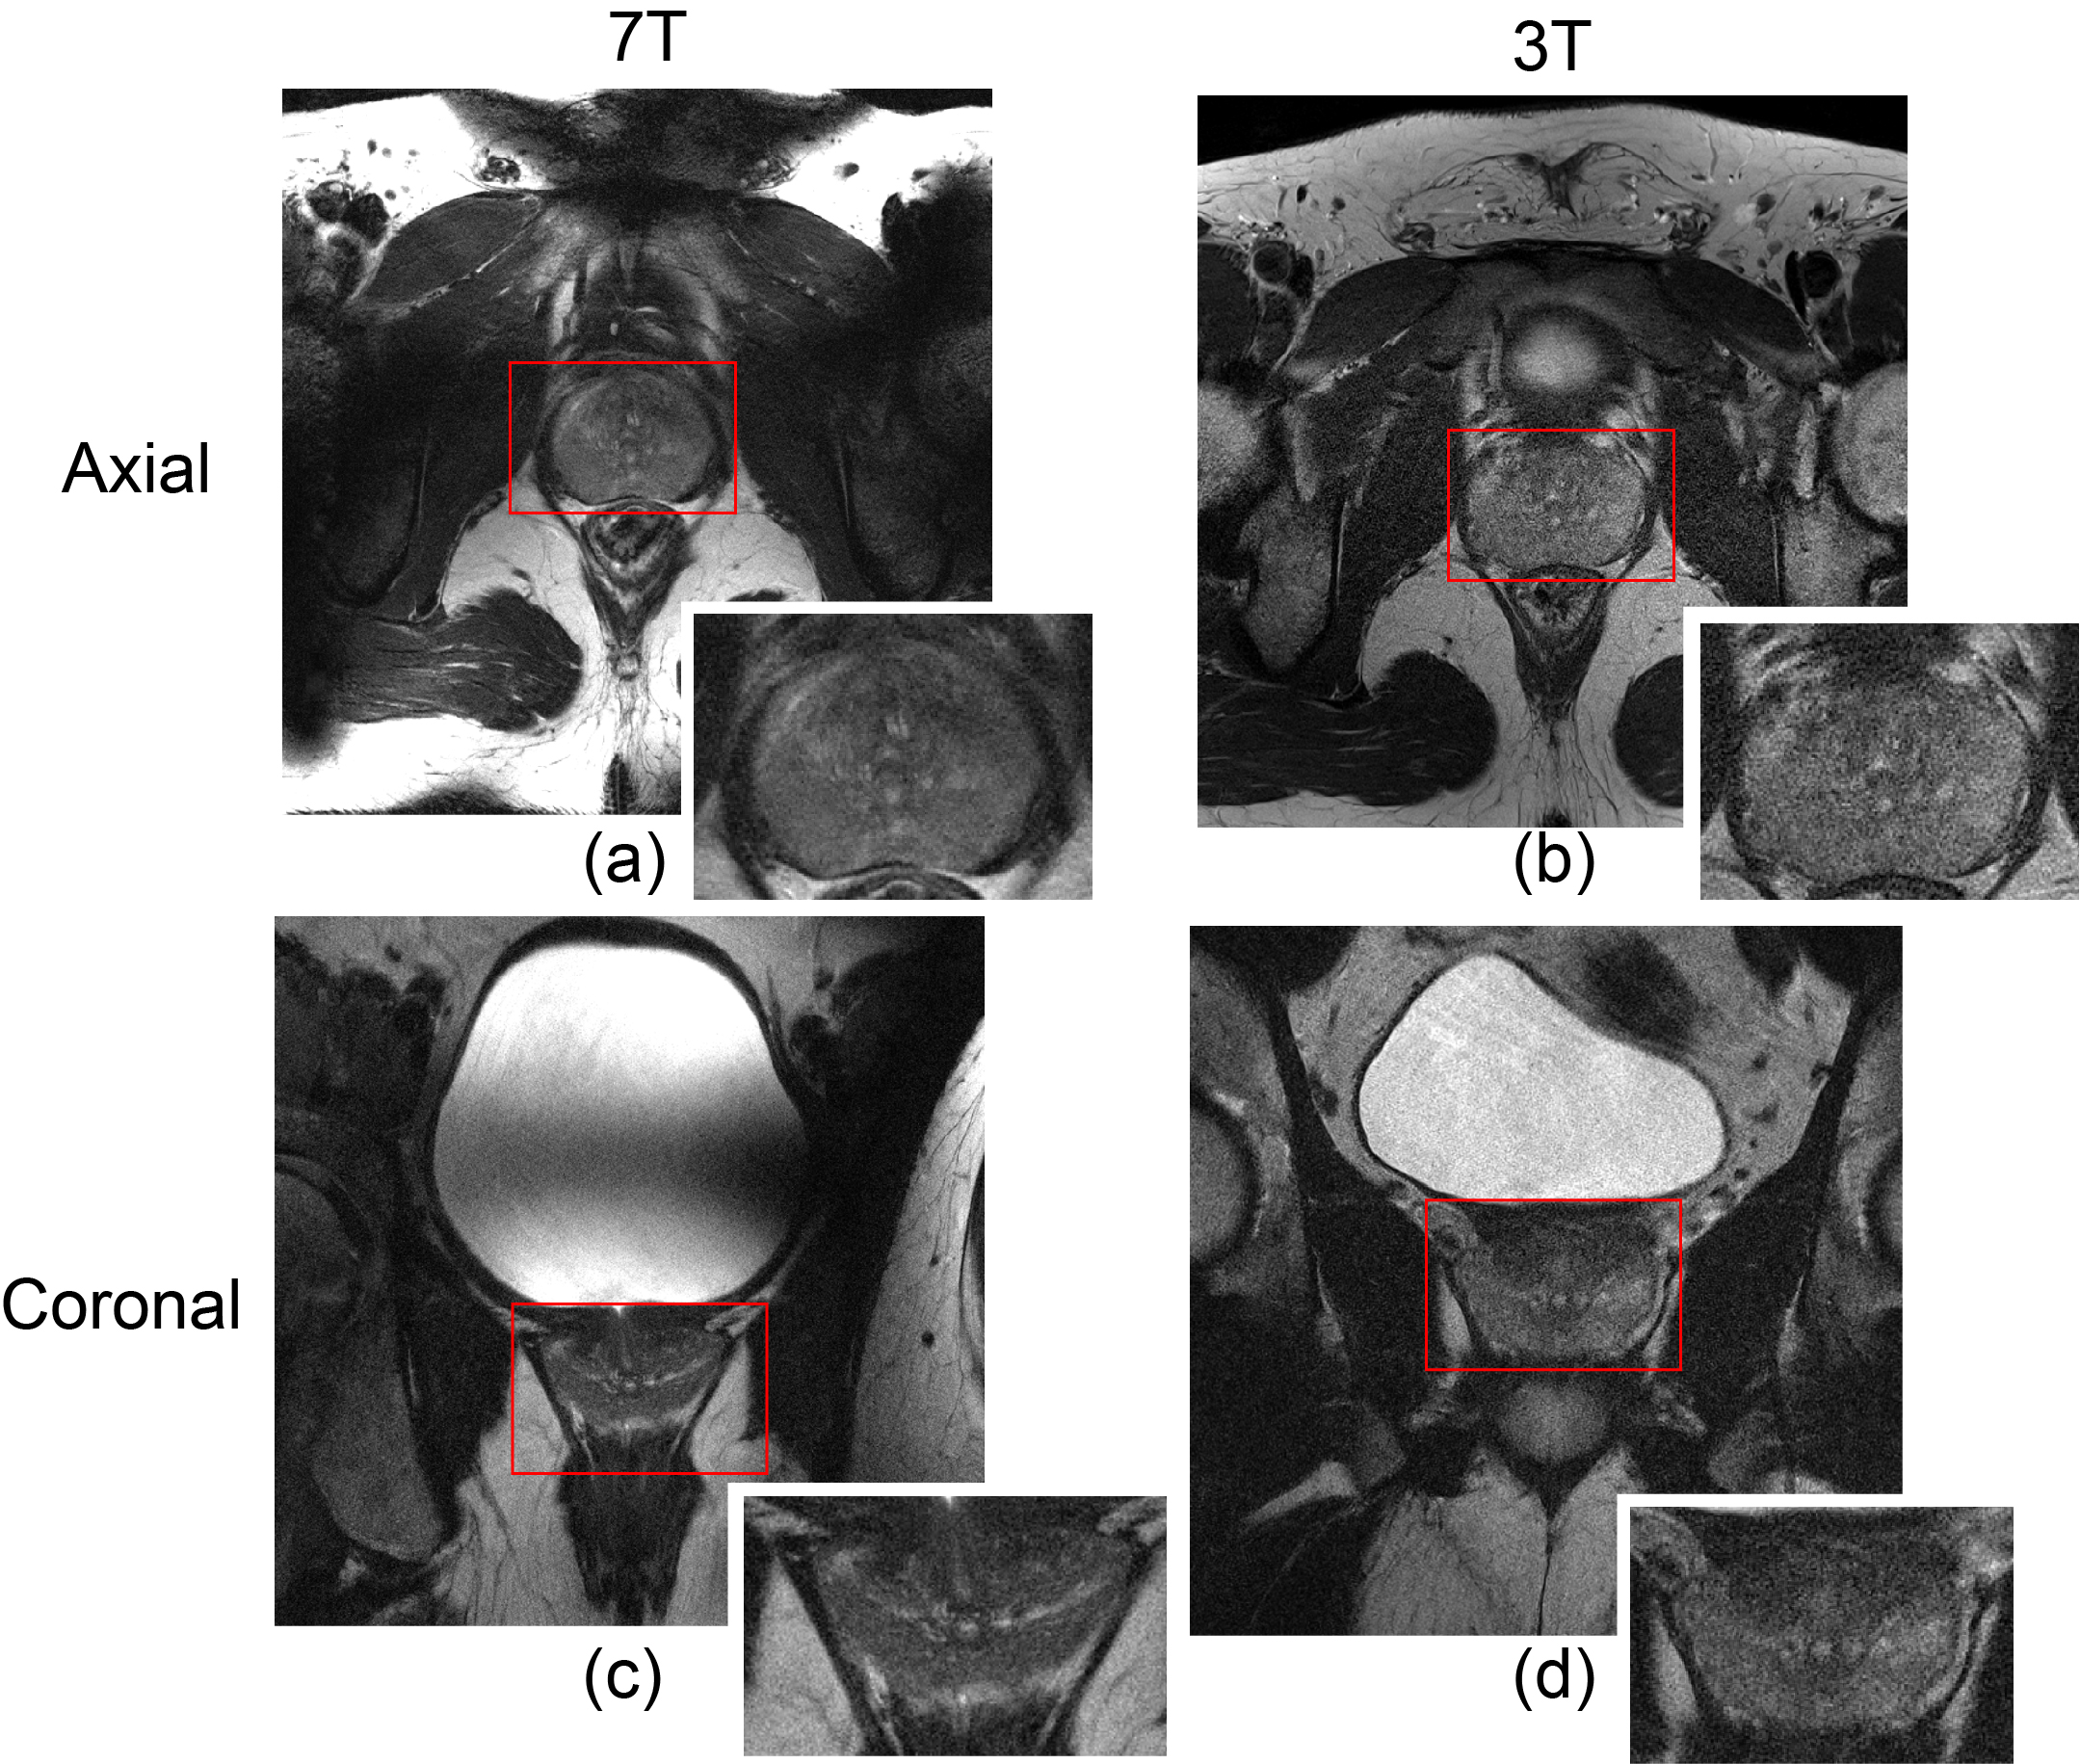
As shown in the Figure 2 (a) for the 7T setup, the default all zero phases caused destructive interference (dark bands) over the prostate region (red ellipse). However, after applying the optimised phases calculated from the custom B1 shimming algorithm, the B1 was constructively formed at the selected prostate region (Figure 2 (b)) which provided enhanced signal. Because different transmit and receive coils were used and the pre-scan normalisation was adopted to remove the transmit sensitivity at 3T, a direct quantitative SNR comparison at 3T and 7T is very challenging. However, visual comparison in Figure 3 shows that the 7T prostate images have lower noise and clearer boundaries than those acquired at 3T for both axial and coronal planes. The peripheral zone and central gland in 7T images are better differentiated than those in 3T images, which have ambiguous and blurry boundaries. Although dark bands are seen on the urinary bladder at 7T, they are not super-imposed on the prostate as per B1 map shown in Figure 2.DISCUSSION AND CONCLUSION
It is noteworthy that although we acquired fewer slices at 7T, the maximum SAR10g was not reached, indicating the potential of acquiring more slices. In this work, high resolution non-interpolated (0.3 x 0.3mm in-plane) T2w-TSE prostate images were acquired at multiple slices for both at both 3T and 7T MRI. Compared with a standard clinical setup for prostate imaging at 3T, the 7T prostate images provided higher image quality and better differentiation of various zones of the prostate. In future work, the T2w -TSE sequence will be optimised for better contrast and DWI images will be acquired for comparison at both 3T and 7T MRI.Acknowledgements
No acknowledgement found.References
1. Robitaille P, Berliner LL. Ultra High Field Magnetic Resonance Imaging. Springer, Boston, MA; 2006.
2. Zivkovic I, de Castro CA, Webb A. Design and characterization of an eight-element passively fed meander-dipole array with improved specific absorption rate efficiency for 7 T body imaging. NMR in Biomedicine. 2019;32(8):e4106.
3. Rosenkrantz AB, Zhang B, Ben-Eliezer N, et al. T2-weighted prostate MRI at 7 Tesla using a simplified external transmit-receive coil array: correlation with radical prostatectomy findings in two prostate cancer patients. Journal of magnetic resonance imaging : JMRI. 2015;41(1):226-232.
4. Maas MC, Vos EK, Lagemaat MW, et al. Feasibility of T2 -weighted turbo spin echo imaging of the human prostate at 7 tesla. Magnetic resonance in medicine. 2014;71(5):1711-1719.
5. Steensma BR, Luttje M, Voogt IJ, et al. Comparing signal-to-noise ratio for prostate imaging at 7T and 3T. Journal of magnetic resonance imaging : JMRI. 2019;49(5):1446-1455.
6. Jin J, Weber E, O'Brien K, Destruel A, Henin B, Engstorm C, Crozier S. An 8-channel pTx transceive coil for hip imaging at 7 T. 2017; Proceedings of the 25th Annual Meeting of ISMRM, Honolulu, HI, USA.
7. Setsompop K, Wald LL, Alagappan V, et al. Parallel RF transmission with eight channels at 3 Tesla. Magnetic Resonance in Medicine. 2006;56(5):1163-1171.
8. Eichfelder G, Gebhardt M. Local Specific Absorption Rate Control for Parallel Transmission by Virtual Observation Points. Magnetic Resonance in Medicine. 2011;66(5):1468-1476.
9. International Electrotechnical Commission: Medical electrical equipment, Part 2: particular requirements for the basic safety and essential performance of magnetic resonance equipment for medical diagnosis. 2010.
10. Haase A. Snapshot Flash Mri - Applications to T1, T2, and Chemical-Shift Imaging. Magnetic Resonance in Medicine. 1990;13(1):77-89.
Figures