4288
Initial experience on 7T Terra for human parallel transmit (pTx) liver imaging1Wolfson Brain Imaging Centre, Department of Clinical Neurosciences, University of Cambridge, Cambridge, United Kingdom, 2Siemens Healthcare Ltd, Research and Collaboration UK, Frimley, United Kingdom, 3Siemens Healthcare Limited, Erlangen, Germany, 4UMC Utrecht, Utrecht, Netherlands, 5Oxford Centre for Magnetic Resonance, University of Oxford, Oxford, United Kingdom
Synopsis
Abdominal 7T MRI is technically demanding, but has great potential due to the improved signal-to-noise-ratio and altered image contrast. We describe our initial experience of abdominal imaging on a 7T Terra scanner (Siemens), using an 8-channel TEM coil that was previously used on a Magnetom 7T scanner. First, we describe how we adapted the RF power limits from the VB17 format to the VE12U format, including an experimental validation. Then, we show our first human in vivo liver images from the 7T Terra, including B0 and B1+ maps, and FLASH images (radial and Cartesian), for two RF shim settings.
Introduction
We are preparing to perform a clinical study using 7T abdominal MRI [1,2,3] and MRS to monitor the response to chemotherapy in patients with liver metastases. This is part of the EU FET-OPEN project: “Non-invasive chemistry imaging” (NICI). In Cambridge, we will scan using our recently-installed 7T Terra scanner (Siemens). This abstract describes our work to take a 7T cardiac TEM coil previously used on the Magnetom 7T system in Oxford (VB17, Step 2.3 software) and prepare it for use on the 7T Terra in Cambridge (VE12U software). This is the first custom pTx-capable coil that we have set up on the Terra. We believe our experience may help others who are setting up custom coils for 7T Terra systems. We also show our first abdominal 7T images.Material and Methods
All experiments were performed on a 7T Terra whole-body MR system with an 8-channel parallel transmit TEM array coil [4]. We adapted the coil file from the VB17 format (with known safe per-channel power limits) for use in VE12. To assure correct understanding, we developed a set of Matlab code to dynamically plot values from the RFSWDHistoryListNew.log file while we changed parameters in the VE12U coil files and VOP supervision [6] files one at a time. We are happy to share this tool on request to other sites, subject to the usual legal formalities. We ran FID pulse sequences with either excitation in TrueForm mode, or excitation as a full pTx pulse sequence that happened to output the exact same RF waveform as the scan in TrueForm mode, and a pTx sequence in CP- RF shim, and a pTx sequence exciting a single channel. In each case, we adjusted the voltage and duty cycle to determine the point where the scanner lookahead and online SAR supervision cut off. Having selected our coilfile parameters, we performed a heating test using pork loin and Luxtron 3100 fibre-optic temperature probes.We then recruited a healthy volunteer in accordance with ethical regulations. We scanned the volunteer in a transverse slice covering the liver to compare performance in these modes. B1+ maps were acquired using a turbo-FLASH B1-mapping pulse sequence (‘tfl_map’). Images were acquired in “TrueForm” mode, i.e. with a fixed CP+ RF shim setting, and with “Patient Specific” RF shimming manually set to a fixed CP++ RF shim. FLASH images were acquired with a radial trajectory over a 350 x 350 x 8 mm3 slice and reconstructed to 0.9 x 0.9 x 8 mm3 resolution. TR and TE were 1105 and 3 ms respectively and an excitation input voltage of 143.9 V. FLASH images were also acquired with a Cartesian trajectory over the same slice, with 1.8 x 1.8 x 8 mm3 resolution. TR was 1000 ms, TE 10 ms with an excitation voltage of 179.9 V. Both radial and Cartesian acquisitions were then repeated with static pTx in a fixed CP++ RF shim, with 1000 ms TR and TE of 10 ms.
Results
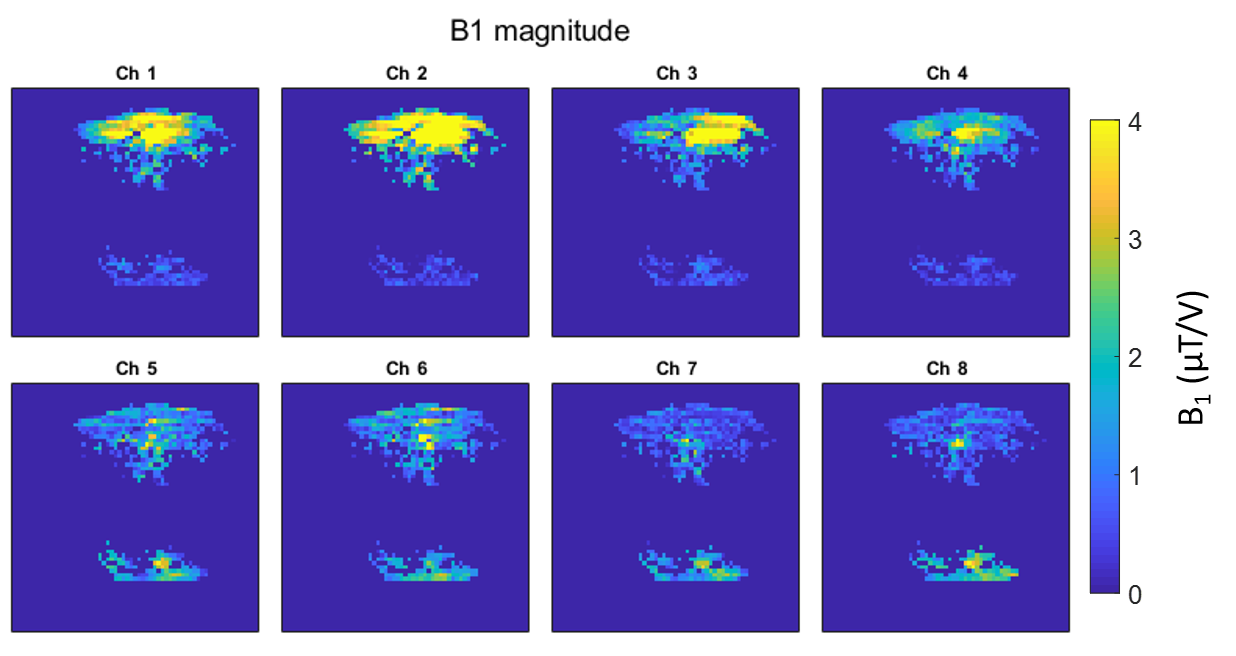
On the Terra, SAR limits are enforced by a combination of a coil file and a VOP file [5], over 6 min (LT), 10 s and 1 s averaging intervals. Table 1 shows an overview of the differences between VB17 Step 2.3 and VE12U configuration, together with the various configurations that we tested in phantom scans. Figure 1A shows the effect of the “k-factor”, or ratio of power on the patient protection VOP and power on the coil protection VOP. The impact of adjusting the k-factor was tested in both TrueForm/CP+ and Patient Specific shim/pTx modes. Our “default” patient protection VOPs (“”) were an 8x8x8 array, all set to zero, except the k,k,kth elements were 0.65x8/50. This means that gives a hypothetical total power if all 8 channels deposited the same as the channel with maximum power deposition.Figure 2 shows the relative B1+ maps plotted for each single channel in the volunteer.
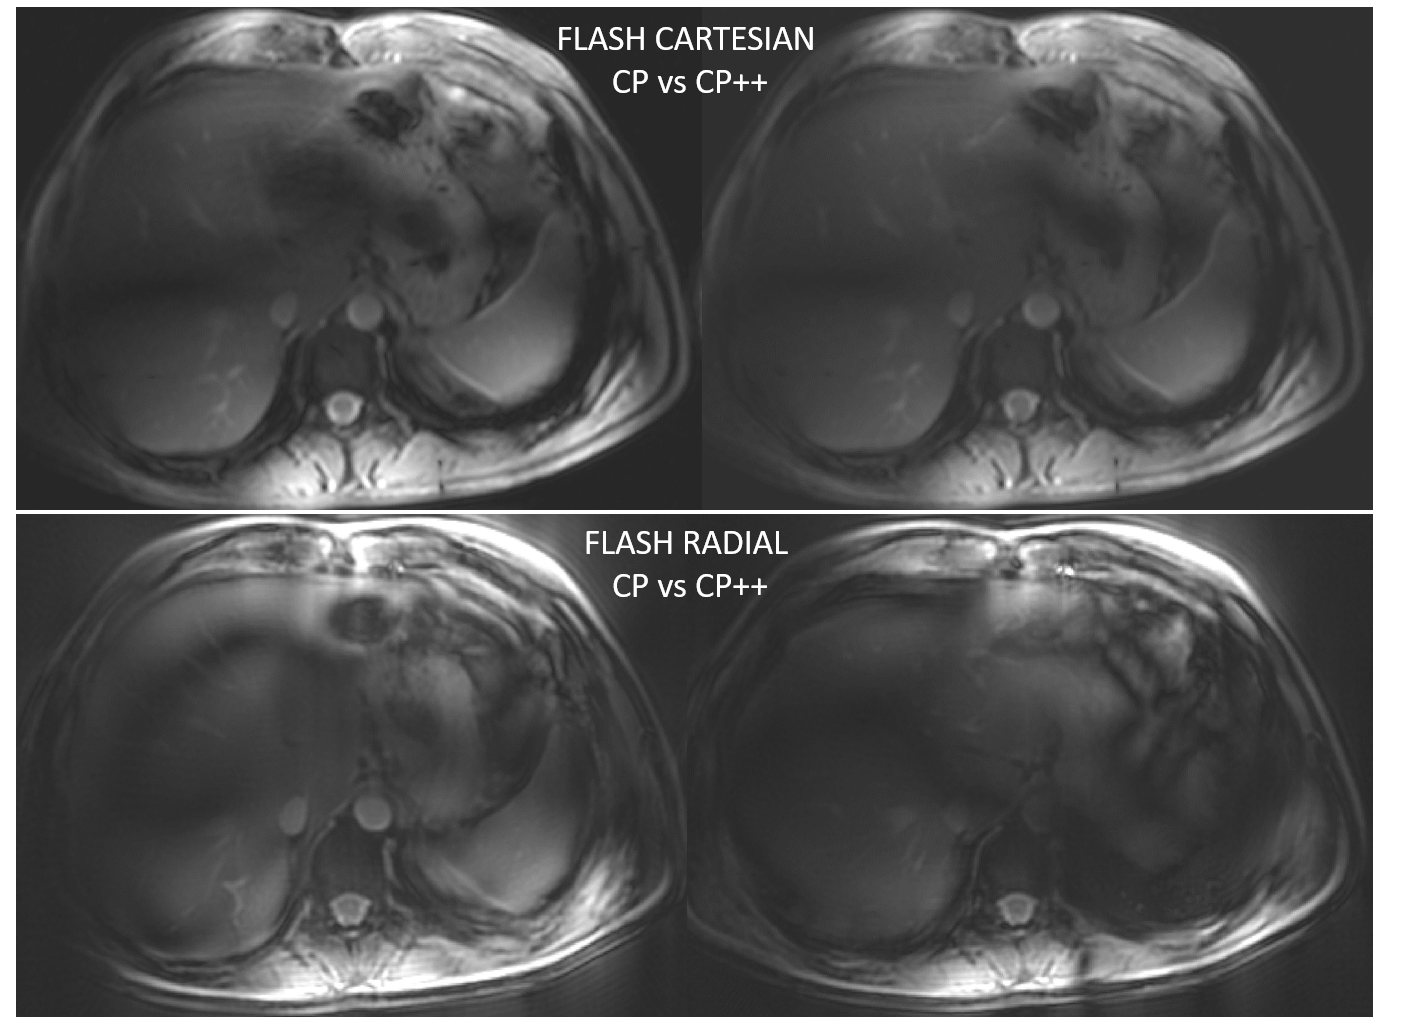
Figure 3 shows the human in vivo results. Notice how the pattern of B1+ dropouts (black lines) shifts in CP+ vs CP++ RF shim setting, confirming a successful static pTx implementation.
Discussion and Conclusion
Our results demonstrate the feasibility for abdominal imaging at the 7T Terra using an 8-channel TEM coil built for cardiac imaging on the Magnetom 7T platform. We investigated how to translate coil RF safety limits from a Magnetom 7T system to the Terra system. Coil file L clearly indicates the limits where the scanner is able to successfully shutdown a scan. We report that we scanned a healthy volunteer using a matched protocol in a single slice across the liver to compare the in vivo performance of two modes. To our knowledge, these are the first liver pTx images presented from a 7T Terra scanner. We are now working to build a robust, optimised protocol ready for the NICI patient study.Acknowledgements
*:SS and BD contributed equally to this work. This project has received funding from the European Union’s Horizon 2020 research and innovation programme under grant agreement No 801075. BD is funded by Gates Cambridge Trust. CTR is funded by a Sir Henry Dale Fellowship from the Wellcome Trust and the Royal Society [098436/Z/12/B]. This study was funded by the NIHR Cambridge Biomedical Research Centre and MRC Clinical Research Infrastructure Award for 7T. We are grateful for support to understand the VOP SAR supervision from Rene Gumbrecht, Siemens Healthcare.References
[1] X. Wu, S. Schmitter, E. J. Auerbach, U. Kâmil, and P. Van De Moortele, “Mitigating transmit B 1 inhomogeneity in the liver at 7T using multi- spoke parallel transmit RF pulse design,” vol. 4, no. 18, pp. 4–10, 2014.
[2] M. A. Erturk, X. Li, P. Van De Moortele, K. Ugurbil, and G. J. Metzger, “Evolution of UHF Body Imaging in the Human Torso at 7T,” vol. 28, no. 3, pp. 101–124, 2019.
[3] A. Laader et al., “1 . 5 versus 3 versus 7 Tesla in abdominal MRI : A comparative study,” pp. 1–18, 2017.
[4] G. A. Keith, C. T. Rodgers, A. T. Hess, C. J. Snyder, J. T. Vaughan, and M. D. Robson, “Automated tuning of an eight-channel cardiac transceive array at 7 Tesla using piezoelectric actuators,” Magn. Reson. Med., vol. 73, no. 6, pp. 2390–2397, 2015.
[5] G. Eichfelder and M. Gebhardt, “Local Specific Absorption Rate Control for Parallel Transmission by Virtual Observation Points,” vol. 1476, pp. 1468–1476, 2011.
[6] R. Gumbrecht, “Development of customized pTx MR excitation methods and their safe application,” Fak. Der Naturwissenschaftlichen.
Figures