4282
Design and comparison of the RF systems for frequency encoding by nonlinear Bloch-Siegert shift at low field MRI1Department of Radiology and Biomedical Imaging, Yale School of Medicine, New Haven, CT, United States
Synopsis
To achieve frequency encoding using Bloch-Siegert shift, the off-resonance pulse and signal reception would need to take place simultaneously. In this work we describe two methods to get rid of applied off-resonance signal from the receive signal. Both Tx cancelling and RF filter methods can be integrated into the RF chain to reduce the power of the off-resonance signal. It was found that using an RF filter was more effective for both blocking off-resonance signal and keeping receive signal. It was also demonstrated that the combination of two methods is promising in terms of reducing the off-resonance signal.
Purpose
While the Bloch-Siegert (BS) shift effect has mainly been exploited for phase encoding1, it is possible to use it for spatial frequency encoding2. However, for frequency encoding, the off-resonance pulse and signal reception need to take place simultaneously. In this work, two different hardware systems were designed and compared to see which system better reduced the amount of coupled BS (off-resonance) signal while maximally preserving the receive (Rx) signal.Methods
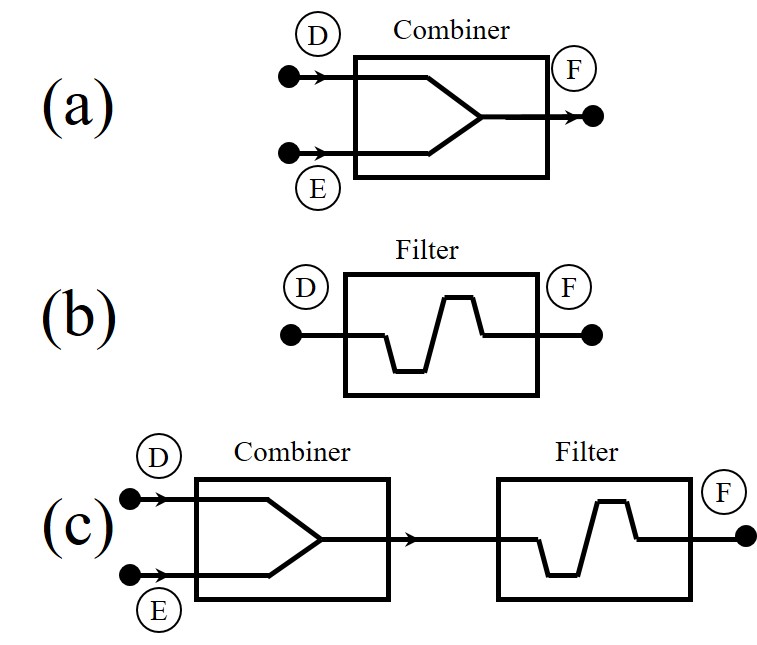
In one system, the coupled off-resonance signal was cancelled by adding a signal with the same frequency and amplitude, but 180° out-of-phase3. The other system used an RF filter to remove the coupled BS signal4. Figure 1 shows the diagram of the RF system for frequency encoding using the BS shift. Three square loop coils (14mm x 14mm) were built using copper wire. The Tx and Rx coil were tuned to 1 MHz, and the BS coil was tuned to 870 kHz for an open MRI system5. If the receive coil (Figure 1,D) directly connects to the oscilloscope(Figure 1,F), coupled BS signal as well as the Rx signal is detected. The experimental set up for the different circuits tested are shown in Fig. 2. The Tx cancelation method was performed using a combiner (Fig. 2 (b)). BS signal from the RF power amplifier was applied to the BS coil via a phase shifter, and inductively coupled to the Rx coil. A signal was sampled from the transmission line and adjusted to have the same amplitude as the coupled signal and to be 180 out-of-phase. The inductively coupled signal was cancelled by combining it with the sampled signal. Fig. 3 (b) shows schematic diagram of the dual-band pass filter (Fig. 2 (b)) with three different resonance frequencies ω1, ω2, and ω3 (ω1<ω2<ω3)6. The impedance of the filter is highest at ω2, and has a local minimum at ω1 and ω3. The resonance frequencies are given as$$\omega_1=\sqrt{\frac{A-\sqrt{A^2-4L_3L_4(C_7C_8+C_7C_9+C_8C_9)}}{2L_3L_4(C_7C_8+C_7C_9+C_8C_9)}},$$
$$\omega_2=\sqrt{\frac{C_8+C_9}{L_3(C_7C_8+C_7C_9+C_8C_9)}},$$
$$\omega_3=\sqrt{\frac{A+\sqrt{A^2-4L_3L_4(C_7C_8+C_7C_9+C_8C_9)}}{2L_3L_4(C_7C_8+C_7C_9+C_8C_9)}},$$
where,
$$A=L_3(C_7+C_8)+L_4(C_8+C_9).$$
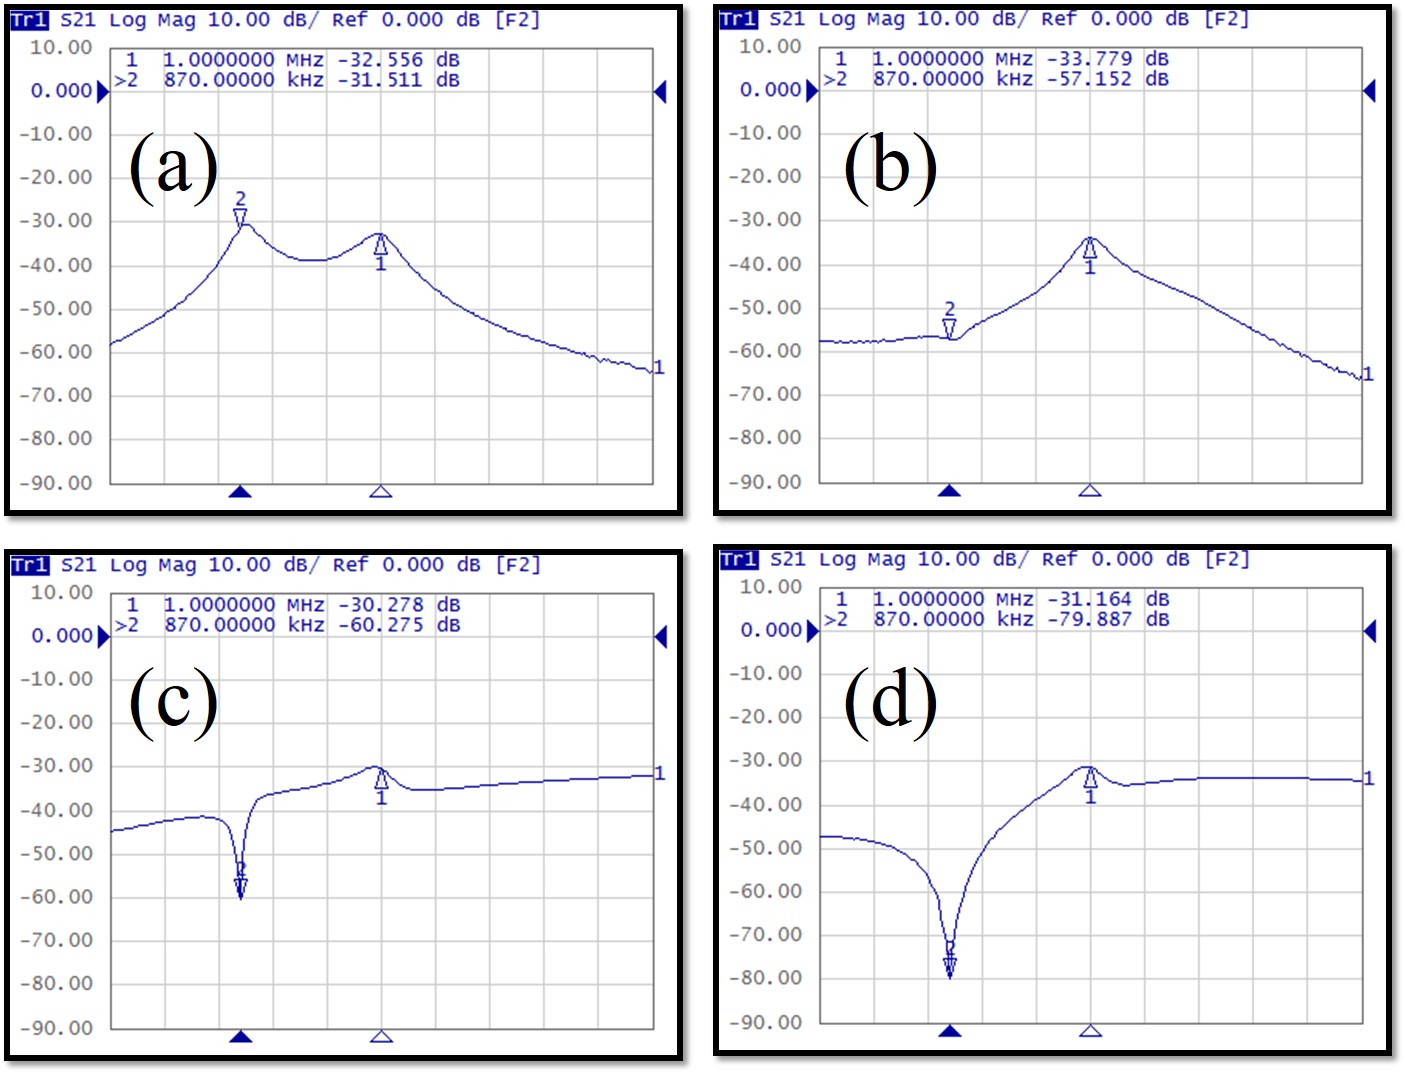
This filter was tuned to reject 870 kHz signal by tuning ω2, but to pass 1 MHz signal with small loss by tuning it to ω3. The insertion loss of the filter was 25.6 and 1.2 dB at 870 kHz and 1 MHz, respectively. The log magnitude of the SAF was measured for different conditions as shown in Fig. 2 (a)-(c), using a vector network analyser. To characterize the effect of the Tx cancelling and the filter, waveforms were also measured using an oscilloscope with different conditions. To measure waveforms two separate channels from the RF power amplifier were connected to the Tx coil and BS coil, as shown in Fig. 1. Both RF power amplifiers channels were controlled by a spectrometer. The experiment was repeated with 250 mW/1MHz signal and 250 mW/870 kHz signal to verify the effect on 1 MHz Rx signal. The resulting waveforms were then compared to the reference signal which was acquired with 250 mW/1 MHz signal from power amplifier 1 without applying 870 kHz signal.
Result
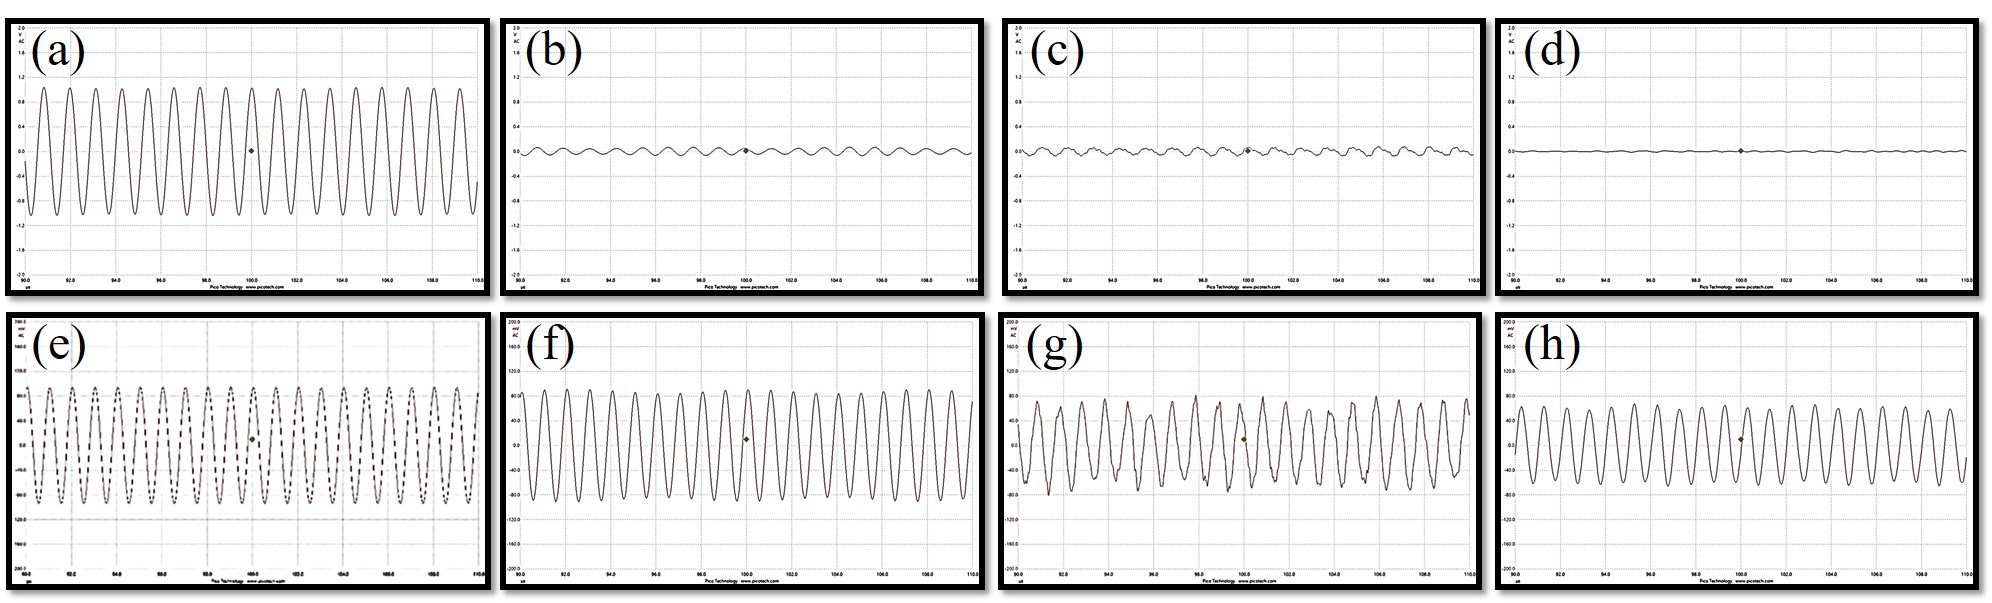
As shown in Fig. 4, the insertion loss at 870 kHz was increased by using filter, Tx cancelling, and a combination of Tx cancelation and filter methods; 57.1, 60.3, and 79.9 dB, respectively. Fig. 5 shows the wave form measured from Rx coil with different conditions. The peak-to-peak voltage of off-resonance signal was 2.2 V without any filter and Tx cancelling, and it was compressed to 265.1 mV, 401.3 mV, and 148.8 mV with filter, Tx cancelling, and the combination of the Tx cancelling and a filter, respectively. The peak-to-peak voltage of coupled Rx signal was 189.8 mV, 182.5, 165.4, and 141.4 with direct connection between Rx coil and oscilloscope, for the filter, Tx cancelling, a filter added after Tx cancelling, respectively.Discussion
This study was aimed at designing and testing techniques to eliminate off-resonance frequencies from Rx signal for frequency encoding using the BS shift. The off-resonance signal was compressed by using the Tx cancelling method. However, this method affects the 1 MHz Rx signal in terms of the amplitude and waveform as shown in Fig. 5 (g). A modified dual-band pass filter was also designed to have a high impedance at the off-resonance frequency and low impedance at the frequency of Rx signal. This filter was able to remove the off-resonance signal with little effect on the frequency of Rx signal. We demonstrated that the combination of two methods is promising in terms of reducing the off-resonance signal.Conclusions
Both Tx cancelling and RF filter methods can be integrated into the RF chain to reduce the power of the off-resonance signal. It was found that the method of using an RF filter was more effective for both blocking the off-resonance signal, and retaining the receive signal. However, it can be helpful to use a combination of a dual-band pass filter with a Tx-cancelling technique when applying a very high power off-resonance signal.Acknowledgements
No acknowledgement found.References
1. R. Kartäusch, T. Driessel, T. Kampf, T. C. Basse-Lüsebrink, and U. C. Hoelscher, “Spatial phase encoding exploiting the Bloch-Siegert shift effect,” Magn. Reson. Mat. Phys. Biol. Med., vol. 27, no. 5, pp. 363-371, Oct. 2014.
2. Z. Cao, E. Y. Chekmeney, and W. A. Grissom, “Frequency encoding by Bloch-Siegert shift,” in Proc. 22nd Annu. Meet. Int. Soc. Magn. Res. Med., Milano, Italy, May 10-16, 2014.
3. S.-M. Sohn, J. T. Vaughan, R. L. Lagore, M Garwood, and D. Idiyatullin, “In vivo MR imaging with simultaneous RF transmission and reception,” Magn, Reson. Med., vol 76, no. 6, pp. 1932-1938, Sep. 2016.
4. B. Wu, Y. Ha, C. Rogers III, K. Selvaganesan, G. Galiana, and R. T. constable, "RF encoding using a simultaneous transmit and receive system," in Proc. 60th ENC, CA, USA, April 7-12, 2019.
5. R. T. Constable, C. Rogers III, B. Wu, K. Selvaganesan, and G. Galiana, "Design of a novel class of open MRI devices with nonuniform B0, field cycling, and RF spatial encoding," in Proc. 27th Annu. Meet. Int. Soc. Magn. Res. Med., Montreal, Canada, May 10-13, 2019.
6. S. Tadanki, R. D. Colon, J. Moore, and K. W. Waddell, “Double tuning a single input probe for heteronuclear NMR spectroscopy at low field,” J. Magn. Reson., vol. 223, pp. 64-67, Oct. 2012.
Figures