4278
A Quantitative Analysis on Patient-induced B0 Field Inhomogeneity at 1.5T MRI System1GE Healthcare, Beijing, China
Synopsis
This abstract investigated the method for quantitatively predicting B0 variation induced by human body. Magnetic field simulation was performed, with human phantom positioned in different strength’s B0 fields, and revealed the linear relationship between patient-induced B0 inhomogeneity and the background B0 field. The linear relationship was proved in clinical experiment, which used the relationship to predict B0 field map and compared the predicted B0 field map with the real B0 field map. The clinical experiment shows that 95% voxels has a prediction accuracy within 50Hz. The finding could further benefit image quality and improve scan workflow.
Introduction
Patient induces B0 inhomogeneous in MRI scanning is well-observed; however, there is a lack of knowledge in quantitative prediction of the B0 variation induced by human body. The human body has an overall magnetic susceptibility close to air that causes subtle variation in B0, while susceptibility that varied among different tissues can lead to complicate B0 variation in space. In this study, we revealed a linearity relationship between patient-induced B0 inhomogeneity and the background B0 field; and provided a method to predict B0 field in clinical scan.Methods
Magnetic field simulation was performed on SIM4LIFE software to reveal the linearity relationship between patient-induced B0 inhomogeneity and the background B0 field. Clinical experiment was conducted to prove the relationship in clinical setting.Simulation - The magnetic field simulations were performed using SIM4LIFE software. A close-loop solenoid coil model, provided by the software, was used to simulate magnetic fields of various strength by injecting different amplitude’s current into the coil. A computable human phantom (Duke_34y_m_v3.1b02_posable) provided by the software was placed at the center of the solenoid coil, simulating the setting of MRI scan. The magnetic susceptibility values of different tissues were assigned to the computable human phantom.1,2 The magnetic field maps with and without human phantom loaded were simulated, using the EM LF Magneto Static Vector Pot. solver, at 8 different magnetic field strengths (1.05T, 1.25T, 1.4T, 1.5T, 1.6T, 1.7T, 1.9T and 2.1T). The field maps without human phantom loaded were used as the background B0 field, and the differences between the field maps with and without human phantom loaded were used as the B0 field variation induced by human. For each voxel on human phantom, the data was used to further analyze the relationship between the background B0 field and B0 field variation.
Clinical experiment - Two volunteers were scanned on a 1.5 Tesla MRI system (GE Signa Voyager) with the use of body coil for clinical indication of quantitatively predicting patient-induced B0 variation. A large phantom filled with uniformed CuSO4 solution was scanned to obtain background B0 field. Each volunteer was scanned twice at different positions (position1 and position2) along z direction to obtain B0 field maps with human-induced inhomogeneity. We used the volunteer scan data at position1 to predict the B0 field map, assuming the volunteer was at position2. The predicted B0 field map was compared with the actual volunteer scan B0 field map at position2.
Results
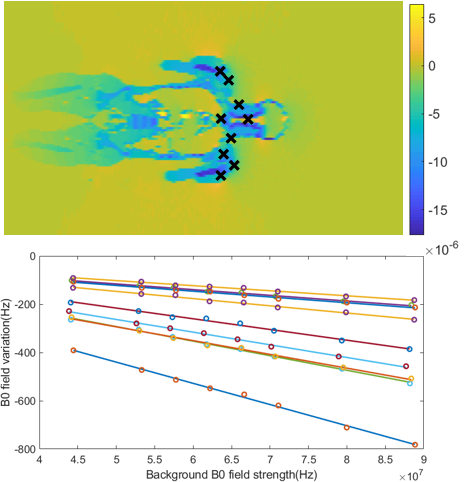
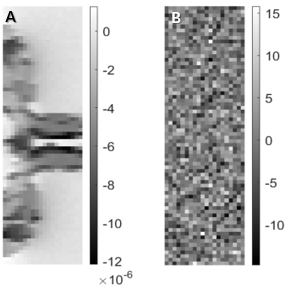
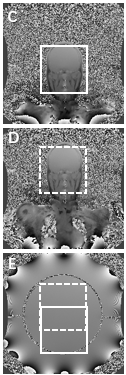
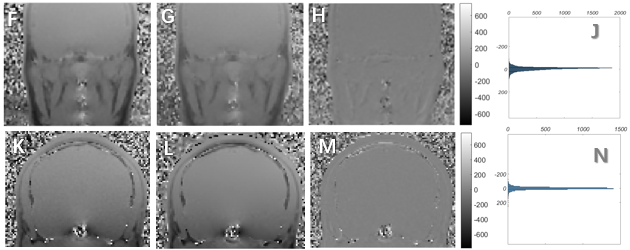
Simulation - Figure 1 shows the simulation results by randomly selecting 9 human phantom voxels and plotting B0 field variations of those voxels under different background B0 fields in the selected ROI with homogeneity B0 field. A linear relationship was observed and proved by polynomial fitting with 95% confidence bounds and all the R-square values of the fitting lines were more than 0.99. Figure 2 shows the fitted k and b value of each voxel in a selected ROI.Clinical experiment - Figure 3 shows the B0 field maps acquired in clinical experiment. The data analysis was conducted in the ROI showed as white boxes. The position1 B0 field variation induced by human was calculated by subtracting the background B0 field (Figure 3-E) from the position1 B0 field map (Figure 3-C). Figure 4 shows the predicted position2 B0 field variation of two clinical experiments (Figure 4-G), calculated using the linear relationship of B0 field variation and background B0 field found in simulation. The difference map (Figure 4-H) between the predicted and the actual position2 B0 field variations was calculated to evaluate the prediction accuracy. Around 98% voxels have a prediction error smaller than 50Hz, which can be seen on the histogram plot of the difference map (Figure 4-J). The other clinical experiment result (Figure 4-K, L and N) shows that 97% voxels have a prediction error smaller than 50Hz in difference map (Figure 4-N).
Discussion
Simulation results revealed the relationship between human-induced B0 variation (ΔB) and background field (B0) of each voxel in space that could be represented as:ΔB(x,y,z) = k(x,y,z) · B0(x,y,z) + b(x,y,z) (1)
In clinical practice, the B0 variation could be calculated with field map with human loaded (F) and the background field(B0). The function could be represented as:
F(x,y,z) - B0(x,y,z) = k(x,y,z) · B0(x,y,z) + b(x,y,z) (2)
In clinical scan, the k and b value in function (2) could be calculated with 2 pairs of scanning data. Considering that b value matrix had a noise pattern, we simplified the function (2) as F(x,y,z) - B0(x,y,z) = k(x,y,z) · B0(x,y,z) and used this function to predict field variation in our clinical experiment. The result of our clinical experiment confirmed that the simplified B0 filed prediction method showed an acceptable field prediction accuracy.
The findings of this study could be incorporated in the calculation of changed B0 field in clinical scan caused by patient movement. The field prediction method will be furthermore applied to image quality improvement and scan workflow simplification, etc.
Acknowledgements
No acknowledgement found.References
1. Jain V, Abdulmalik O, Propert KJ, Wehrli FW. Investigating the magnetic susceptibility properties of fresh human blood for noninvasive oxygen saturation quantification. Magnetic resonance in medicine. 2012 Sep;68(3):863-7.
2. Garcia MA, Baffa O. Magnetic fields from skeletal muscles: a valuable physiological measurement?. Frontiers in physiology. 2015 Aug 10;6:228.
Figures