4276
Investigation of pTx pulses for magnetisation inversion on 7T Terra1Wolfson Brain Imaging Centre, University of Cambridge, Cambridge, United Kingdom, 2Siemens Healthcare Limited, Firmley, United Kingdom, 3Siemens Healthcare Limited, Erlangen, Germany
Synopsis
We compare performance of two approaches for magnetisation inversion on a Siemens 7T Terra scanner, with 8Tx32Rx Nova head coil. We compared 3D non-selective pTx pulses designed in the scanner’s online pulse design tool, against traditional adiabatic pulses in both phantoms and the brain of a volunteer. We observe that spiral pTx pulses have substantially lower SAR burden than adiabatic hyperbolic secant pulses, but using the default parameter sets, the spiral inversion is less homogeneous. Thus, spiral pTx pulses are advantageous in SAR limited sequences, and further optimisation is likely to improve the inversion efficiency of these pulses.
Introduction
With the recent release of the first clinically approved 7T MRI scanner that incorporates an integrated parallel transmit (pTx) pulse design system, we have seen increased interest in utilising pTx technology for applications studies at 7T. This abstract aims to make an initial comparison in performance for magnetisation inversion between 3D non-selective pTx pulses designed online and traditional adiabatic pulses.Pulse design
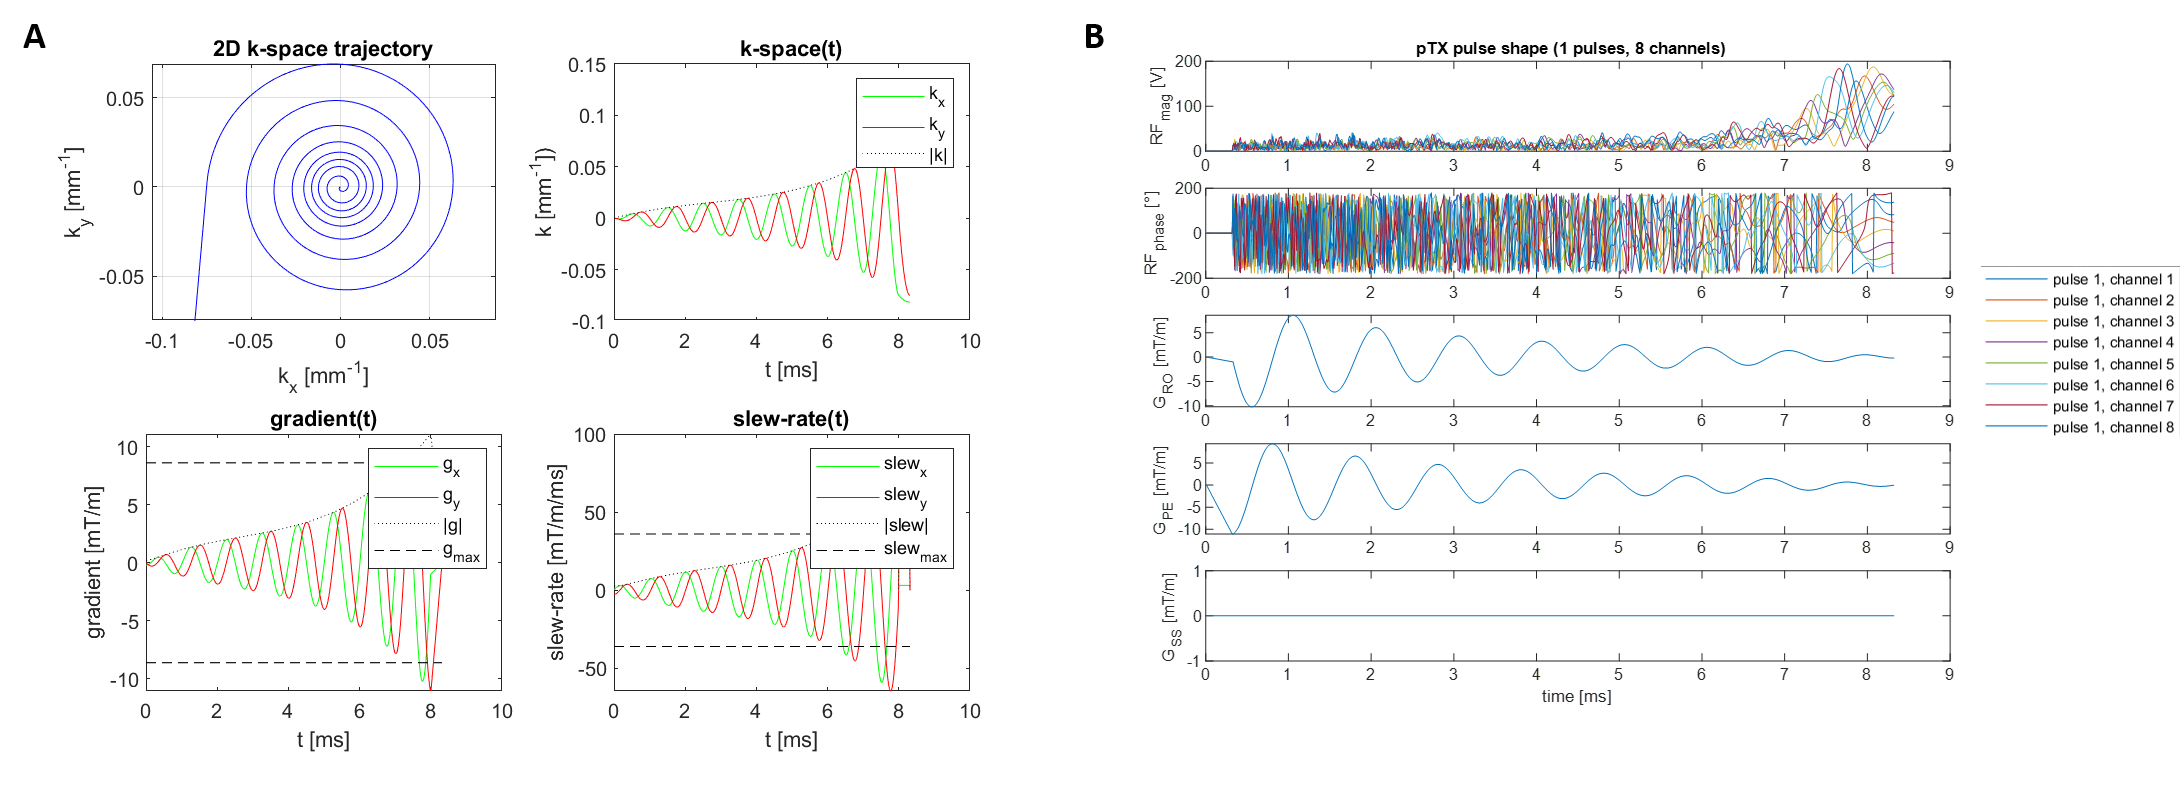
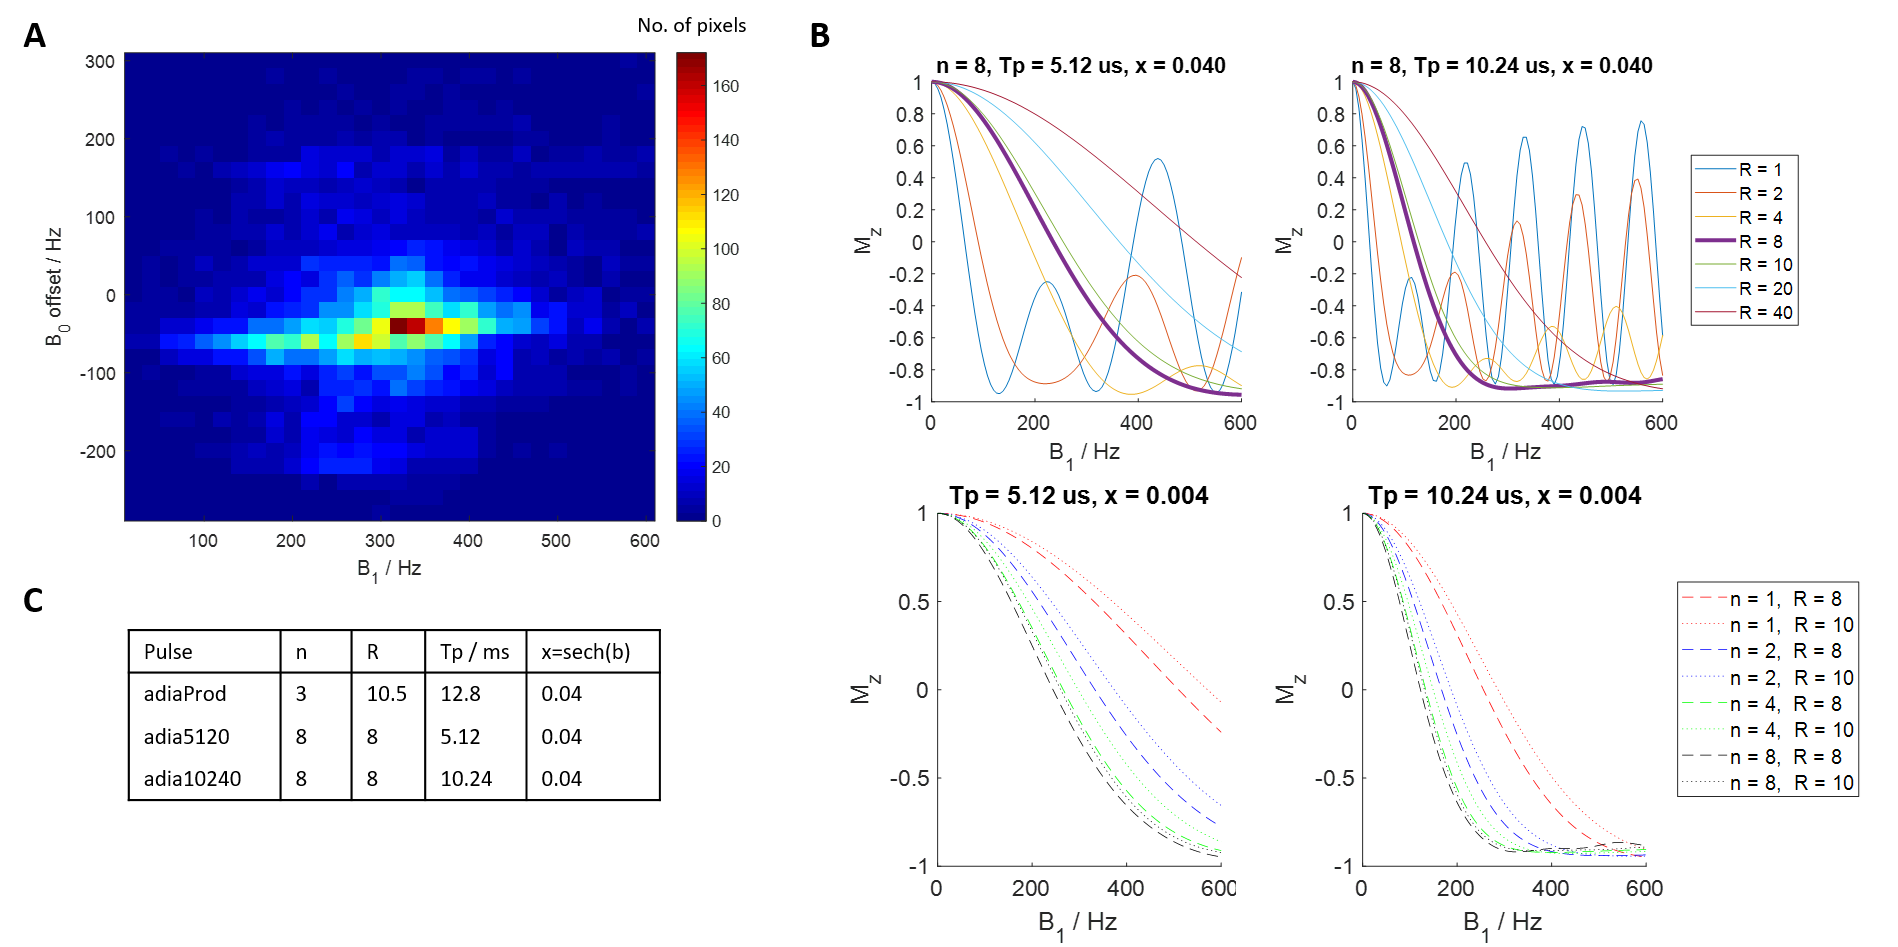
pTx pulse design: Non-selective spiral RF pulses1 were calculated on a per subject basis using the Siemens pulse design tool in MATLAB (Mathworks, Natick, MA). A spiral-in trajectory with variable density and 8 revolutions was chosen, before the pulse was optimised using a tictoc-least-square algorithm. An example spiral pulse design is shown in Figure 1.Adiabatic pulse design: Non-selective hypersecant pulses (HSn) were used and optimised over in vivo B1+ ranges acquired from eight healthy volunteers (Figure 2A). Two HSn pulses with durations of 5.12 and 10.24ms were optimised over R=1,2,4,8,10,20,40 and n=1,2,4,8, x=sech(β) was set at 0.04 (Figure 2B). The product inversion pulse with parameters corresponding to n=3, R=10.5, duration=12.8ms, x=sech(β)=0.04 was also used. Final pulses used are presented in Figure 2C. All pulses were played out at the scanner’s maximum allowed voltage.
Rectangular pulses: A non-selective rectangular pulse was also designed based on the reference voltage where its duration was minimised to maximise bandwidth.
The power of each pulse was subsequently calculated by:
$$\sum_{i=1}^8\int\frac{V_i(t)^2}{R}dt$$
Where Vi refers to the instantaneous RMS voltage on the ith channel and R is the system characteristic impedance (50ohm). Table 1 contains the calculated power of all pulses used.
Imaging protocol
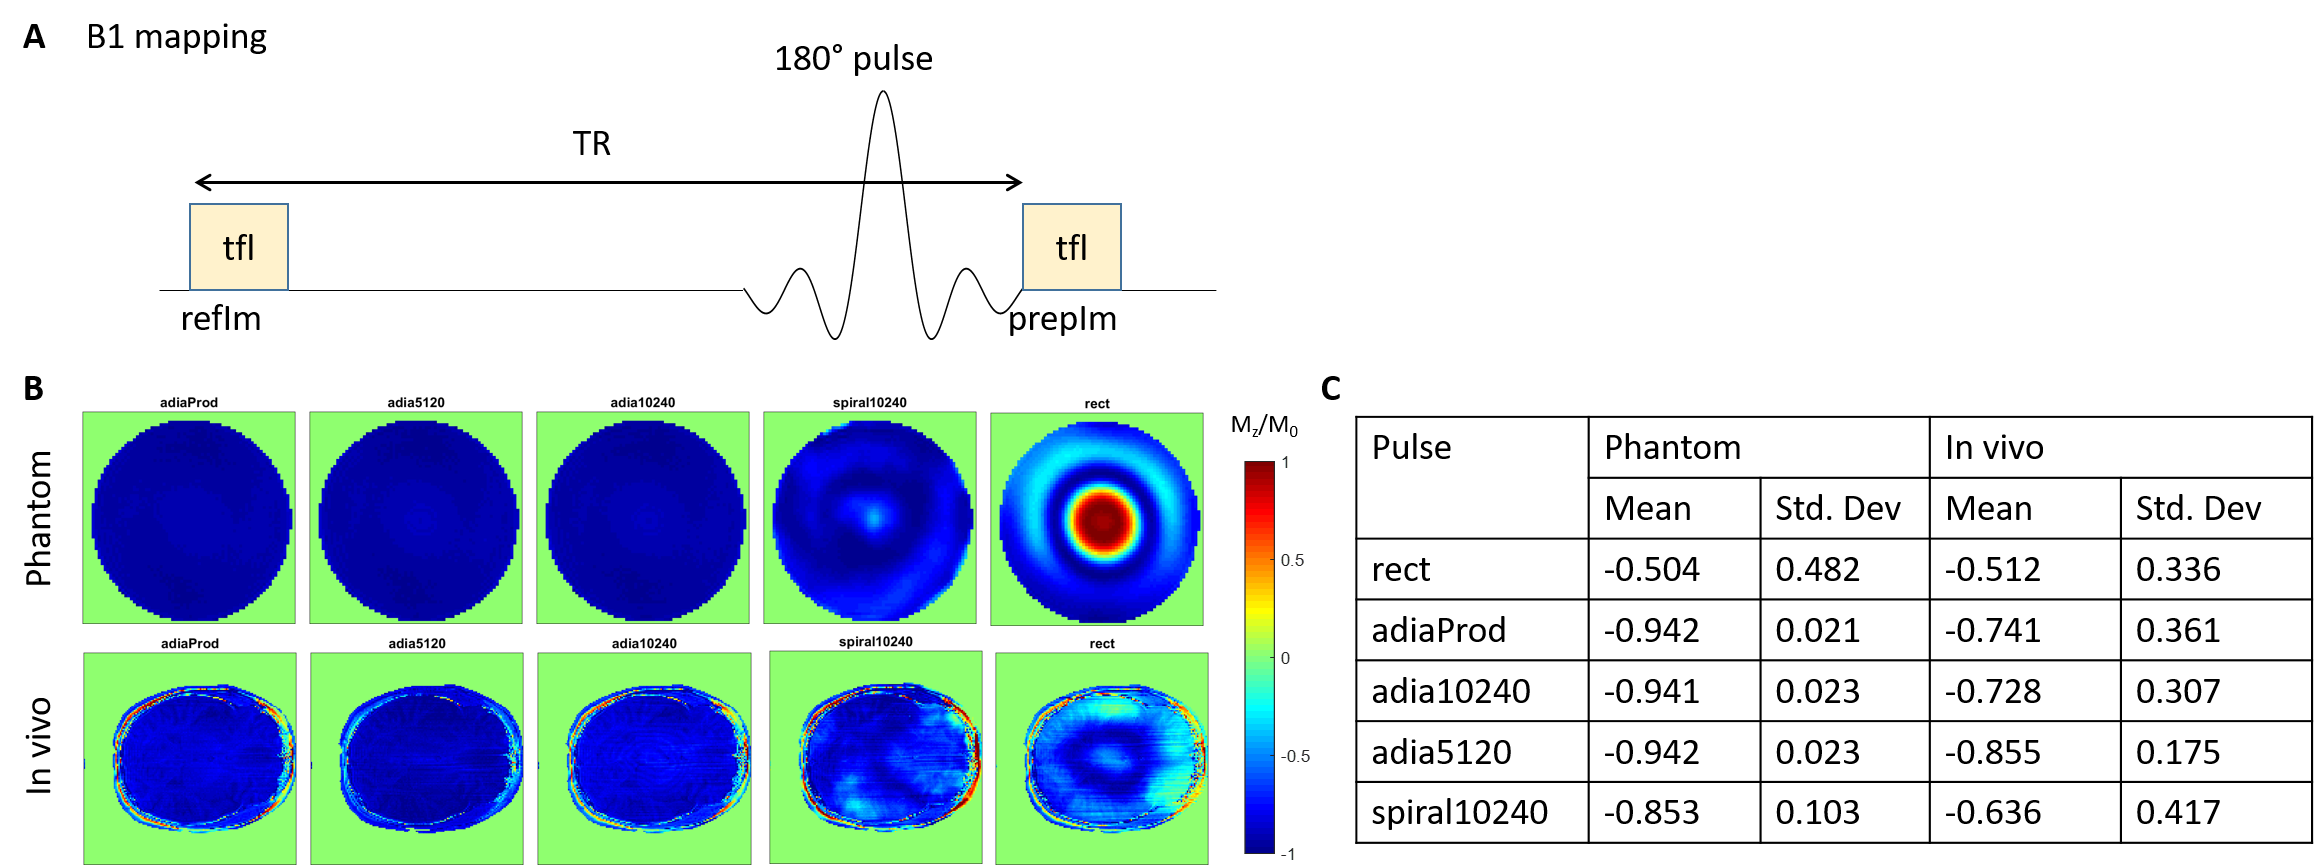
All scans were done on Magnetom Terra 7T system (Siemens, Erlangen, Germany) with an 8Tx32Rx head coil (Nova Medical, USA). All pulses were designed only on the centre slice of the imaging slab.B1-mapping: Turbo-FLASH (tfl) images were acquired in a spherical agar phantom and in one healthy volunteer with and without the various inversion preparation pulses to obtain two images (prepIm and refIm respectively, Figure 3A). Inversion efficiency (Mz/M0) of a pulse was evaluated by taking the pixel wise ratio of prepIm to refIm. Imaging parameters include: resolution=0.7×0.7×5.0(slice)mm3; TR/TE=10s/1.57ms; tfl flip angle (FA) =5°; bandwidth=450Hz/Px.
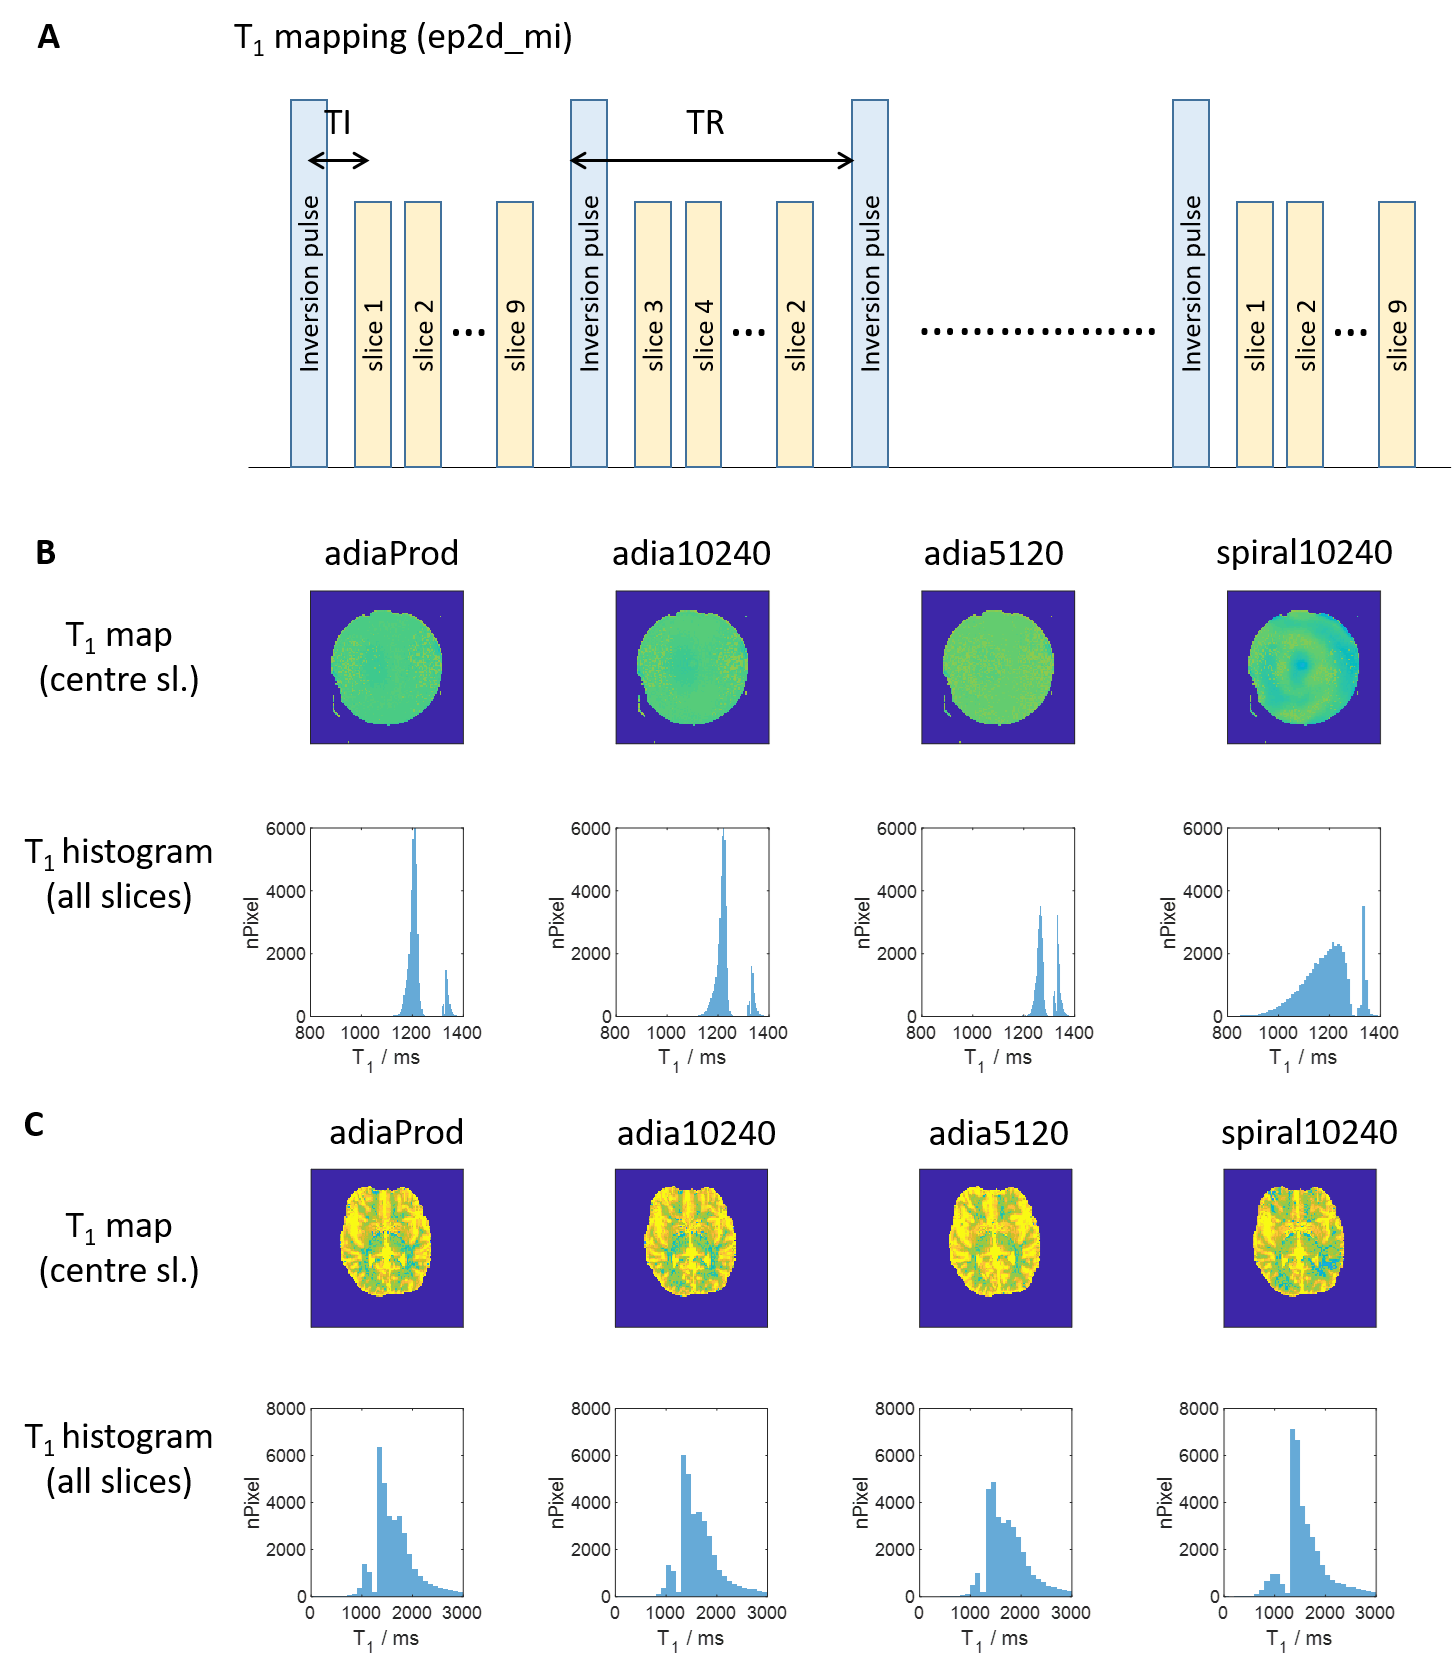
T1 mapping: Four different inversion pulses (adia5120, adia10240, adiaProd and spiral10240) were added to the product 2D-EPI sequence (Figure 4A). The slice ordering in the sequence was also changed such that it differs from volume to volume, resulting in each slice having a different inversion time in each volume2. Imaging parameters include: resolution=2.0×2.0×2.3(slice)mm3; 9 slices across the temporal lobes with distance factor of 100%; TR/TE/TI=8000/25/35ms; GRAPPA=2(24 reference lines); partial Fourier=6/8; bandwidth=1748Hz/Px; phase encoding direction=A>P. Spokes-2 pulses (FA=90°) were used for EPI excitation. The resultant volumes were fitted to a steady state equation to obtain a T1 map of the brain. Simulation have shown at that TR of 8000ms, excitation FA can vary up to 60 degree without affecting the accuracy of the fitted T1 by more than 5%.
$$M_z = M_0[1 - e^{-{\frac{TI_n}{T_1}}} +e^{-{\frac{TR-TI_{n-1}+TI_{n}}{T_1}}} ]$$
for the nth volume with n > 1.
Results and discussion
Figure 3B shows the inversion efficiency of all 5 different pulses while Figure 3C shows the mean inversion efficiency of the various pulses. For non-selective inversion, adiabatic pulses achieved the best inversion efficiencies and homogeneities in both the in vivo subject and the phantom. Spiral pulse achieved just 12.5% lower mean inversion efficiency, and 25% increase in standard deviation for in vivo measurements. However, the power of spiral pulses is only about 4% that of adiabatic pulses (Table 1).T1 mapping in phantom (with a known T1 of 1524ms measured by spectroscopy) showed that using both adiabatic and spiral pulses achieved results that were in close agreement (Figure 4B). However, the spread in T1 values when using the spiral pulse is larger than when using adiabatic pulses. The difference in performance between these two classes of pulses is smaller when used in vivo, where all pulses were able to produce T1 values consistent with previous literature data3 (Figure 4C).
Conclusion
This abstract has demonstrated that spiral pulses are a feasible low-SAR alternative to traditional adiabatic pulses without much compromise to inversion efficiency or image quality. The initial set of results shows potential, that with more optimisation, the inversion efficiency of pTx spiral pulses can be improved while maintaining their low SAR advantage. On top of that, it might not be possible to achieve the needed transmit B1 to reach the adiabatic condition in certain conditions (e.g. body imaging). In such cases, spiral pulses would be an ideal substitute for adiabatic pulses.Acknowledgements
BD is supported by Gates Cambridge Trust. CR is funded by the NIHR Cambridge Biomedical Research Centre and the Isaac Newton Trust. CTR is funded by a Sir Henry Dale Fellowship from the Wellcome Trust and the Royal Society [098436/Z/12/B]. This study was funded by the NIHR Cambridge Biomedical Research Centre and MRC Clinical Research Infrastructure Award for 7T and has also received funding from the European Union’s Horizon 2020 research and innovation programme under grant agreement No 801075.References
1. Setsompop, K. et al. Parallel RF transmission with eight channels at 3 Tesla. Magn. Reson. Med. 56, 1163–1171 (2006).
2. Sanchez Panchuelo, R., Turner, R., Mougin, O. & Francis, S. A 2D multi-shot inversion recovery EPI (MS-IR-EPI) sequence for high spatial resolution T1-mapping at 7T. Proc. ISMRM 0060 (2018).
3. van der Kolk, A. G., Hendrikse, J., Zwanenburg, J. J. M., Visser, F. & Luijten, P. R. Clinical applications of 7 T MRI in the brain. Eur. J. Radiol. 82, 708–718 (2013).
Figures