4272
Development of a Three-Compartment Spherical CEST and T1 Phantom for UHF Sequence Development and Testing
Ryan T Oglesby1,2, Wendy Oakden2, Wilfred W Lam2, Agata Chudzik3, Katarzyna Kochalska3, Radoslaw Rola3, and Greg J Stanisz1,2,3
1Medical Biophysics, University of Toronto, Toronto, ON, Canada, 2Sunnybrook Research Institute, Toronto, ON, Canada, 3Neurosurgery and Paediatric Neurosurgery, Medical University of Lublin, Lublin, Poland
1Medical Biophysics, University of Toronto, Toronto, ON, Canada, 2Sunnybrook Research Institute, Toronto, ON, Canada, 3Neurosurgery and Paediatric Neurosurgery, Medical University of Lublin, Lublin, Poland
Synopsis
The development of quantitative MRI sequences at ultra-high field (UHF) (7 T or higher) is difficult due to non-uniform RF fields, enhanced susceptibility artifacts, and increased SAR. Phantoms are required in order to test quantitative pulse sequences, and it becomes increasingly important that artifacts in phantoms be as similar as possible to those observed in vivo. In this study, a 3D printed three-compartment spherical phantom was designed to evaluate chemical exchange saturation transfer (CEST), magnetization transfer (MT), and T1 mapping sequences on UHF MRI systems.
Introduction
Ultra-high field (UHF) MRI systems, 7 T (≥300 MHz) or higher, have the benefit of increased signal to noise ratio allowing finer structures at the mesoscopic scale to be visualized and smaller physiological effects to be detected 1. However, UHF comes with additional challenges including non-uniform radio frequency (RF) fields, greater susceptibility artifacts, and larger energy deposition 2. Phantoms are required in order to test quantitative pulse sequences, and it becomes increasingly important that artifacts in phantoms be as similar as possible to those observed in vivo. In this study, a phantom was designed to evaluate chemical exchange saturation transfer (CEST), magnetization transfer (MT), and T1 mapping sequences on UHF MRI systems.Methods
Phantom Design: Figure 1 shows a phantom schematic. A spherical geometry was required for B0 shimming and to fit a head coil. The fill port locations were chosen to reduce air bubble formation, which would cause field inhomogeneities. Three compartments were included to allow ranges of T1, CEST, and MT parameters similar to those observed in vivo. The phantom was 3D printed (Viper si, 3D Systems) out of Accura ClearVue.Sample Preparation: Agar (1% mass/volume) provided MT contrast, Copper (II) sulfate pentahydrate (CuSO4·5H2O) to affect T1, and ammonium chloride (NH4Cl) to provide CEST contrast. Compartments were filled as follows:
- 0.5mM CuSO4·5H2O + 100mM NH4Cl
- 0.5mM CuSO4·5H2O + 50mM NH4Cl
- 1.0mM CuSO4·5H2O + 50mM NH4Cl
7T scanning was performed using Discovery MR950 system (GE Healthcare, Waukeshaw, WI) using a 32-channel receive head coil and a 2-channel transmit birdcage head coil. A 3D FLAIR sequence was used for structural scanning. Saturation-transfer weighted images were acquired using the epiCEST sequence with saturation transfer preparation (one block pulse of 1500ms; amplitudes and offsets in Table 1) and a single-shot EPI readout. Three images were acquired consecutively at each saturation offset, and only the third image was used in the analysis because it was in saturation steady state. The GE Field Map protocol was used to produce B1 and B0 maps. The standard “Autoshim” procedure was used to provide x-, y- and z-gradient shims over the whole phantom.
Results
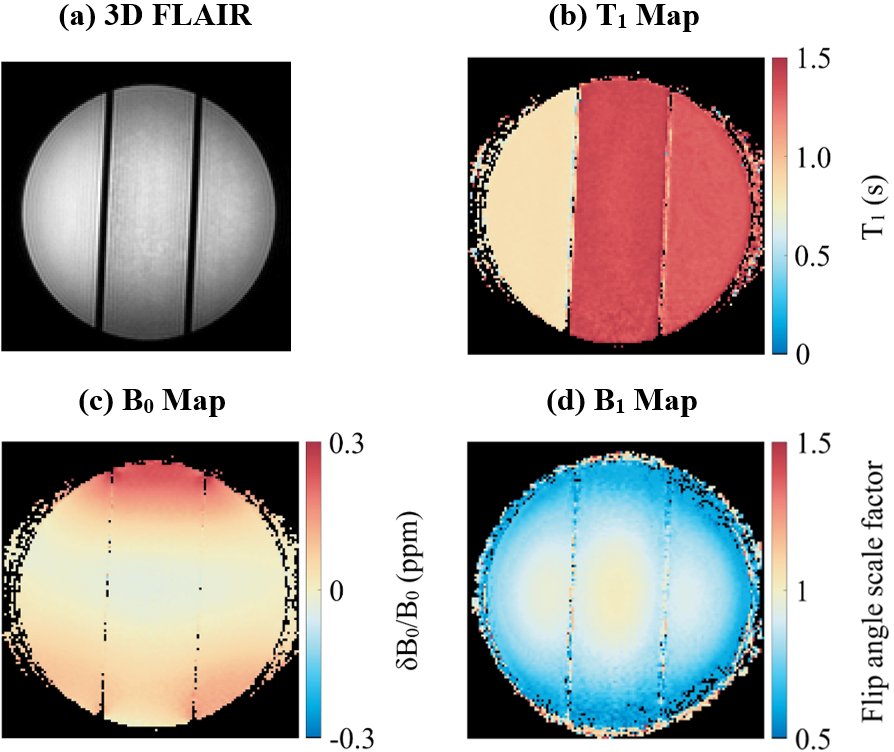
Figure 2 shows imaging results from 3T. 3D FLAIR (Fig. 2a) shows the three phantom compartments. The T1 map (Fig. 2b) shows the lower T1 in the compartment with higher concentration of CuSO4·5H2O, and the higher T1 in the other two compartments. B0 and B1 maps (Fig. 2c&d) show the variation in B0 and B1 across the phantom.Figure 3 shows imaging results from both phantom and human brain acquired at 7T. The variation in B0 is similar in the phantom and in the brain (Fig. 3b&f), except near the sinus cavities which cause larger field variations in the brain. The B1 maps (Fig. 3c&g), display a similar pattern in both phantom and brain with higher flip angles near the center, and lower flip angles near the edges.
Figure 4 shows CEST spectra from brain and from phantom compartments with high and low CEST contrast. The size of the CEST peaks are comparable to that observed in vivo.
Discussion
The similarities in variation and pattern in B0 and B1 fields between phantom and brain data indicates that both will require a similar degree of correction.MT and CEST contrast are both present in the phantom, in addition to having T1 values in a similar range to that of brain. This is important as the CEST signal is affected by both MT and T1. The amount of CEST contrast is similar to that in brain (Fig. 4) which will allow the variability due to imaging artifacts to be estimated. The variation in T1 values in the center and right-most compartments (Fig. 2b) are the result of small effects of NH4Cl on T1. It is possible to adjust the amount of CuSO4·5H2O in order to match the T1 values perfectly, but this is unlikely to be necessary.
Conclusions
The three-compartment spherical phantom is a durable, user friendly, and customizable research tool which successfully mimics the CEST, MT, and T1 properties of the human brain as well as having similar variations in B0 and B1. The multi-compartment phantom is ideal for development and testing of quantitative CEST sequences.Acknowledgements
We thank the Canadian Institutes for Health Research (PJT156252) for financial support.References
- Dumoulin SO, Fracasso A, van der Zwaag W, Siero JCW, Petridou N. Ultra-high field MRI: Advancing systems neuroscience towards mesoscopic human brain function. Neuroimage 2018;168:345–357.
- Ladd ME, Bachert P, Meyerspeer M, et al. Pros and cons of ultra-high-field MRI/MRS for human application. Prog Nucl Magn Reson Spectrosc 2018;109:1–50.
- Kim M, Gillen J, Landman BA, Zhou J, van Zijl PCM. Water saturation shift referencing (WASSR) for chemical exchange saturation transfer (CEST) experiments. Magn Reson Med 2009;61:1441–1450.
- Schuenke P, Windschuh J, Roeloffs V, Ladd ME, Bachert P, Zaiss M. Simultaneous mapping of water shift and B1 (WASABI)-Application to field-inhomogeneity correction of CESTMRI data. Magn Reson Med 2017;77:571–580.
Figures
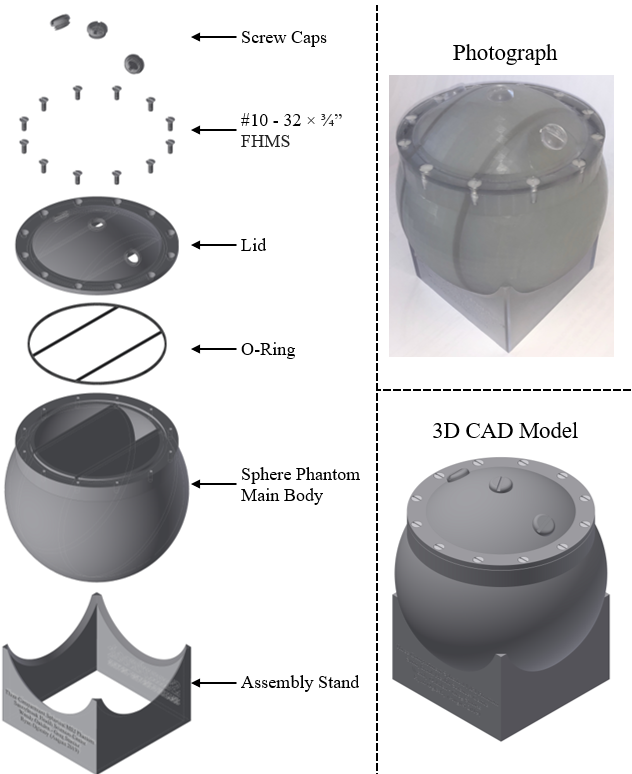
Figure 1: Left: Exploded view
assembly of three-compartment spherical phantom. FHMS refers to flat head
machine screws. Right: photograph and assembly drawing of three-compartment
spherical phantom. All drawings were generated using Autodesk Inventor
Professional 2017.
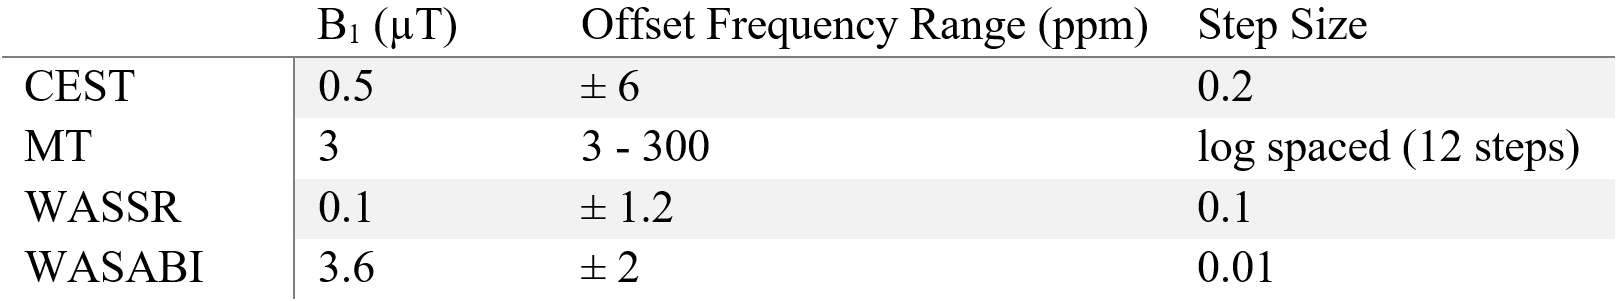
Table
1: Saturation amplitudes and offset
frequencies for saturation-transfer weighted images.
Figure
2: 3 T Quantitative MRI maps. (a)
3D FLAIR used to prescribe a large cross-sectional slice. (b) T1 map
calculated from inversion recovery sequences. (c) B0 map calculated
from WASSR. (d) B1 map calculated from WASABI.
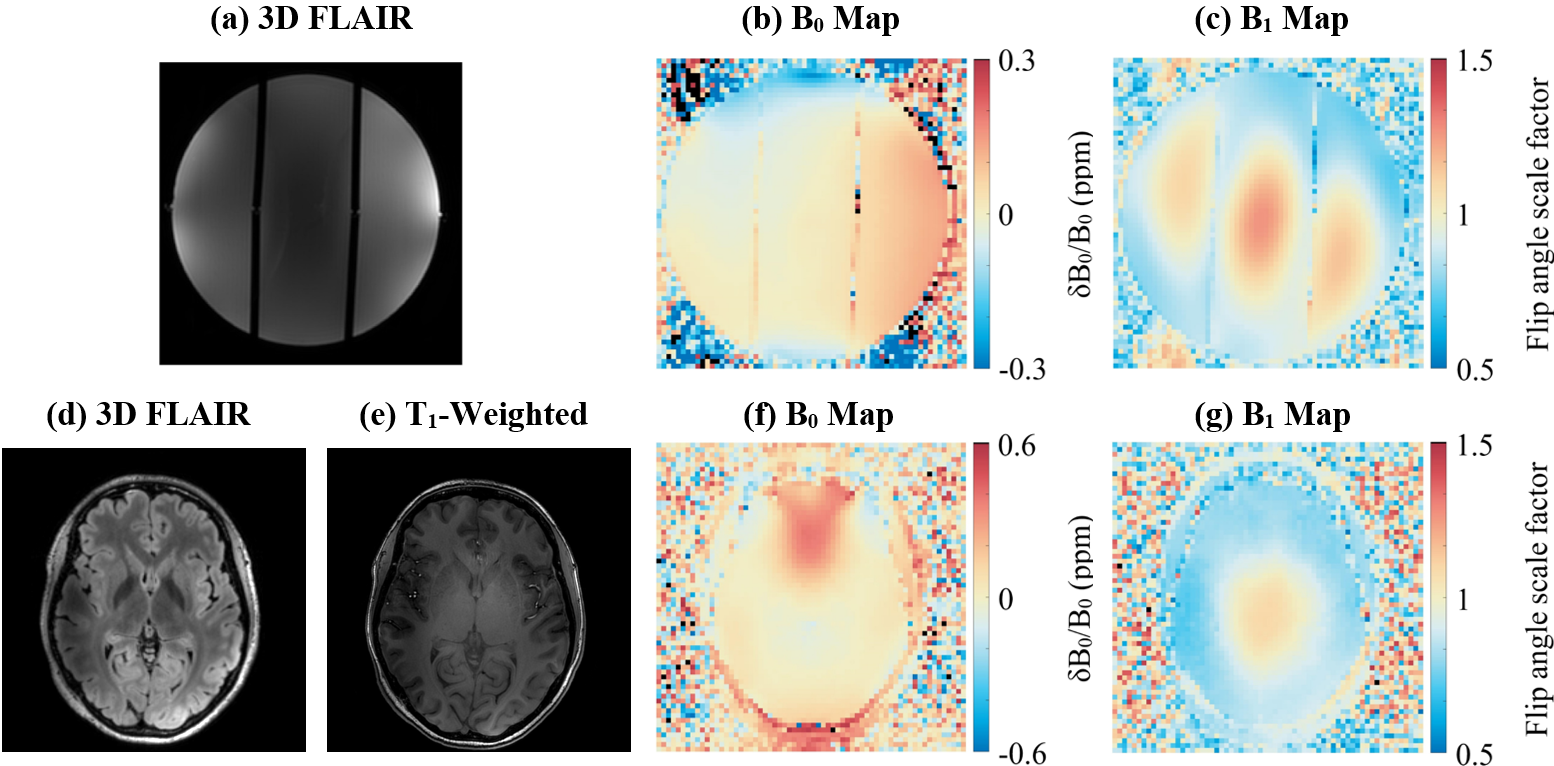
Figure
3: 7 T Quantitative MRI maps for
the spherical phantom (a, b, c) and a human brain (d, e, f, g). 3D FLAIR (a
& d) used to prescribe a large cross-sectional slice. T1-weighted
structural image (e). B0 maps
(b & f) and B1 maps (c & g) calculated from the GE Field Map
protocol.
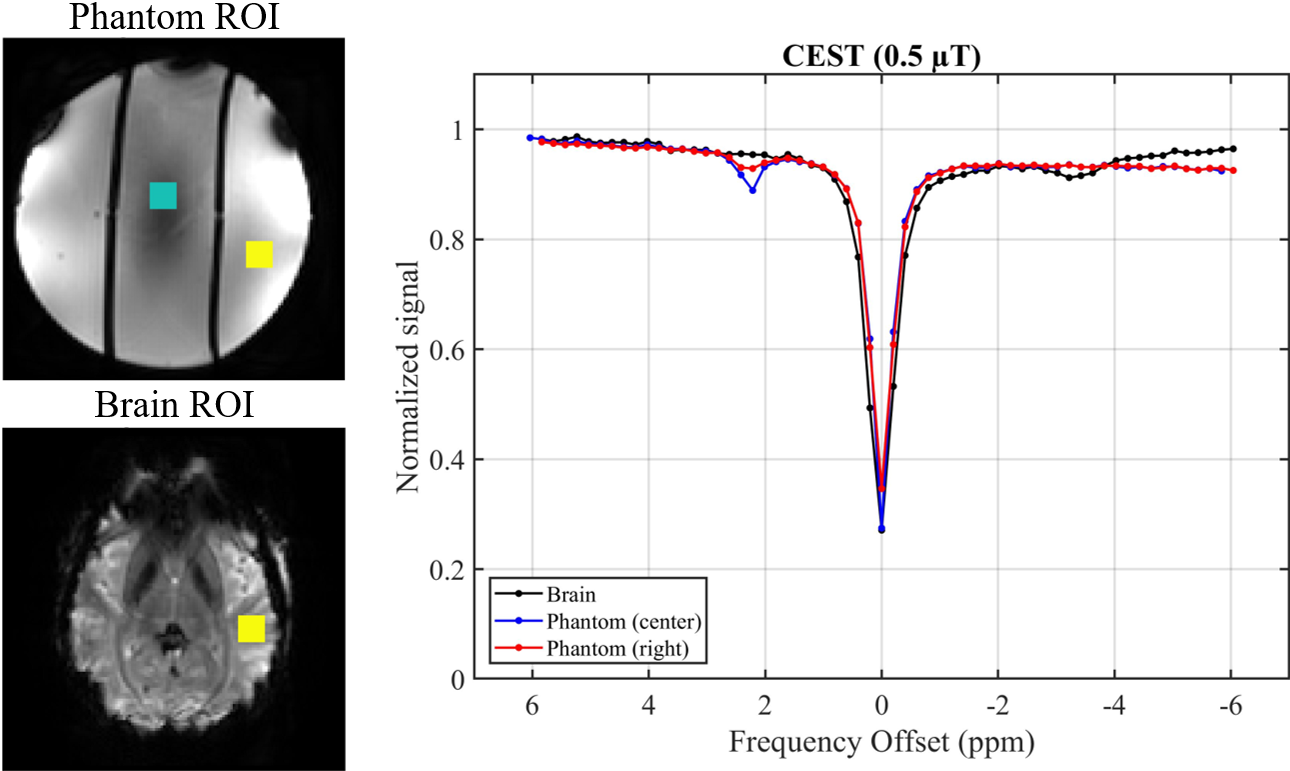
Figure
4: Z-spectra comparison for sphere
phantom and human brain at 7 T.