4257
Virtual Observation Points calculated using Spectral and Frobenius Norms
Arthur W. Magill1
1Medical Physics in Radiology, German Cancer Research Center (DKFZ), Heidelberg, Germany
1Medical Physics in Radiology, German Cancer Research Center (DKFZ), Heidelberg, Germany
Synopsis
Virtual Observation Point (VOP) sets generated using the spectral and Frobenius norm are compared. It is found that while the spectral norm produces less VOPs for a certain over-estimation factor, the Frobenius norm actually produces more accurate VOPs. When compared in terms of sets containing (approximately) equal numbers of VOPs, the Frobenius norm performs better.
Introduction
During parallel transmit experiments it is critical to patient safety to accurately estimate SAR deposition, which depends not only on the RF coil design, but also on the RF signals applied to the coil. In contrast to single-channel transmission, the location the SAR hotspot changes depending on the transmit pulse amplitudes and phases. SAR generated by a transmit array can be elegantly described using the Q-matrix formalism, but full modelling of heating in a human volunteer requires millions of Q-matrices to be assessed for every sample of the RF waveform. The Virtual Observation Point (VOP) algorithm compresses this large set of Q-matrices into a more manageable reduced set, typically of a few hundred matrices, enabling online SAR monitoring [1]. In compressing the set of Q-matrices, the VOP algorithm guarantees not to under-estimate SAR deposition, and to restrict the over-estimation to a predetermined amount.As part of the VOP algorithm, the original paper proposes two suitable norms - the spectral and the Frobenius norm - but does not further investigate any differences between them. This abstract investigates that question, comparing VOP sets generated at different over-estimation thresholds using both norms.
Theory
For a Hermitian matrix $$$\bf{A}$$$, the spectral norm is\begin{equation} \lVert\bf{A}\rVert_2 = \lambda_{\max} \left( \bf{A} \right) \end{equation}
where $$$\lambda_{\max}$$$ is the largest eigenvalue of $$$\bf{A}$$$. The Frobenius norm is
\begin{equation} \lVert\bf{A}\rVert_F = \sqrt{\sum_{i=1}^n \lambda_i^2(\bf{A}) }, \end{equation}
where $$$n$$$ is the size of $$$\bf{A}$$$ and $$$\lambda_i$$$ are its eigenvalues [2]. Both norms may be considered as an extension of a 2-norm from vectors to matrices. The spectral norm describes the largest eigenvalue of the matrix, while the Frobenius norm can be thought of as an average across all eigenvalues.
The VOP algorithm applies matrix norms at two points: first, to select the 'largest' Q-matrix from the set of unclustered matrices used to start a new cluster, and second to determine the 'similarity' of a given Q-matrix to the core matrix of a cluster. The second of these functions is thought to be more critical to the performance of the VOP compression.
Methods
An 8-channel microstrip body coil [3] was simulated using CST Studio Suite 2019 (Dassault Systèmes, Darmstadt, DE) while loaded with the Duke body model [4] (fig. 1). Electric field and tissue property data were exported from CST and further processed using custom code written in Fortran. Q-matrices were calculated at each location, and averaged over 10 g cubes of tissue using dimension data exported from CST. The Q-matrix set was then compressed using the VOP algorithm using either the spectral or Frobenius norm at a range of over estimation factors ε. The behaviour of the different VOP sets were then investigated by applying the same 10,000 random trial excitation vectors to each dataset, where trial vectors were normalised to have constant power.Results
Figure 2 plots the number of VOPs generated for each norm as a function of the overestimation factor ε. For the same ε, using the Frobenius norm produces approximately $$$\sqrt{2}$$$ more VOPs than the spectral norm. However, scatter plots showing SARvop plotted against SARfull make it clear that VOP sets generated using the Frobenius norm include much lower over-estimation than sets generated using the spectral norm. Given these differences, it is difficult to compare VOPs generated with the two different norms. Figure 3 shows scatter plots generated using both norms where the over-estimation factor has been adjusted so that the total number of VOPs in each set is approximately the same (εs=0.20,0.10 and 0.05, εf=0.28,0.14 and 0.07). Under this constraint, the Frobenius norm is clearly superior. Figure 4 shows a set of violin plots for 10,000 random trials made against the spectral (blue) and Frobenius (red) generated VOP sets. The vertical axis shows the ratio SARvop/SARfull. The width of each bar shows the distribution of results, tick marks indicate the maximum, mean and minimum ratios, and the numbers above the bars give the number of VOPs in each set.Discussion and Conclusion
It is not clear why, when using the Frobenius norm, the achieved over-estimation factor is considerably below the requested value, at the cost of including more VOPs in the generated set. However, if the two norms are compared in terms of achieved over-estimation versus number of VOPs, the Frobenius norm is clearly performs better, as shown in figs. 3 and 4.It is interesting to note that in fig. 4, the actual over-estimation factor SARvop/SARfull is much larger than the value requested via the ε parameter. This is because the plot show the ratio of estimated to actual SAR, while the VOP algorithm guarantees a maximum over-estimation relative to the worstcase SAR.
In conclusion, the VOP algorithm appears to performance better when using the Frobenius norm, but further work is required to understand the relationship between the requested and achieved over-estimation, in particular to ensure that the strong guarantees built into the original VOP algorithm remain valid.
Acknowledgements
No acknowledgement found.References
[1] Eichfelder and Gebhardt, MRM 66(5), 2011; [2] Gene H. Golub and Charles F. Van Loan. Matrix Computations. Johns Hopkins University Press, 3rd edition, 1996; [3] Orzada et al, #2999, ISMRM 2009; [4] Christ et al, Physics in Medicine and Biology, 55(2):N23–N38, 2009.
Figures
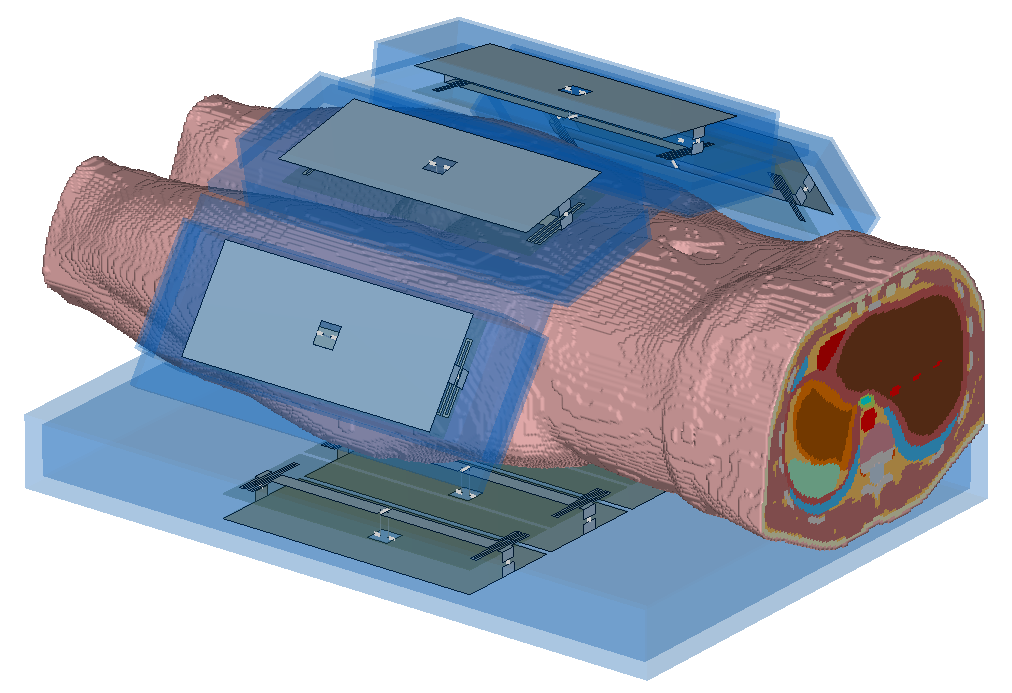
Simulation model for an eight channel microstrip coil, loaded with the pelvis region of Duke.
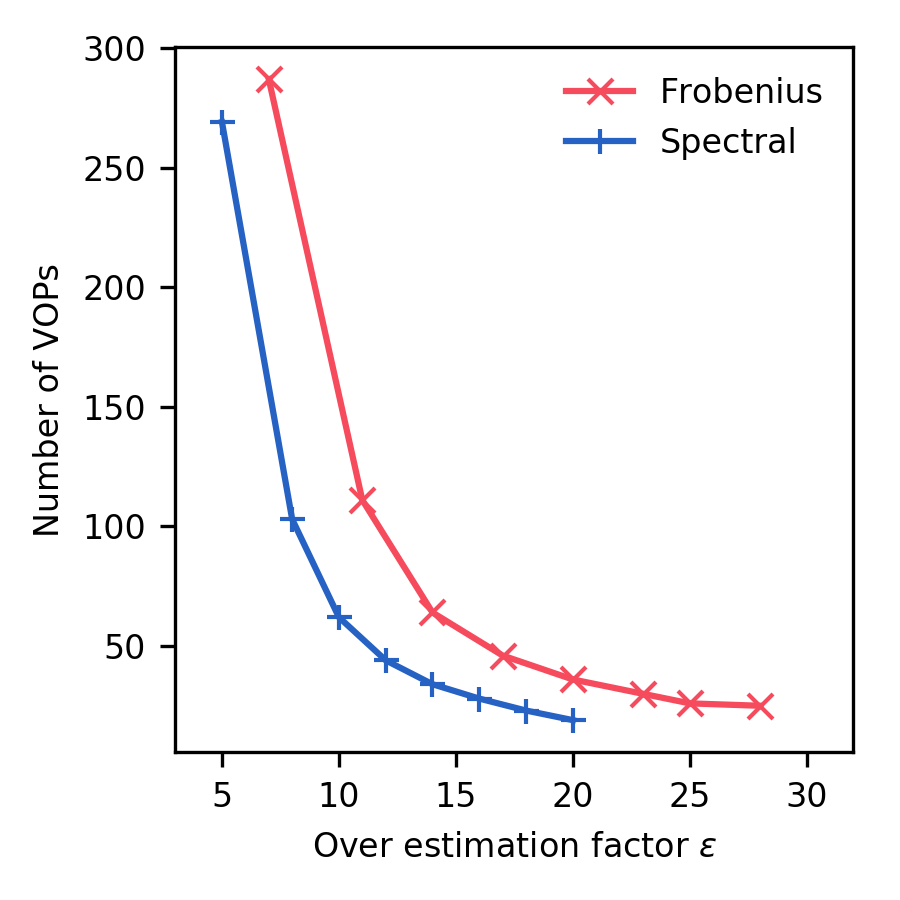
The number of VOPs plotted against the overestimation factor ε when using the spectral (blue) or Frobenius (red) norm.
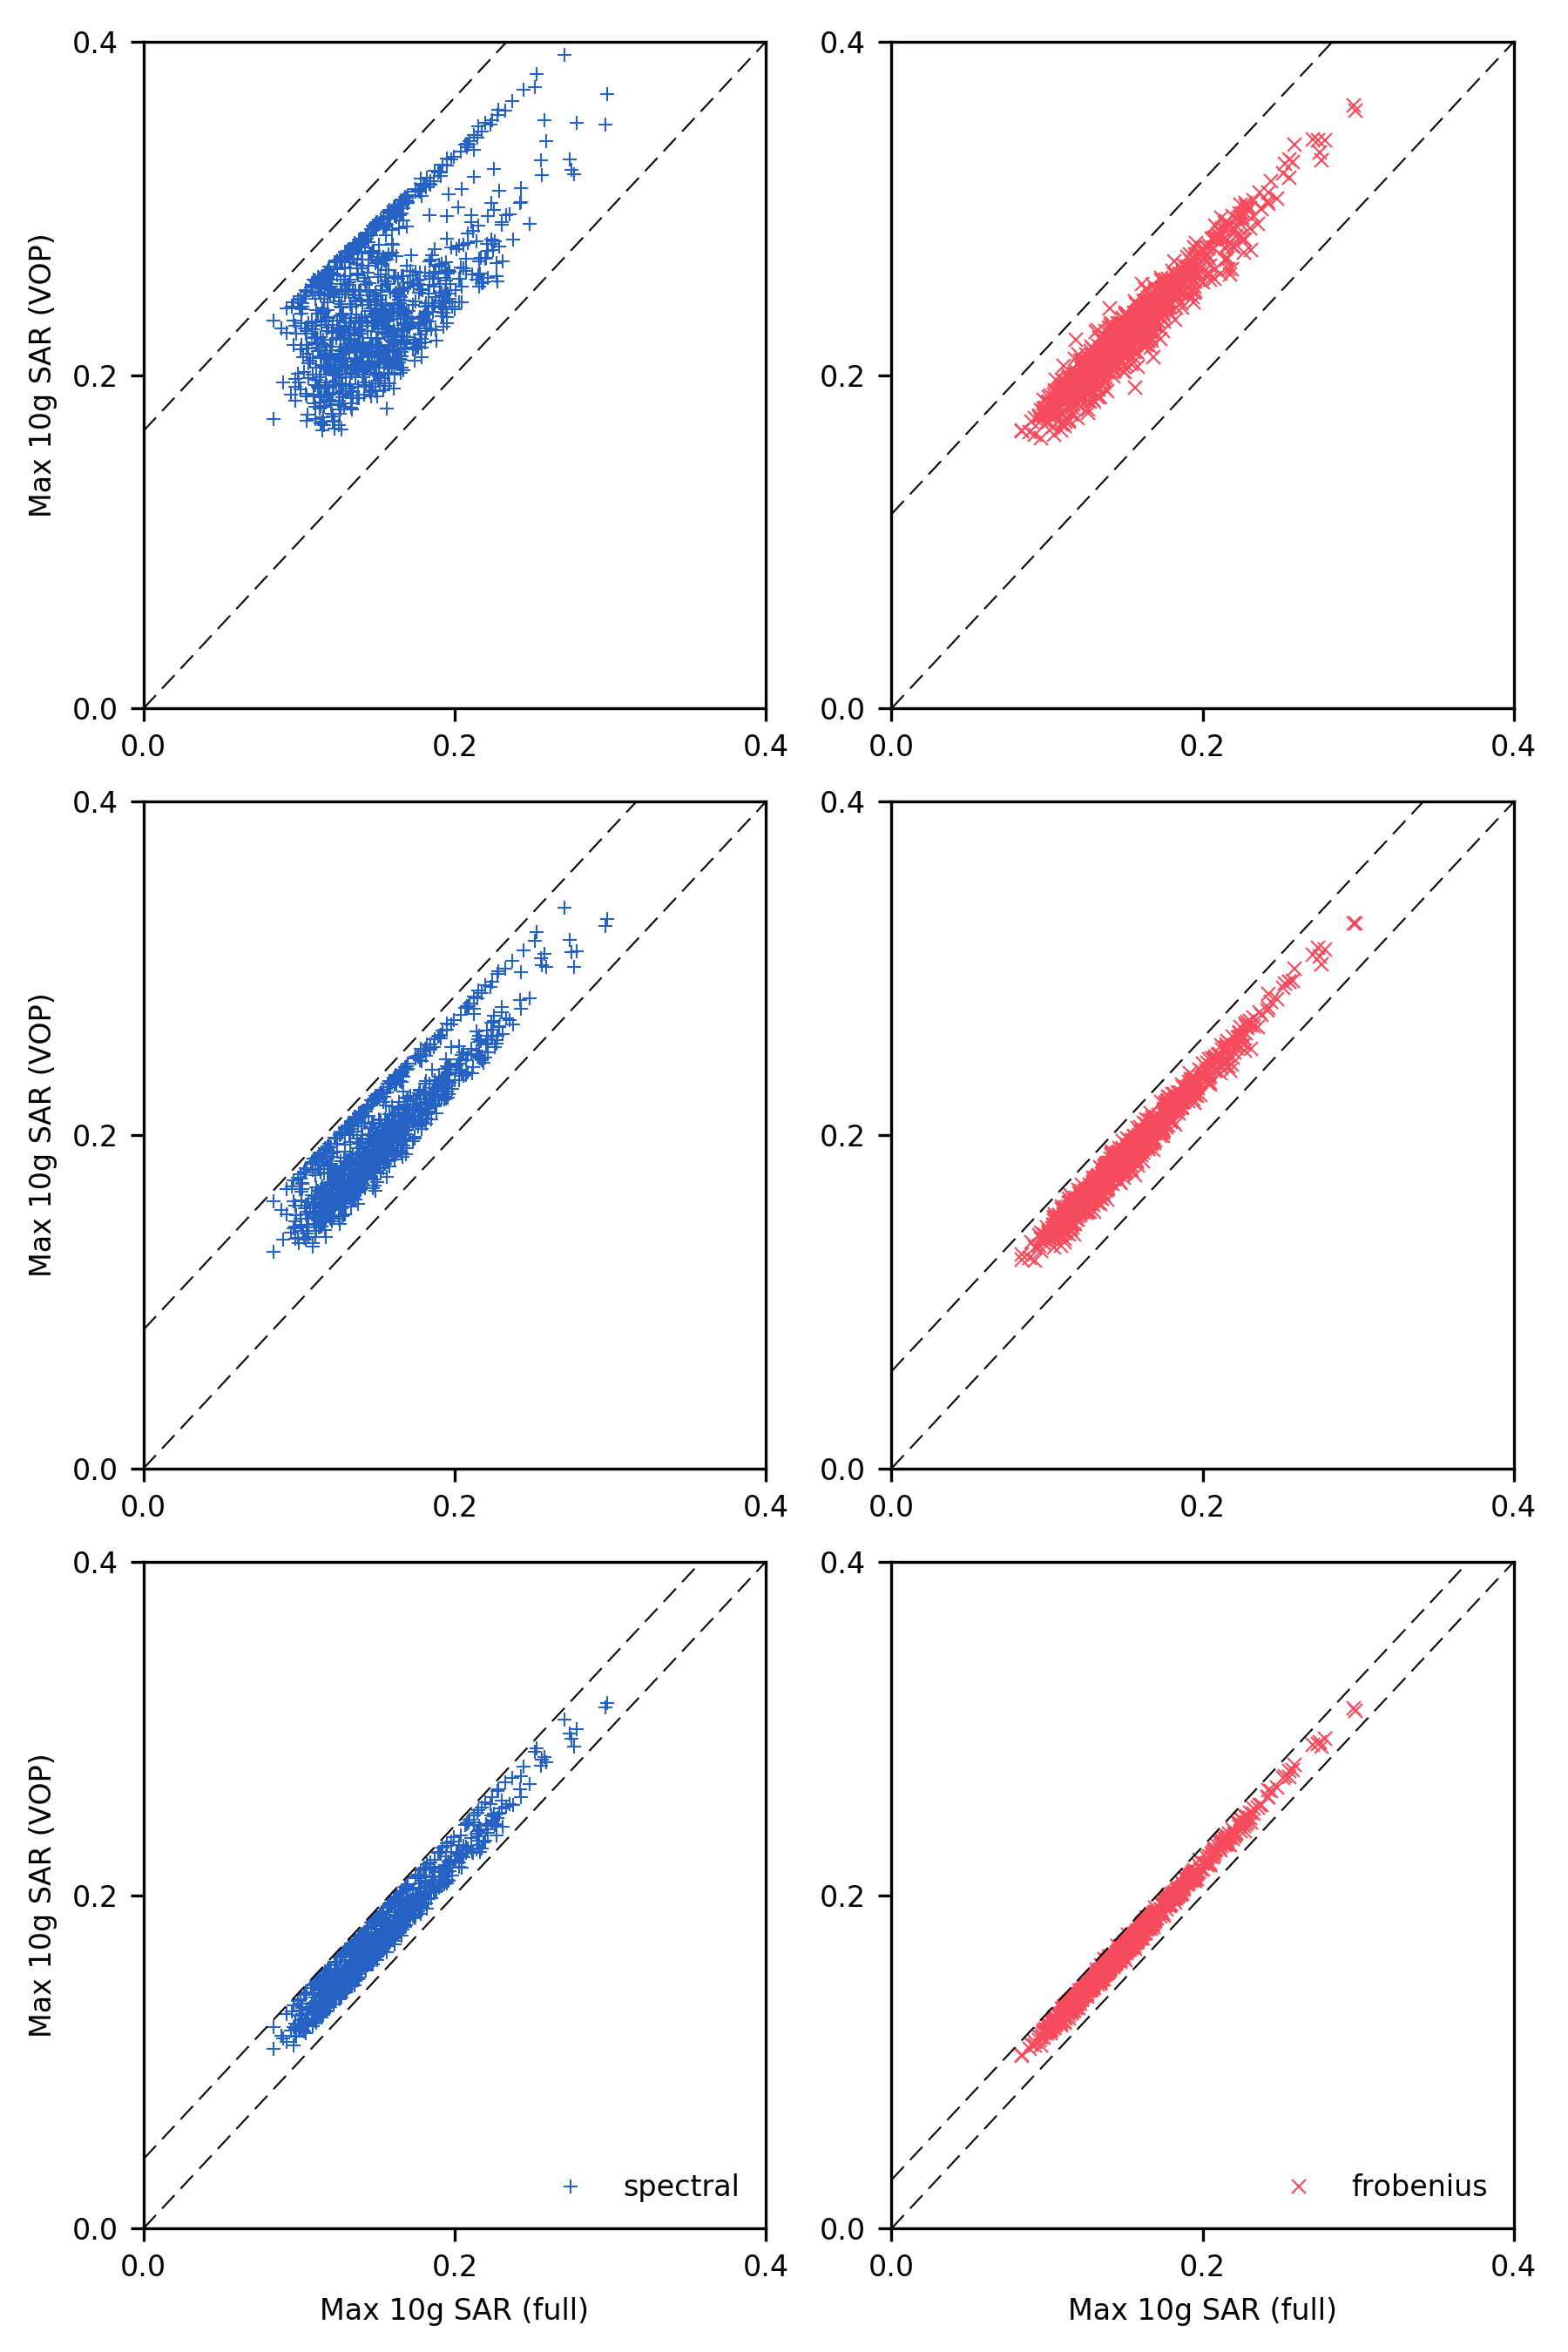
Scatter plots showing SAR estimated via the VOP model plotted against SAR calculated using the full model, for 100,000 random trials, for three different overestimation factors when using the spectral (blue) or Frobenius (red) norm. Overestimation factors were chosen to match the number of VOPs used for the two different norms.
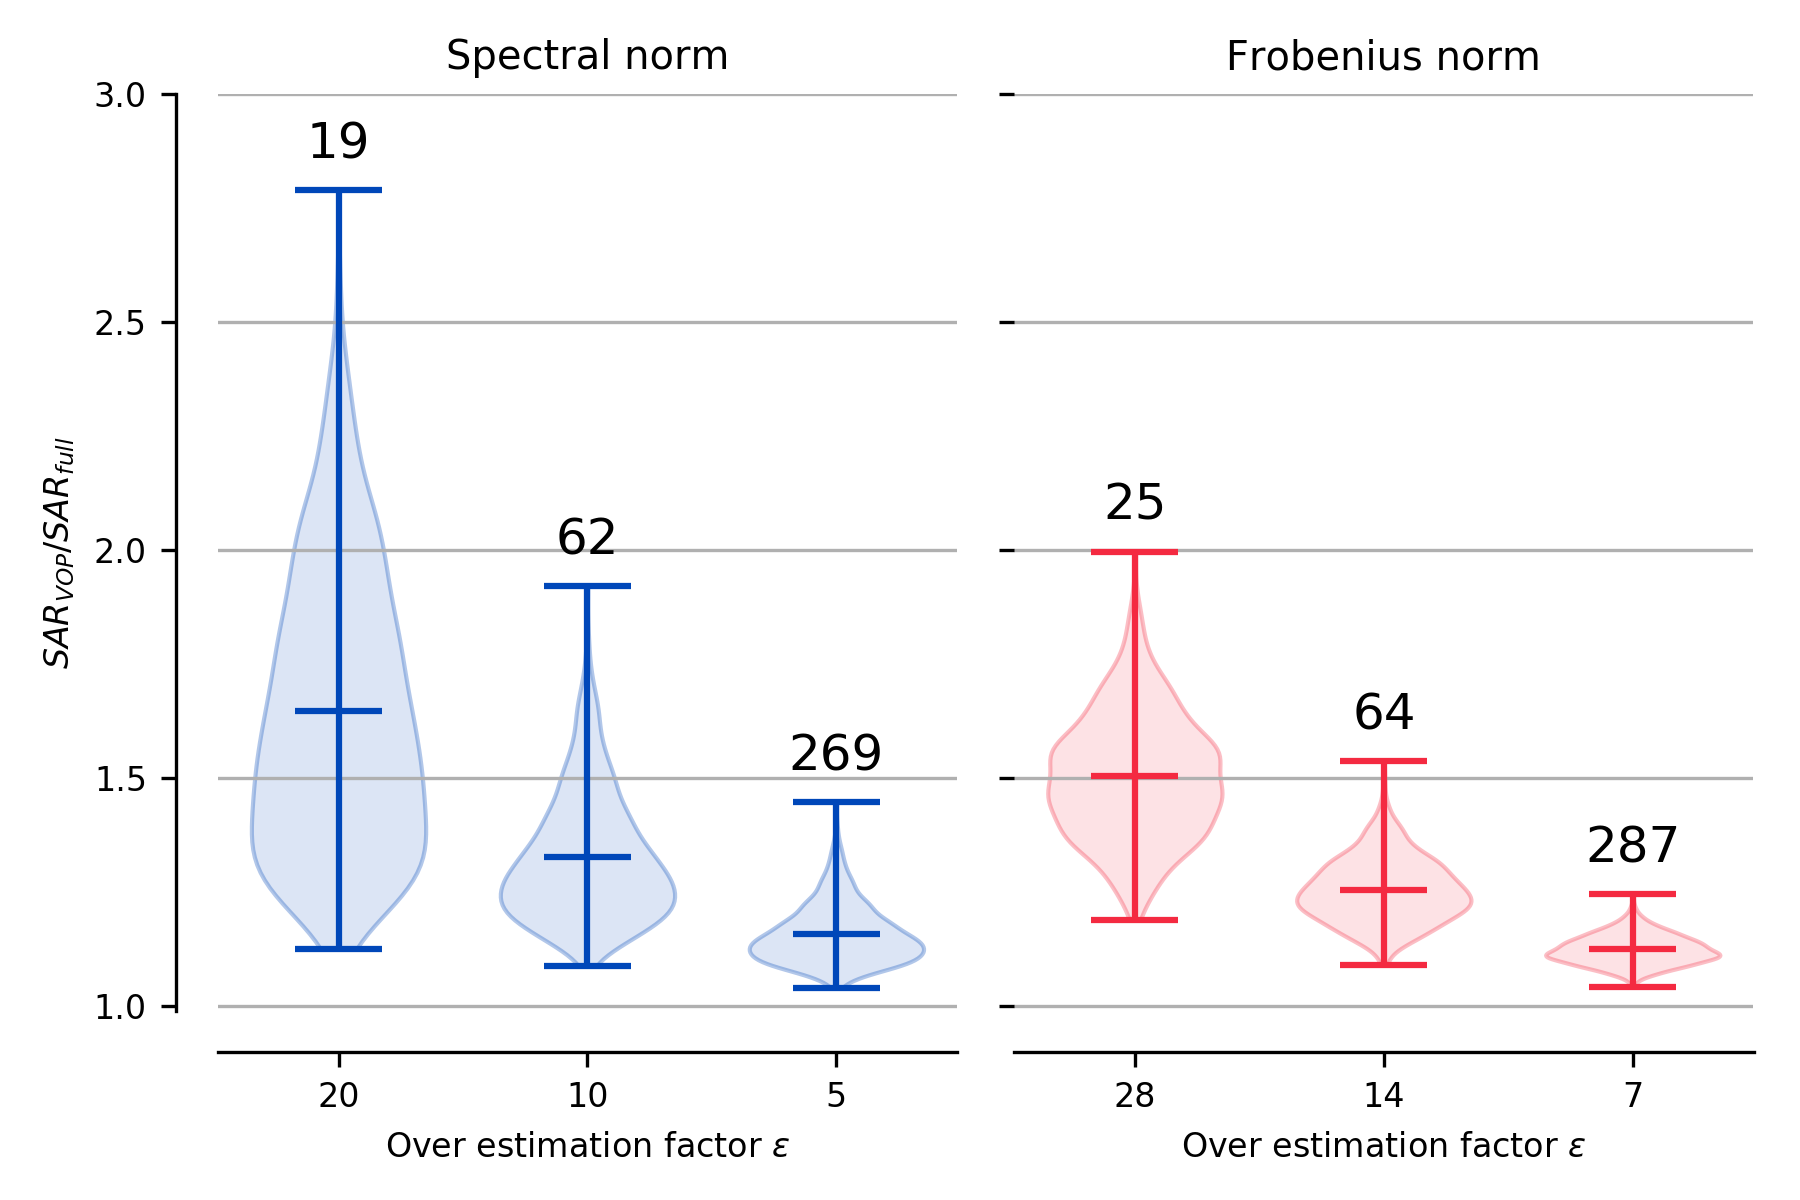
Violin plots showing the ratio SARvop/SARfull at three different overestimation factors, calculated for 100,000 random trials, using the spectral (blue) or Frobenius (red) norm. Tick marks indicate maximum, mean and minimum values, while the width of each bar shows the result distribution. Number above each bar give the number of VOPs in each model.