4251
Positional Sensitivity of Specific Absorption Rate in Head at 7T1Biomedical Engineering Department, School of Biomedical Engineering & Imaging Sciences, King's College London, London, United Kingdom, 2Centre for the Developing Brain, School of Biomedical Engineering & Imaging Sciences, King's College London, London, United Kingdom
Synopsis
One of the main problems at UHF resonance frequencies is the significant spatial variation in radiofrequency electromagnetic fields. Mitigating this problem has been one of the goals of the parallel transmission MRI, but it causes greater local SAR variability, which has led to more rigorous safety restrictions. We have used MARIE with an MRGF implementation to study position sensitivity of SAR estimation at 7T by performing multiple simulations in which the coil is moved with respect to the head. We observe higher positional variability in rotational perturbations than in translational ones with solutions obtained in 7.5 min per body-coil configuration.
Introduction
Higher magnetic field strengths lead to better quality in MR images; hence, the growing interest to work in the domain of ultra-high field (UHF) MRI. However, one of the main problems at UHF resonance frequencies is the significant spatial variation in radiofrequency (RF) electromagnetic (EM) fields. Mitigating this problem has been one of the goals of the emerging field of parallel transmission (pTx) MRI, where instead of having a single channel, multiple independently driven channels are used [1]. A particular problem in this area, however, is quantification of potential heating effects generated by RF electric fields. In addition, pTx technology causes greater local SAR variability, which has led to more rigorous safety restrictions, thus limiting achieving full potential of pTx-enabled UHF MRI [2]. Furthermore, patient motion can cause additional problems on SAR variability and is an important issue to assess. A few studies have analysed how SAR varies with body position [3,4], but these can be limited by requiring multiple highly time-consuming EM simulations. Recently integral equation method for RF simulation in MRI (MARIE) has been proposed. This method can operate with pre-computed “magnetic resonance Green’s functions” (MRGFs) [5] – essentially excitation domain basis functions – that can be used to very quickly evaluate EM fields for any given coil design for the same body model. We have, consequently, used MARIE with an MRGF implementation to study position sensitivity of SAR estimation at 7T by performing multiple simulations in which the coil is moved with respect to the head.Methods
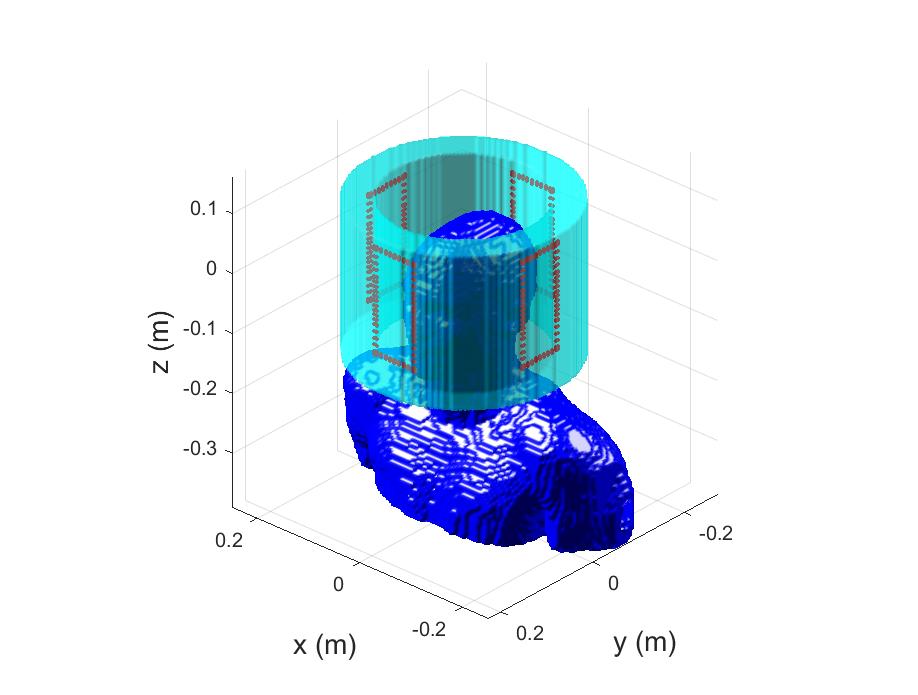
MRGFs were computed for realistic human body model DUKE from the Virtual Model family on a 4mm grid. The ‘excitation domain’ over which MRGFs were computed is shown in Figure 1; any RF coil fitting in this domain could then be simulated. As an example, a 4-channel array of rectangular loops was constructed, each with 5 capacitors and one driving port. A circuit co-simulation (CCS) routine [6] was used to determine capacitor values to decouple the coils and tune and match to 298MHz (7T). Subsequently, this coil model was perturbed randomly assigning across all 6 degrees of freedom: 20 random rotations around x,y,z axis per each of the ranges [-9,9]deg, [-9,9]deg, [-20,20]deg, respectively, and 10 random translations in [-15,15] mm range in each of the x, y, z directions (FIG1), bringing the total perturbation count to 90. For every coil perturbation, ‘Q-matrices’ were computed. Worst-case SAR (wcSAR) was then computed for each voxel/coil position by computing largest eigenvalue of Q. These values were then 10-gram averaged. SAR for CP mode excitation was also computed for each spatial perturbation of the coil. All computations were carried out in MATLAB on a Linux server machine with a Dual Intel Xeon-E5 2687W 3.1 GHz CPU and Nvidia GPU card with 12 GB allocated memory.Results
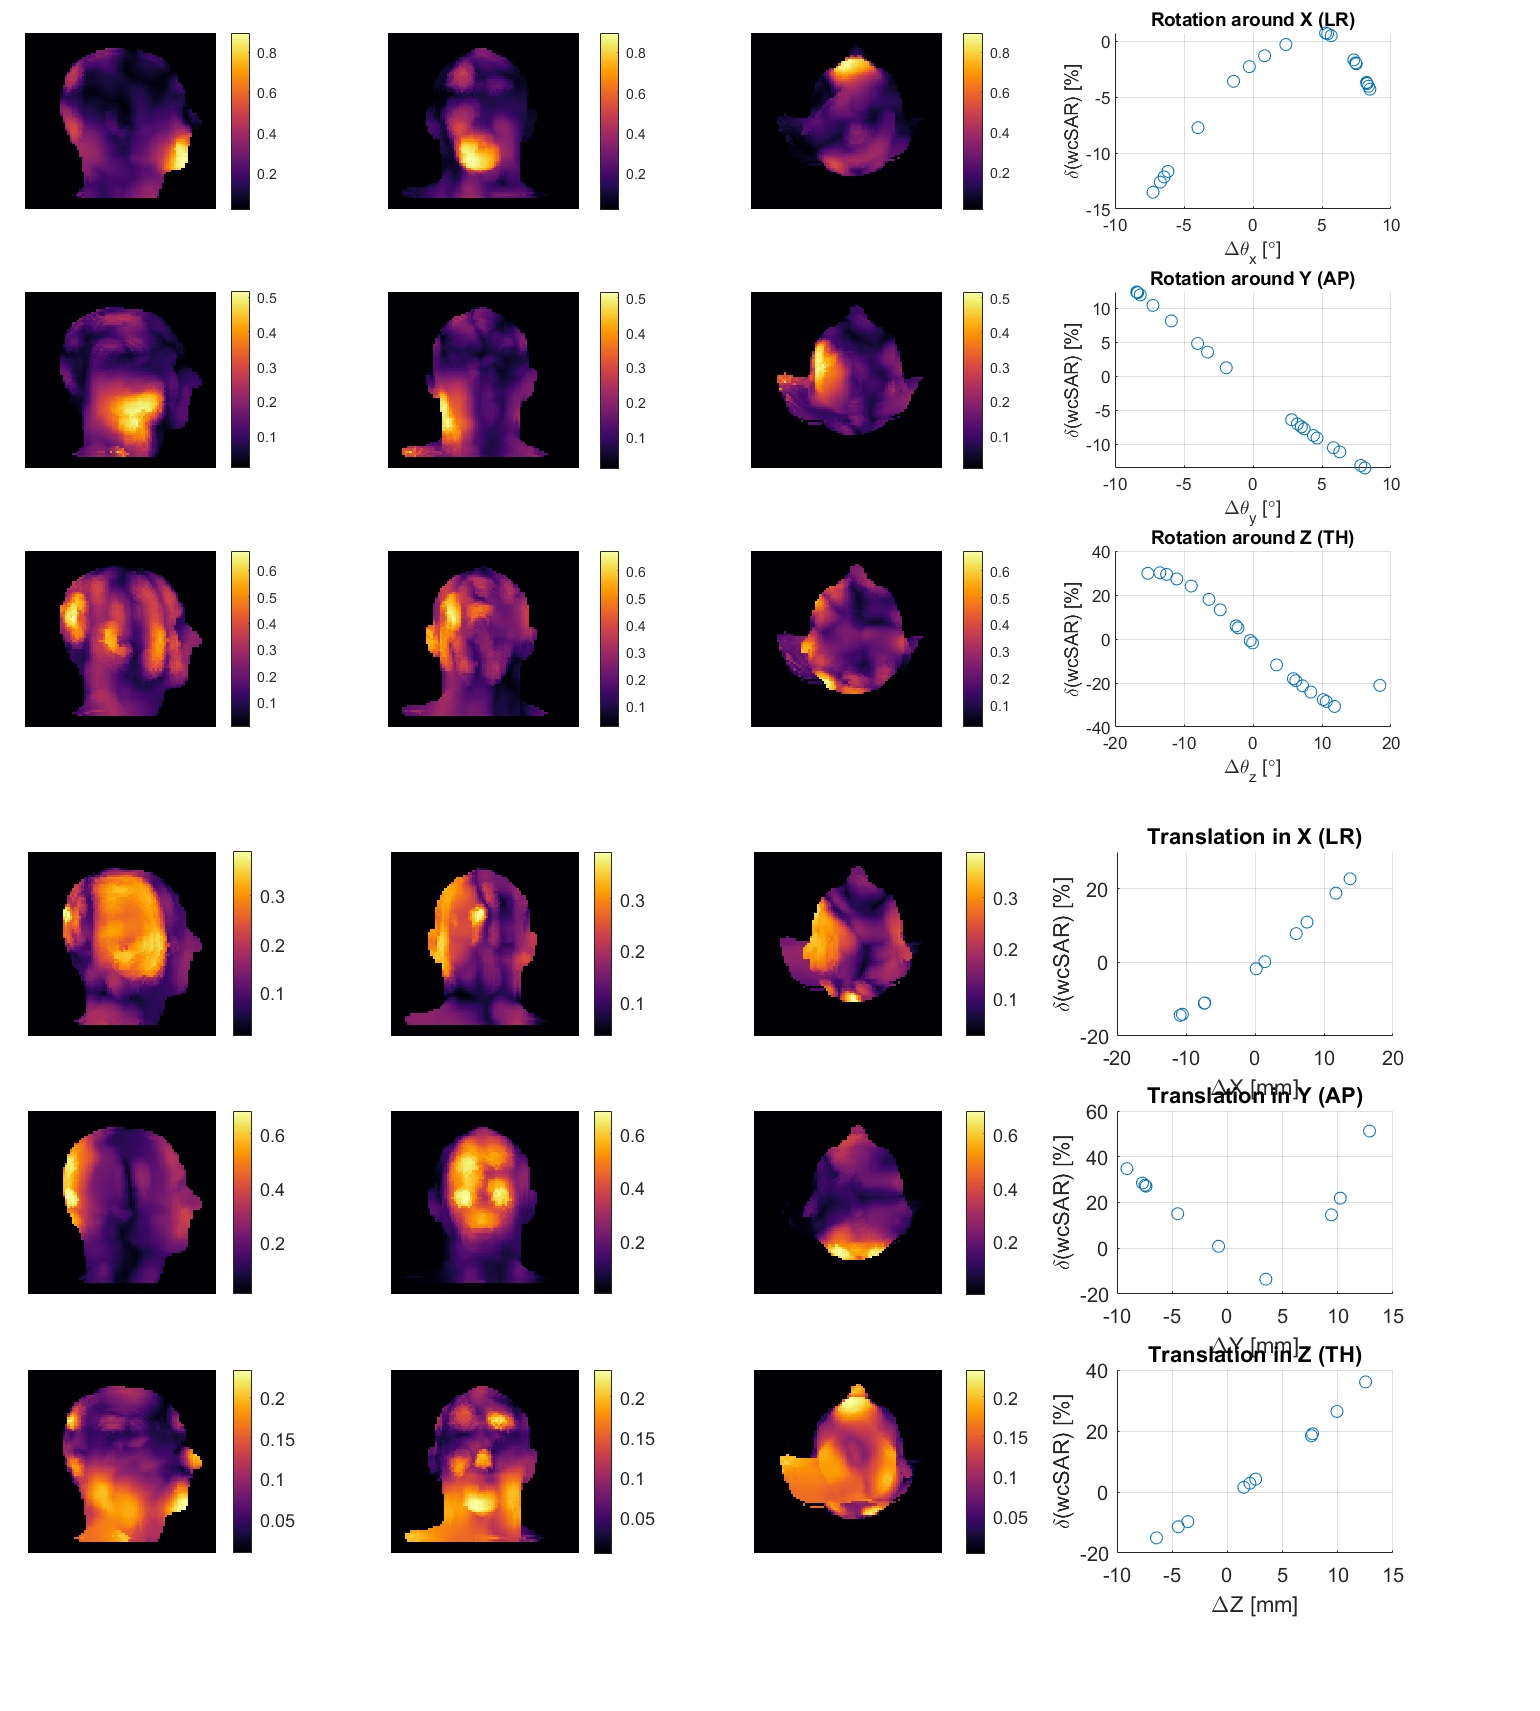
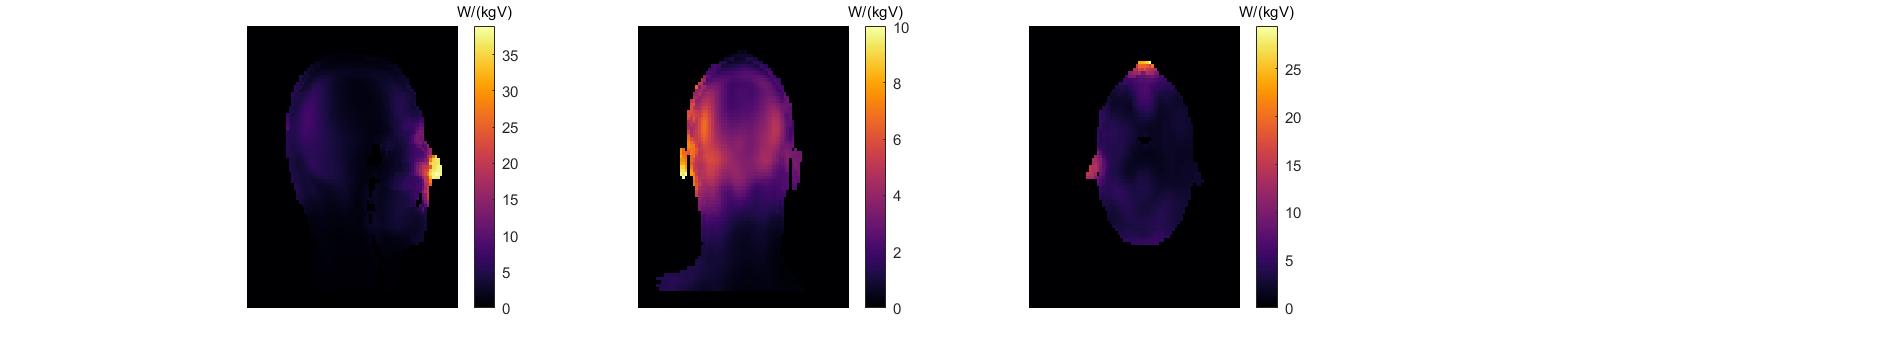
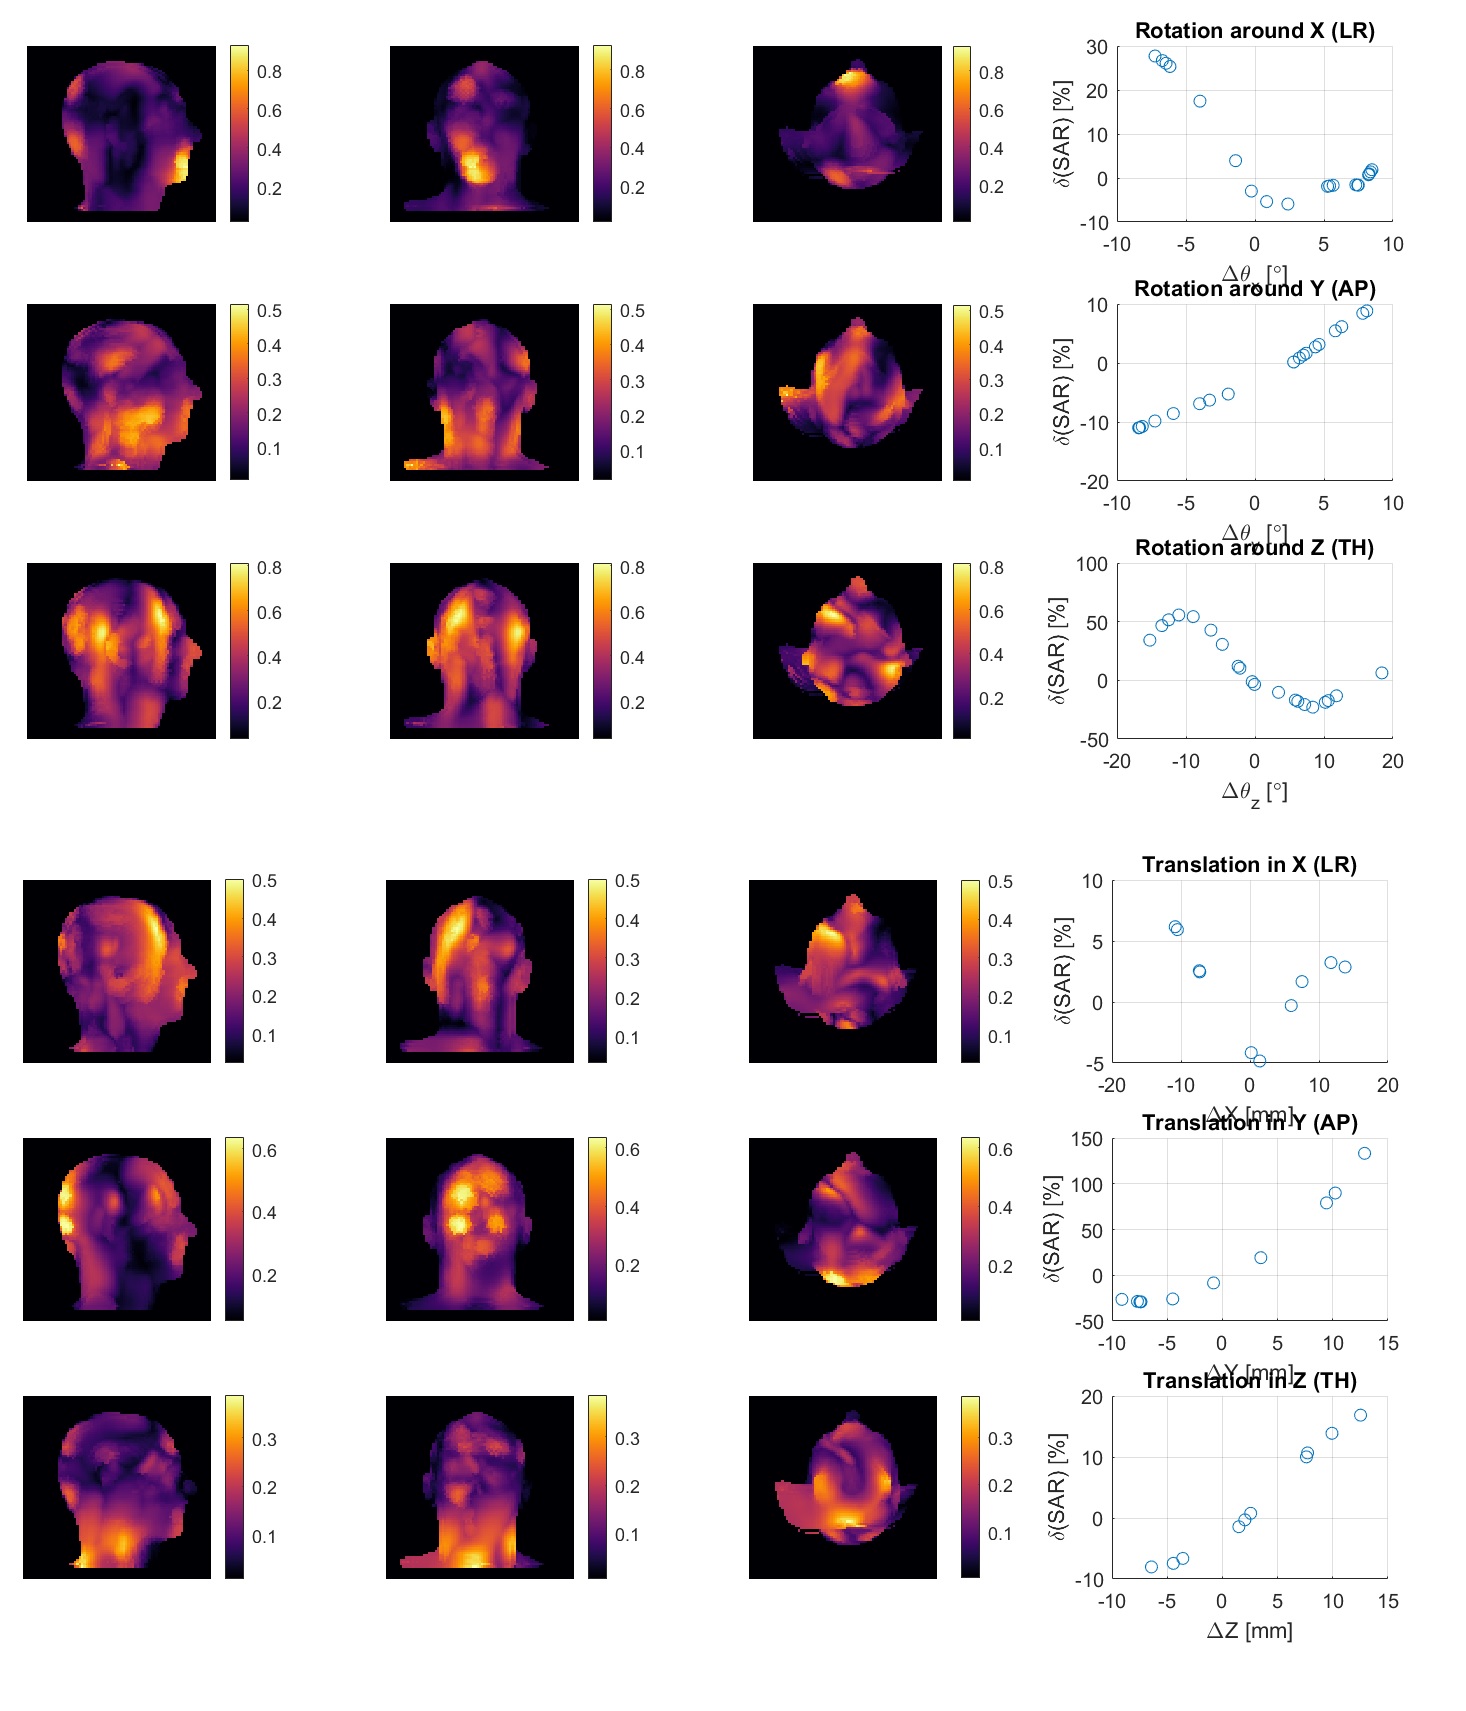
The solutions computation time per each coil perturbation is 7.5 min, bringing the whole simulation time for all 90 perturbations to 11.25h. Figures 2 and 4 respectively show worst-case SAR and CP-mode SAR highest variability maps in body volume across x,y,z directions (columns 1-3) for different perturbation types (rows 1-6). Additionally, they demonstrate percentage of worst-case SAR deviation with respect to their respective unperturbed solutions (column 4 in Figures 2 and 4). SAR variability maps are shown to reflect the perturbation types by demonstrating local maxima in the direction of perturbation. To illustrate, translation in Y (anterior-posterior) direction in both worst-case-SAR and CP-mode-SAR is shown to lead to highest variability at the back of the head across all 3 slices, whereby the variability can reach up to 60% in both SAR types. Furthermore, it is observed that the rotational perturbations cause higher variability than the translational ones, producing up to 80% local variability in both worst-case-SAR and CP-mode-SAR. The results in columns 4 of Figures 2 and 4 also show larger SAR deviation for larger perturbation regardless of the perturbation or SAR type, with both SAR types mostly sensitive to Y translation, whereby maximum deviation of 52% is observed for worst-case-SAR and even higher than 100% in the case of CP-mode-SAR. Figure 3 finally shows the actual worst-case SAR distribution within a slice inside the body.Discussion
The results of our study demonstrate plausible SAR variability in space for different types of perturbation and SAR deviation with respect to the non-perturbed solution for 2 different SAR metrics. This study also shows the ability to estimate SAR for different body-coil configurations in 7.5 minutes/configuration, which is more than 2-fold faster than the current state-of-the-art finite difference time domain (FDTD) methods. Additionally, a big drawback of the current SAR simulation tools is their lack of the uncertainty estimation. SAR variability is clear source of error and this work is moving towards a statistical approach of analysing a very large number of small perturbations.Acknowledgements
This work is funded by the King’s College London & Imperial College London EPSRC Centre for Doctoral Training in Medical Imaging (EP/L015226/1). This work was supported by the Wellcome EPSRC Centre for Medical Engineering at Kings College London (WT 203148/Z/16/Z) and by the National Institute for Health Research (NIHR) Biomedical Research Centre based at Guy’s and St Thomas’ NHS Foundation Trust and King’s College London. The views expressed are those of the authors and not necessarily those of the NHS, the NIHR or the Department of Health.
We kindly thank Dr. Georgy Guryev and the RLE Computational group at MIT for their providing us with the MRGF-generation code used within MARIE.
References
[1] Destruel, A., et al. (2019). A numerical and experimental study of RF shimming in the presence of hip prostheses using adaptive SAR at 3T. Magnetic Resonance in Medicine, 81(6), 3826-3839. [2] Kozlov M, Turner R. Fast MRI coil analysis based on 3‐D electromagnetic and RF circuit co‐simulation. J Magn Reson. 2009;200:147–152. [3] Shao Y, Zeng P, Wang S. Statistical simulation of SAR variability with geometric and tissue property changes by using the unscented transform. Magn Reson Med 2015;73(6):2357-2362. [4] Murbach M, Zastrow E, Kuster N. Virtual Population Based Correlations between B1+, Whole-Body and Local SAR. 2018; Paris, France. p4391. [5] Villena, J.F., Polimeridis, A.G., Eryaman, Y., Adalsteinsson, E., Wald, L.L., White, J.K., Luca Daniel, D. (2016). Fast Electromagnetic Analysis of MRI Transmit RF Coils Based on Accelerated Integral Equation Methods. IEEE Transactions on Biomedical Engineering, 63(11), 2250-2261. [6] Beqiri, A., Hand, J. W., Hajnal, J. V., & Malik, S. J. (2015). Comparison between simulated decoupling regimes for specific absorption rate prediction in parallel transmit MRI. Magnetic Resonance in Medicine, 74(5), 1423- 1434.Figures