4249
A novel gradient pattern for pre-emphasis1SQITS/NICHD, National Institute of Health, Bethesda, MD, United States, 2University of Florida, Gainesville, FL, United States
Synopsis
A new gradient pattern is introduced for performing pre-emphasis by uniform bandlimited excitation of eddy current and mechanical eigenmodes of the gradient system. The presented pattern is shown to be more effective in eliciting the gradient response than the energy equivalent trapezoidal pulse. This approach may allow the design of gradient waveforms that reduce artifacts in PFG experiments, e.g. measuring very slow diffusion and flow.
Introduction
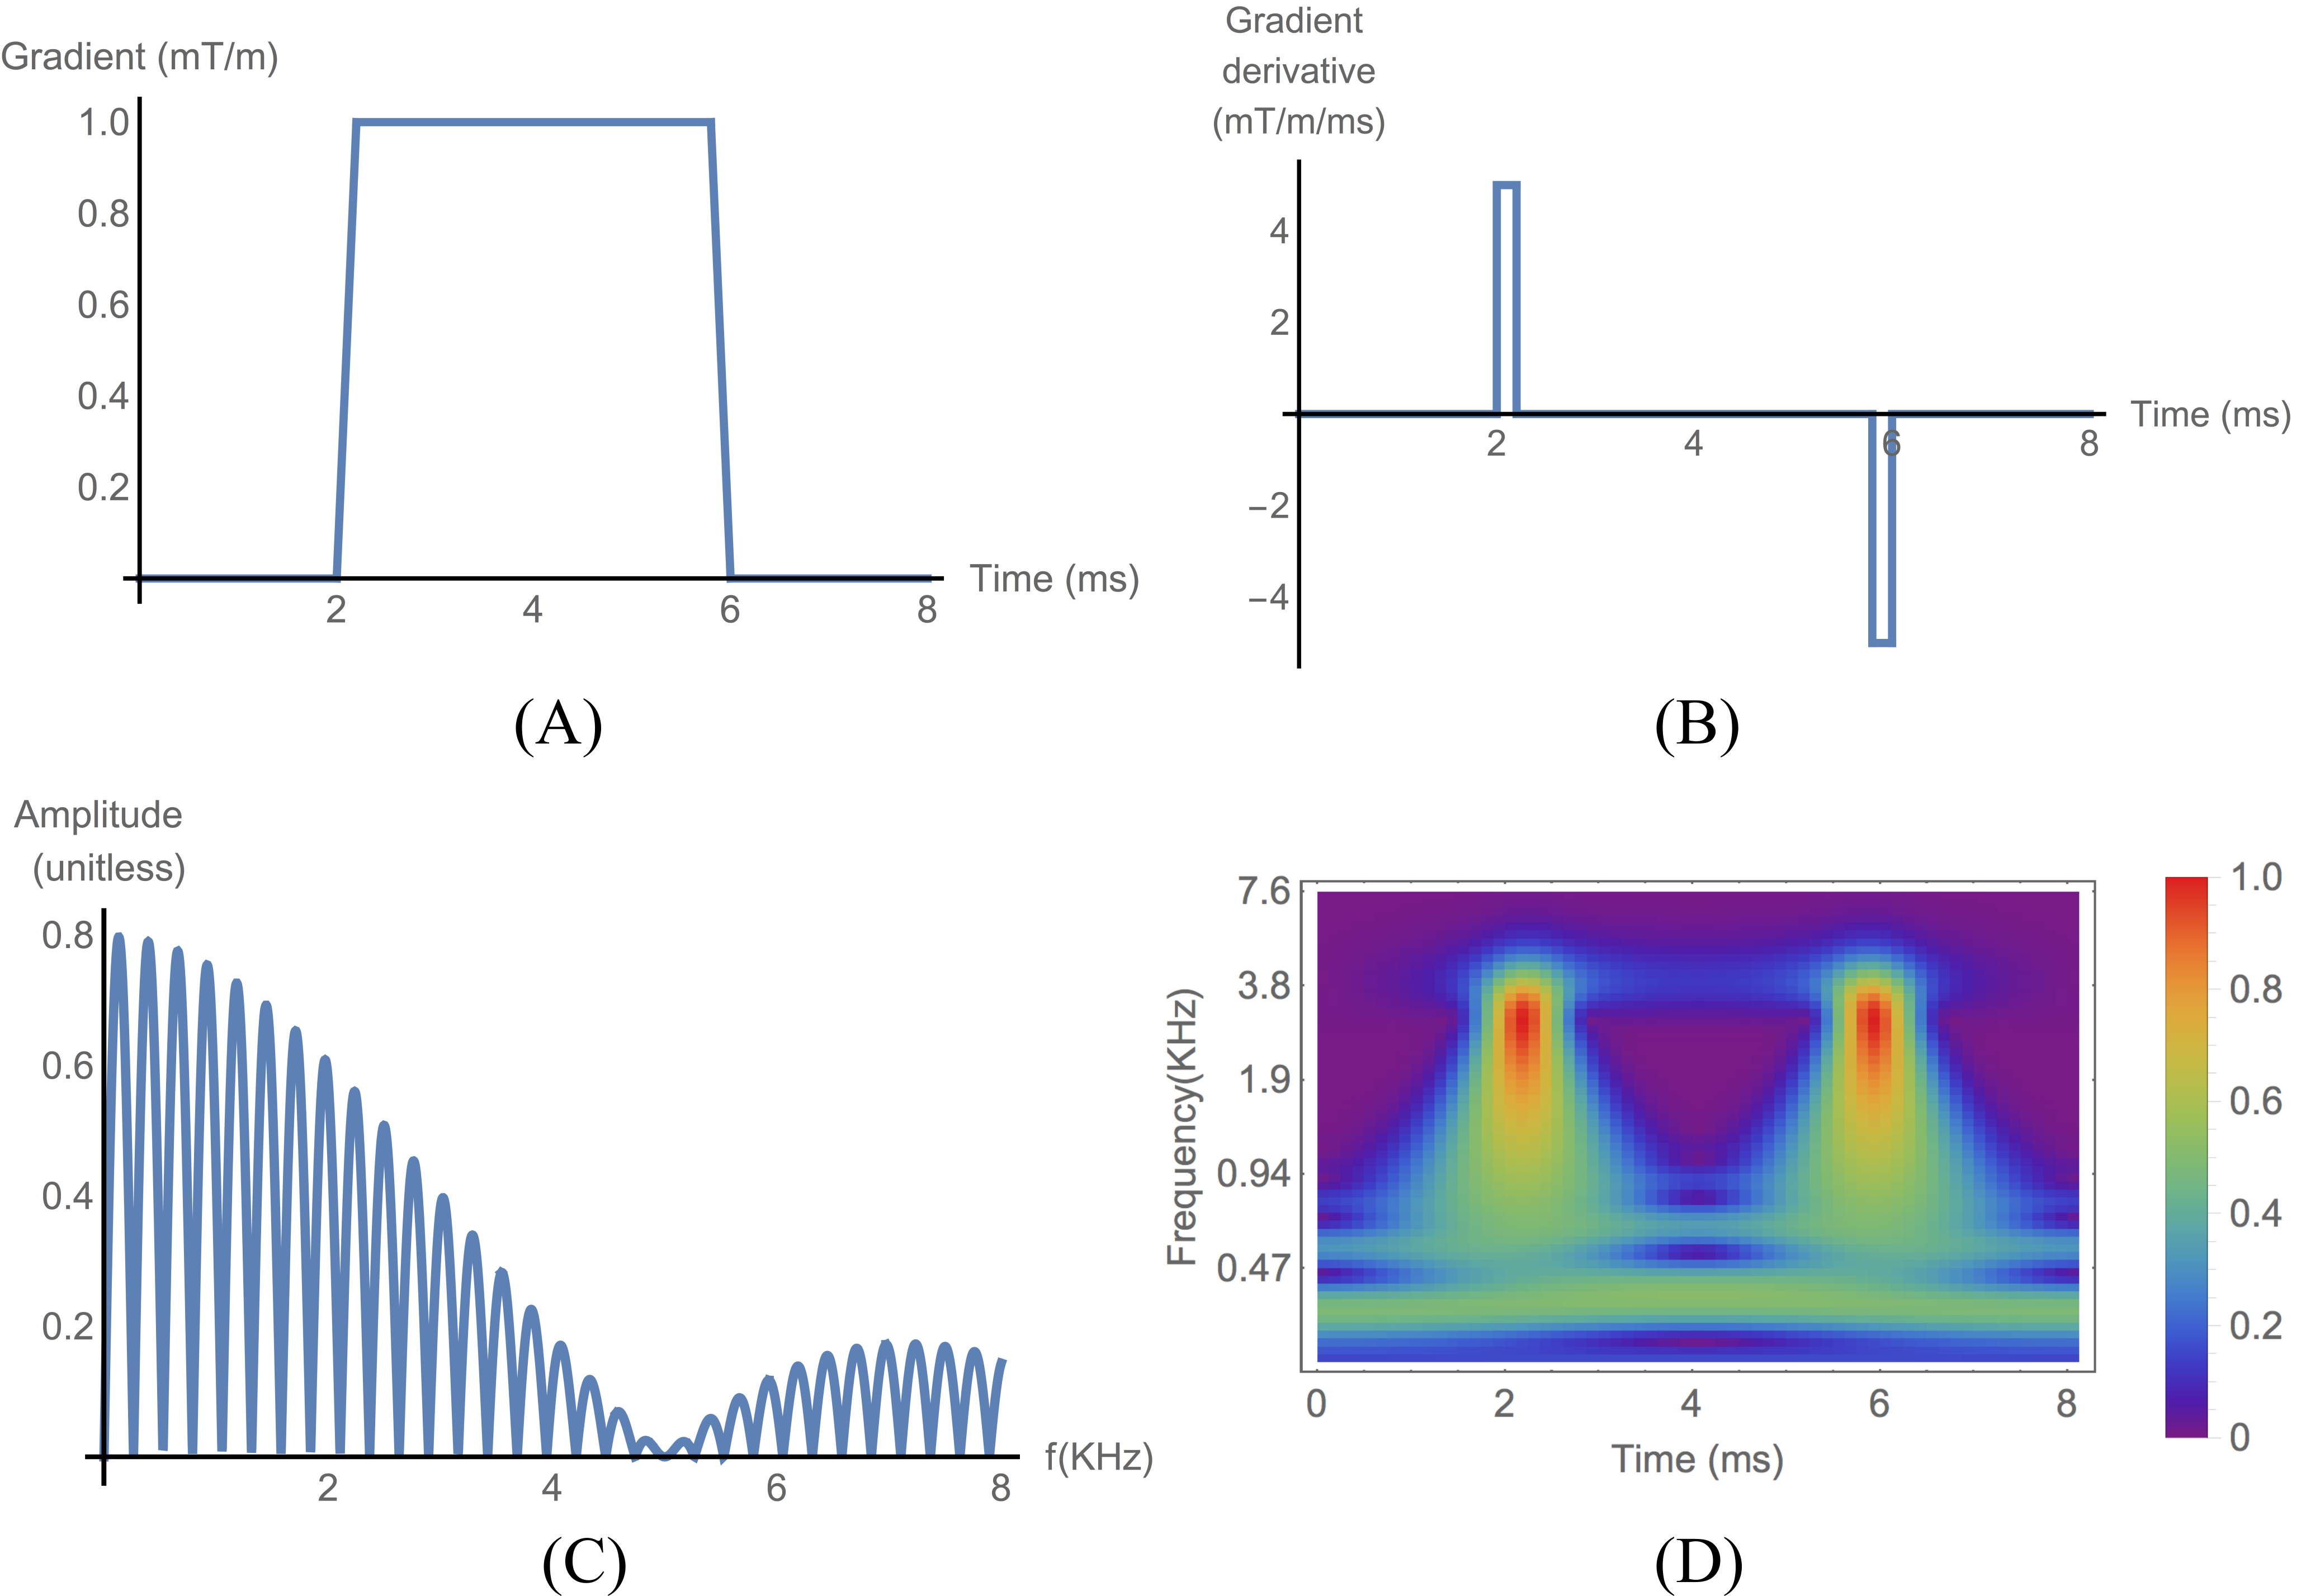
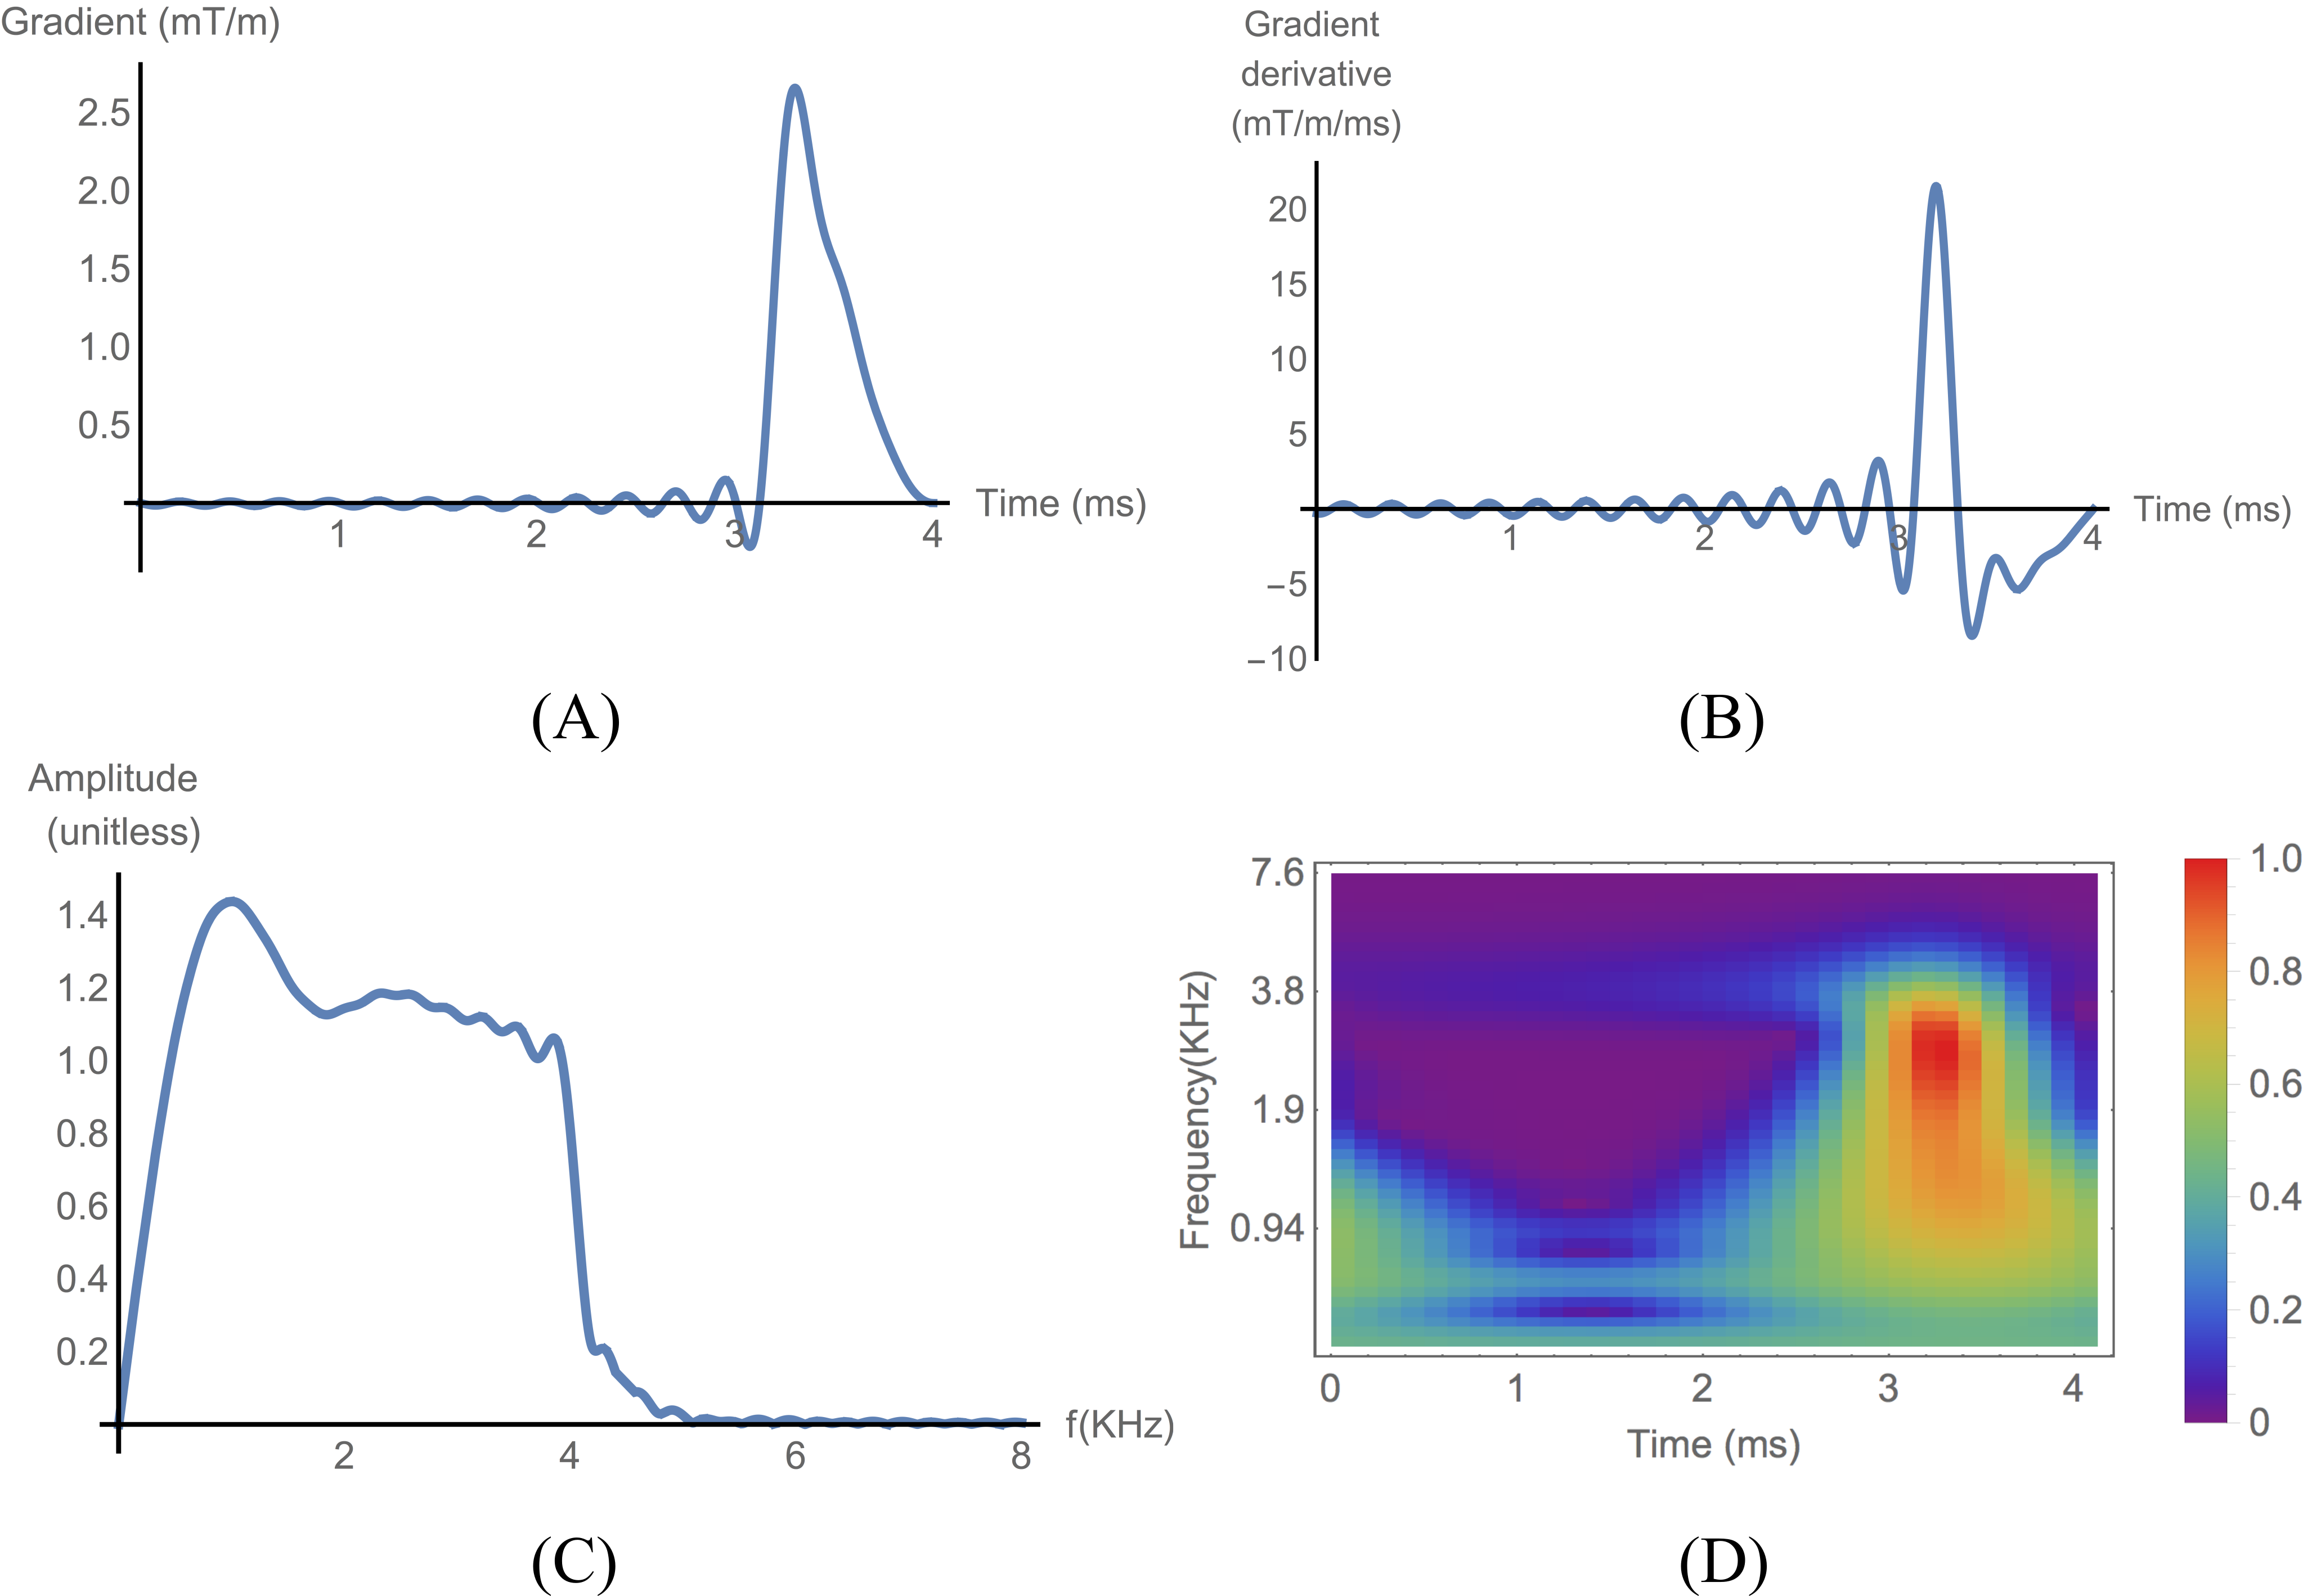
For pulsed field gradient experiments, characterizing gradient switching is important for correcting errors in the gradient moments caused by eddy currents and mechanical oscillations. Errors in gradient moments result in image distortions in k-space and inaccuracies in q-space imaging, especially while measuring both very low diffusivities and flow velocities. Current methods to improve gradient fidelity typically involve mapping the time dependent magnetic field generated following a trapezoidal or triangular test gradient pulse. Assuming the gradient system is linear and time invariant (LTI), the measured field is then modeled using a decaying multi-exponential function to obtain the pre-emphasis parameters used to overdrive the gradient amplifier [1].It is well known that accurate characterization of an LTI system requires the input function (i.e. time derivative of a test gradient pulse) mimic that of an impulse function which excites all the frequencies (i.e. gradient eigenmodes) uniformly followed by immediate reception. The trapezoidal or triangular pulse currently used in literature has a non-uniform sinc type excitation [see Figure 1], adding bias in the measurement. We introduce a new test gradient pattern, called the Tukey windowed shifted sine integral (twSSI) pulse [see Figure 2], whose derivative is a shifted sinc function, which has a bandlimited uniform spectrum like the impulse function with an adjustable excitation time to enable reception immediately after excitation.
Methods
MRI measurements used a 330 mm inner diameter (ID) Oxford 4.7 T horizontal bore magnet and Agilent VNMRS imaging console, controlled by VnmrJ3.1A software (Agilent Technologies, Santa Clara, CA), with RRI BFG-200/115-S14 gradients (Resonance Research, Billerica, MA), which has 80 mm diameter linear spherical volume, driven by IECO GPA-400-750 3-axis gradient amplifiers (International Electric Co., Helsinki, Finland) and transmit-receive 88 mm ID custom quadrature birdcage RF coil. Measurements were performed after zeroing gradient pre-emphasis settings.Measurements were performed on 0.6% hydrogel (w/v), in a 66 mm ID round bottom flask, doped with 27 mM copper sulfate pentahydrate to reduce the T1/T2 relaxation times. A 3D multi-echo gradient echo imaging sequence was modified by adding the twSSI pulse with a variable delay time before RF excitation to measure the residual magnetic field after the pulse. The gradient response was measured using TR = 250 ms, TE = 0.3 ms, echo spacing = 0.5 ms and 24 echoes with a twSSI gradient pulse duration of 4 ms, excitation bandwidth of 4 kHz and peak gradient amplitudes of 480, 300, 240 mT/m on x, y and z gradients, respectively, chosen to prevent phase wrapping. The delay between the twSSI pulse and imaging sequence ranged from 0.05-0.45 ms in steps of 0.1 ms to obtain a field sampling frequency of 10 kHz for a total duration of 12.27 ms. The field-of-view was 66 mm x 66 mm x 66 mm to encompass the whole spherical volume, in a matrix of 32 x 32 x 32. The measurement was repeated twice for assessing the temporal stability and reproducibility of the pre-emphasis parameters. For comparison, the gradient response was measured using a trapezoidal pulse of identical duration with the peak gradient strength adjusted such that the root-mean-square current was the same as the twSSI pulse resulting in 200, 125, 100 mT/m with ramp times equal to 36, 24, 20 μs on x, y, z gradients, respectively. This prevents temperature changes in the gradient coil from altering the response [2].
The 3D time varying residual magnetic field map for each gradient axis was obtained from the phase resulting from complex dividing the four Hadamard encoded images (Table 24.1 in [3]) acquired at each delay time. The resulting magnetic field was fit to a trilinear equation in space to account for the constant and gradient fields generated after the test pulse whose strengths were then fit to a decaying oscillatory multi-exponential model in time to obtain the eddy current amplitudes/time constants and mechanical response.
Results & Discussion
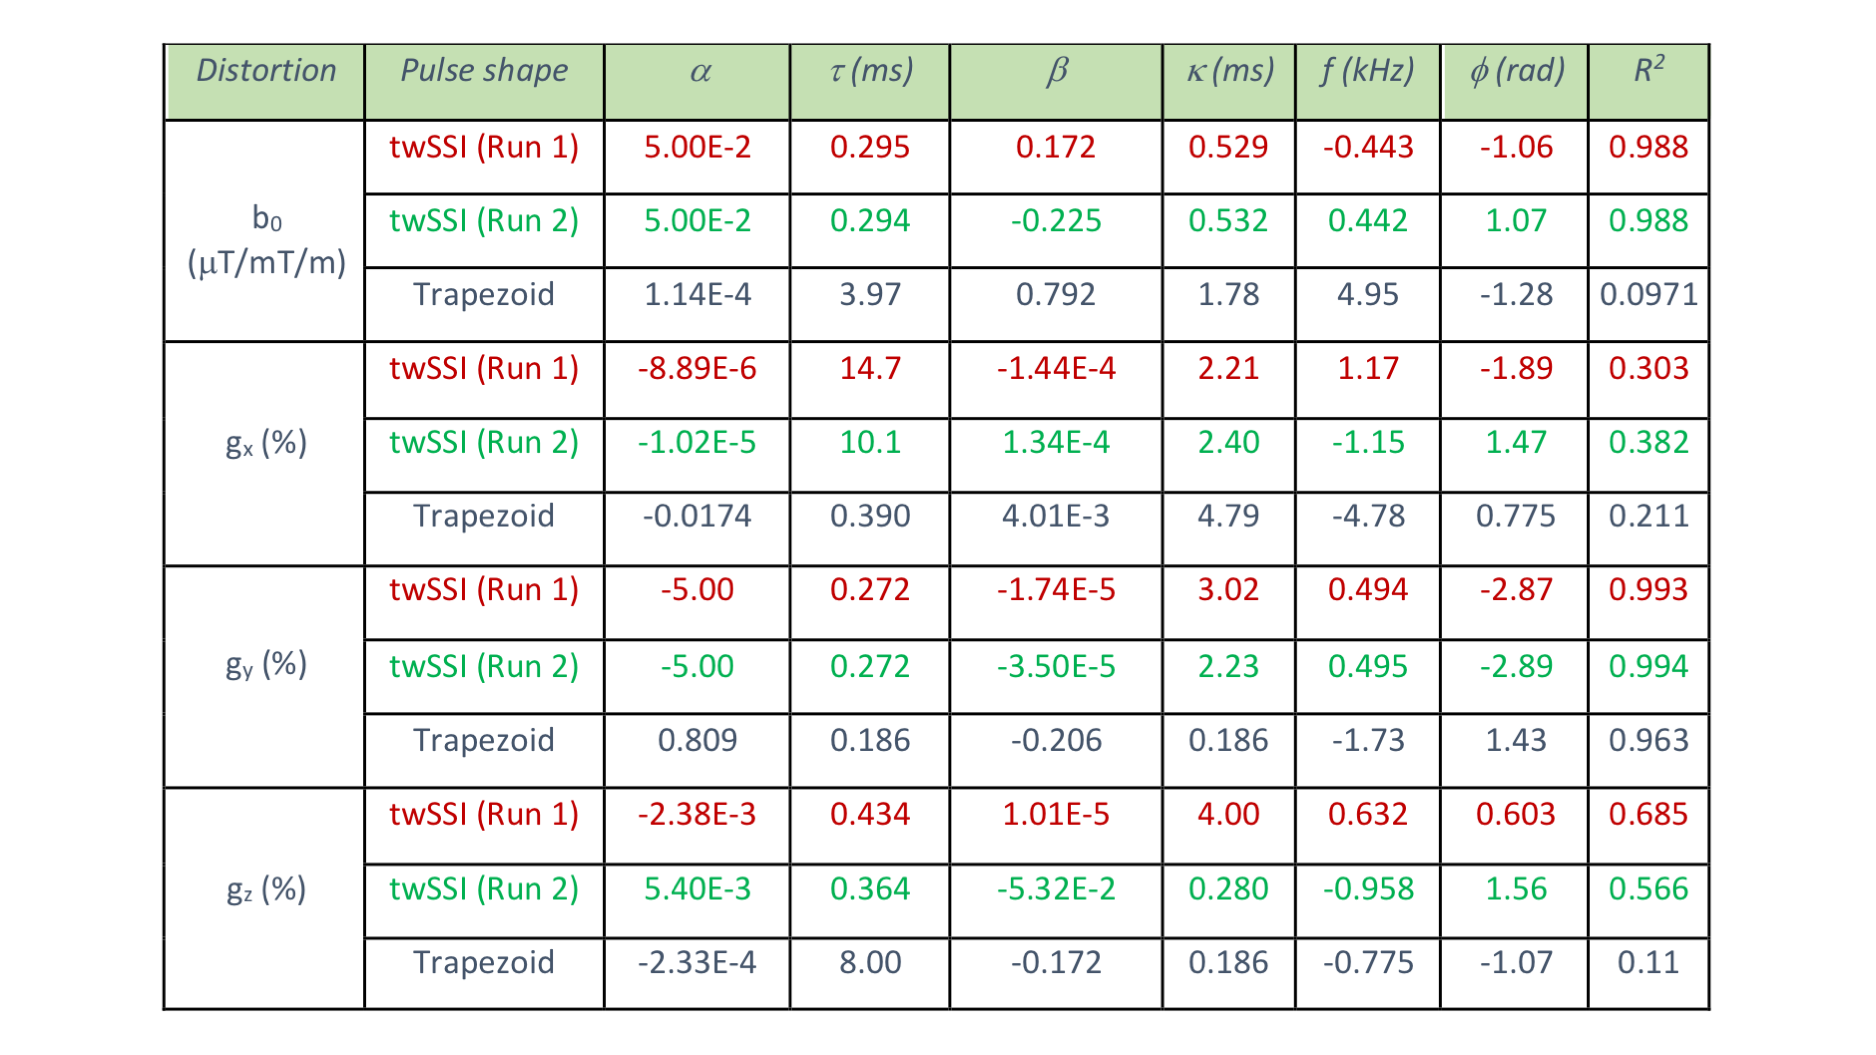
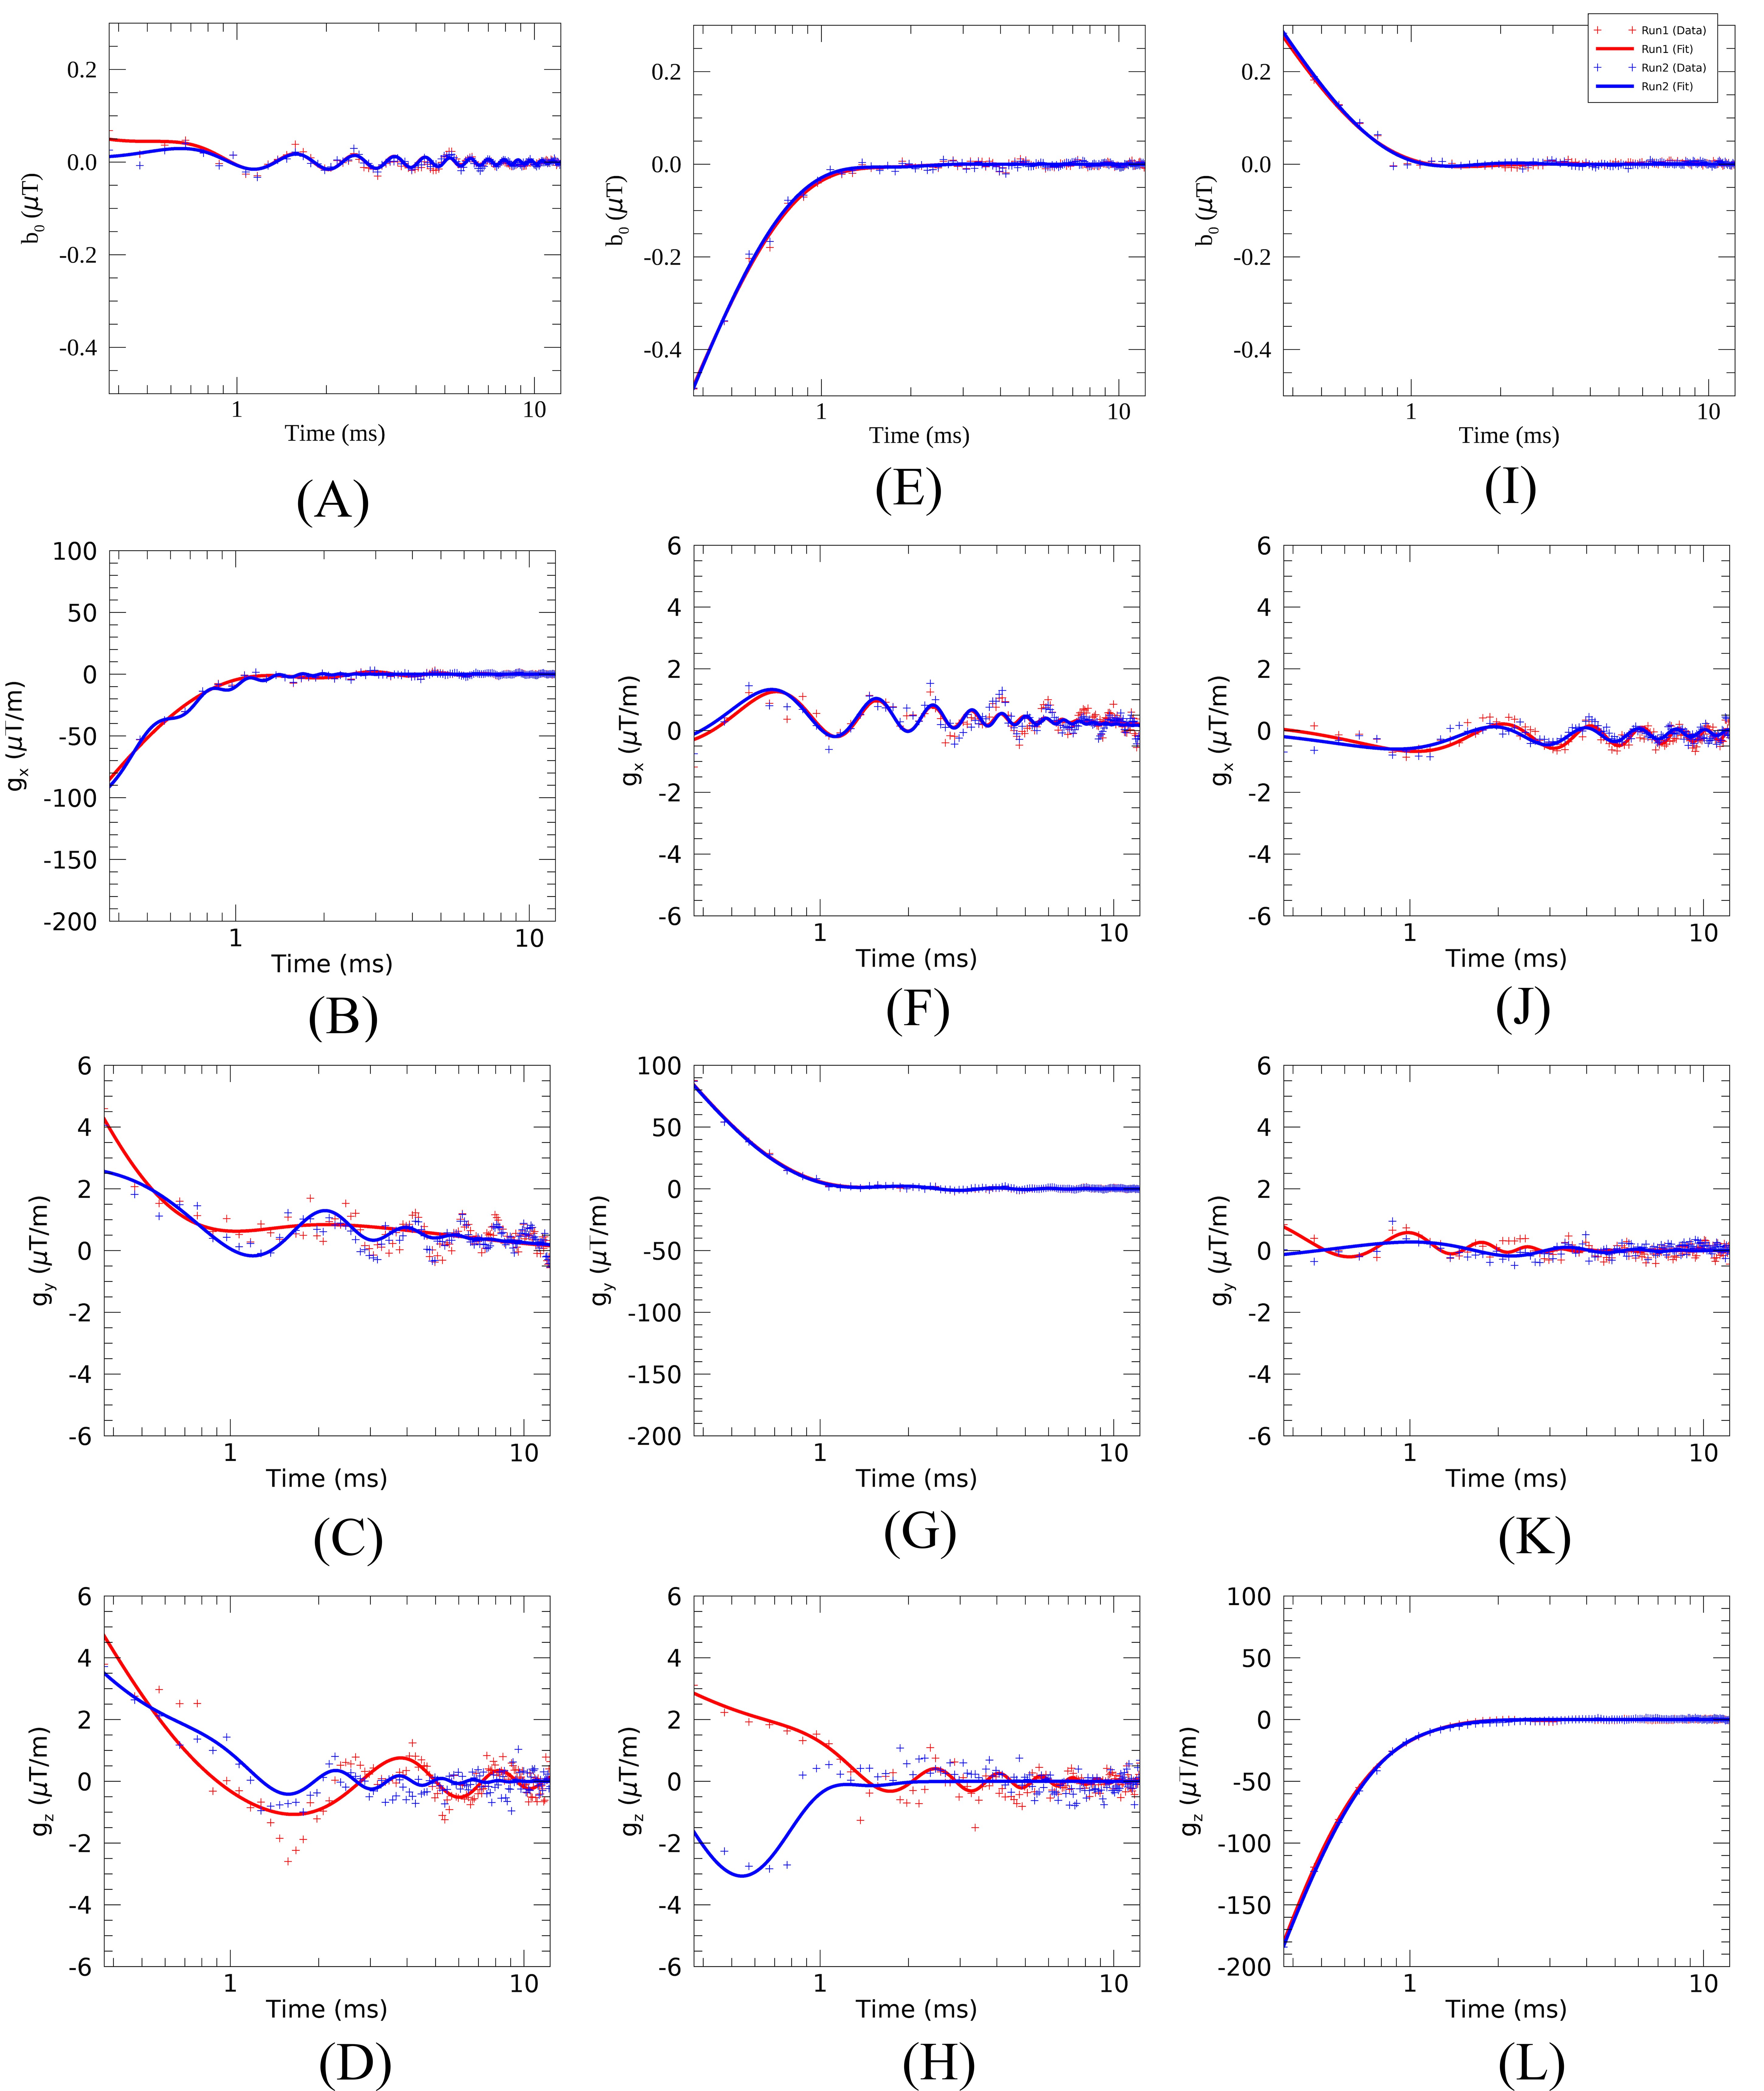
In Figure 3, the modeled time-dependence of the fields generated after the twSSI pulse is shown for the two repeated measurements showing temporal stability of the gradient system. The results of the model fit for the y-gradient obtained using twSSI and trapezoidal pulses are shown in Table 1. The results show that the twSSI pulse was able to elicit both strong direct and weak cross terms in the eddy currents along with the mechanical oscillations as exhibited by high goodness of fit measure, R2, compared to the trapezoidal pulse. The similarity of model fit across both the repetitions shows reproducibility of pre-emphasis parameters. For the tested gradient system, the direct gradient eddy current amplitude was orders of magnitude higher compared to the mechanical oscillations. However, the mechanical oscillations lasted longer than the eddy currents.Conclusion
We have presented a method to characterize gradient switching by uniform bandlimited excitation of gradient eigenmodes using a twSSI gradient pulse pattern. This approach may allow the design of gradient excitation patterns that reduce eddy current artifacts in PFG experiments, e.g. measuring very slow diffusion and flow. After applying optimal pre-emphasis to the gradient amplifier control, measurement of the remaining residual eddy current response will allow further improvements through the design of the pulsed gradient waveform to overcome these residual fields.Acknowledgements
A portion of this work was performed in the Advanced MRI/S (AMRIS) Facility at the McKnight Brain Institute of the University of Florida, which is part of the National High Magnetic Field Laboratory (supported by National Science Foundation Cooperative Agreement DMR-1157490, the State of Florida, and the U.S. Department of Energy). In addition, this work is supported in part by the NIH/NCATS Clinical and Translational Science Award UL1 TR000064.References
[1] M. A. Bernstein, K. F. King, and X. J. Zhou, Handbook of MRI Pulse Sequences. Elsevier, 2004.
[2] J. Busch, S. J. Vannesjo, C. Barmet, K. P. Pruessmann, and S. Kozerke, “Analysis of temperature dependence of background phase errors in phase-contrast cardiovascular magnetic resonance,” J. Cardiovasc. Magn. Reson., vol. 16, no. 1, p. 97, Dec. 2014.
[3] R. W. Brown, Y. N. Cheng, and E. M. Haacke, Magnetic Resonance Imaging : Physical Principles and Sequence Design. Chichester, UK: John Wiley & Sons Ltd, 2014.
Figures