4232
An Integrated RF-receive/B0-shim Array Coil Improves whole-brain MR Spectroscopic Imaging at 7T1Athinoula A. Martinos Center for Biomedical Imaging, Department of Radiology, Massachusetts General Hospital, Harvard Medical School, Boston, MA, United States, 2Department of Diagnostic Imaging, Akershus University Hospital, Lørenskog, Norway, 3Siemens Medical Solutions, Charleston, MA, United States
Synopsis
An advanced local shimming technique can substantially improve magnetic resonance spectroscopic imaging (MRSI) which suffers from the inevitable local B0 inhomogeneities, particularly at ultra-high field. We evaluated the performance on an ultra-high field 7T MRI system of a custom-designed 32-channel head coil that with both RF-receive and DC-shim capability. Each coil loop simultaneously and independently runs AC and DC currents for RF-receive and B0-shimming. We examined the multi-coil shimming performance on five healthy volunteers using MRSI. The combined setup of DC-enabled local shimming and highly-efficient spectroscopic acquisition resulted in a noticeable improvement in the quality of spatial metabolic maps.
Magnetic field (B0) inhomogeneity introduces noise/artifacts in brain magnetic resonance spectroscopic imaging (MRSI) which grow significantly worse at ultra-high fields. Most scanners are equipped with only second-order spherical harmonics (2SH) shim coils which cannot homogenize the magnetic field over the whole-brain within an acceptable range for MRSI performance. Multi-coil shim arrays provide additional degrees of freedom to shape the B0 field especially in brain regions close to air-tissue interfaces that are the most affected by susceptibility anisotropy. Here we demonstrate that an integrated 32-channel RF-receive/B0-shim array ( “AC/DC” coil) improves the quality of whole-brain MRSI at 7T ultra-high field.
METHODS
Data were acquired with a 7T Magnetom MRI system (Siemens Healthcare, Erlangen, Germany). We used recently-developed multi-coil dynamic shimming hardware consisting of a 32-channel AC/DC coil array patterned on a close-fitting 3D-printed helmet with shim currents driven by a bank of digitally-programmable low-voltage amplifiers that allow very fast switching in less than 1ms between different B0 field patterns (1,2).
3D MRSI data were measured twice in five subjects with an IRB approved protocol using two different shimming: 1) the standard 2SH shimming provided by the scanner manufacturer, and ) the AC/DC shimming superimposed on the 2SH shimming.
The whole-brain 3D MRSI sequence consisted of: 1) adiabatic spin echo (ASE (3)) with excitation pulse BIR-4 of ms/1kHz and refocusing pulses GOIA-W(16,4) of 5ms/20kHz (duration/bandwidth); 2) fat suppression with adiabatic inversion recovery using an asymmetric HGSB pulse (4) of 30ms and 270ms delay; 3) four-pulse WET module (5) optimized for water suppression at 7T; 4) stack of novel spiral out-in (6) self-refocussing trajectories; 5) volumetric EPI navigator which was interleaved each TR for motion correction and shim update (7).
The following parameters were used for acquiring MRSI: TR = 1800 ms; TE = 78 ms; FOV of 220×220×80 mm; matrix of 44×44×8; nominal voxel size 5x5x10 mm; spectral window 2700 Hz; 24 angular interleaves, 2 temporal interleaves; 1 average; acquisition time = 10:12 min:s. The ASE excited a brain slab of 60 mm-thickness that contained six consecutive phase-encoded MRSI slices of 10 mm. For all MRSI acquisitions, the specific absorption rate (SAR) was between 50%–85% of the maximum SAR limit as monitored by the MRI system.
In addition to metabolite data, water unsuppressed data (matrix of 22×22×8; acquisition time = 4:19 min:s) were acquired for coil combination and phasing of metabolite spectra. The raw MRSI data were reconstructed and analyzed with an in-house processing package using Matlab R2018b (MathWorks, Natick, MA, USA), Bash V4.2.25 (Free Software Foundation, Boston, MA, USA), MINC tools V2.0 (McConnell Brain Imaging Center, Montreal, QC, Canada), and spectra fitting by LCModel V6.3 (LCMODEL Inc, Oakville, Ontario, Canada, (8)). Non-Cartesian data were reconstructed using a discrete Fourier transform, followed by removal of residual lipid signal with L1 penalty (9) and spatial Hamming filtering.
MR spectra were fitted with LCModel between 1.8 and 4.2 ppm, with a basis-set of 17 brain metabolites. Linewidth less than 0.1ppm and Cramer-Rao lower bounds (CRLB) less than 20% was determined for the goodness of fit of the metabolites peaks.
RESULTS
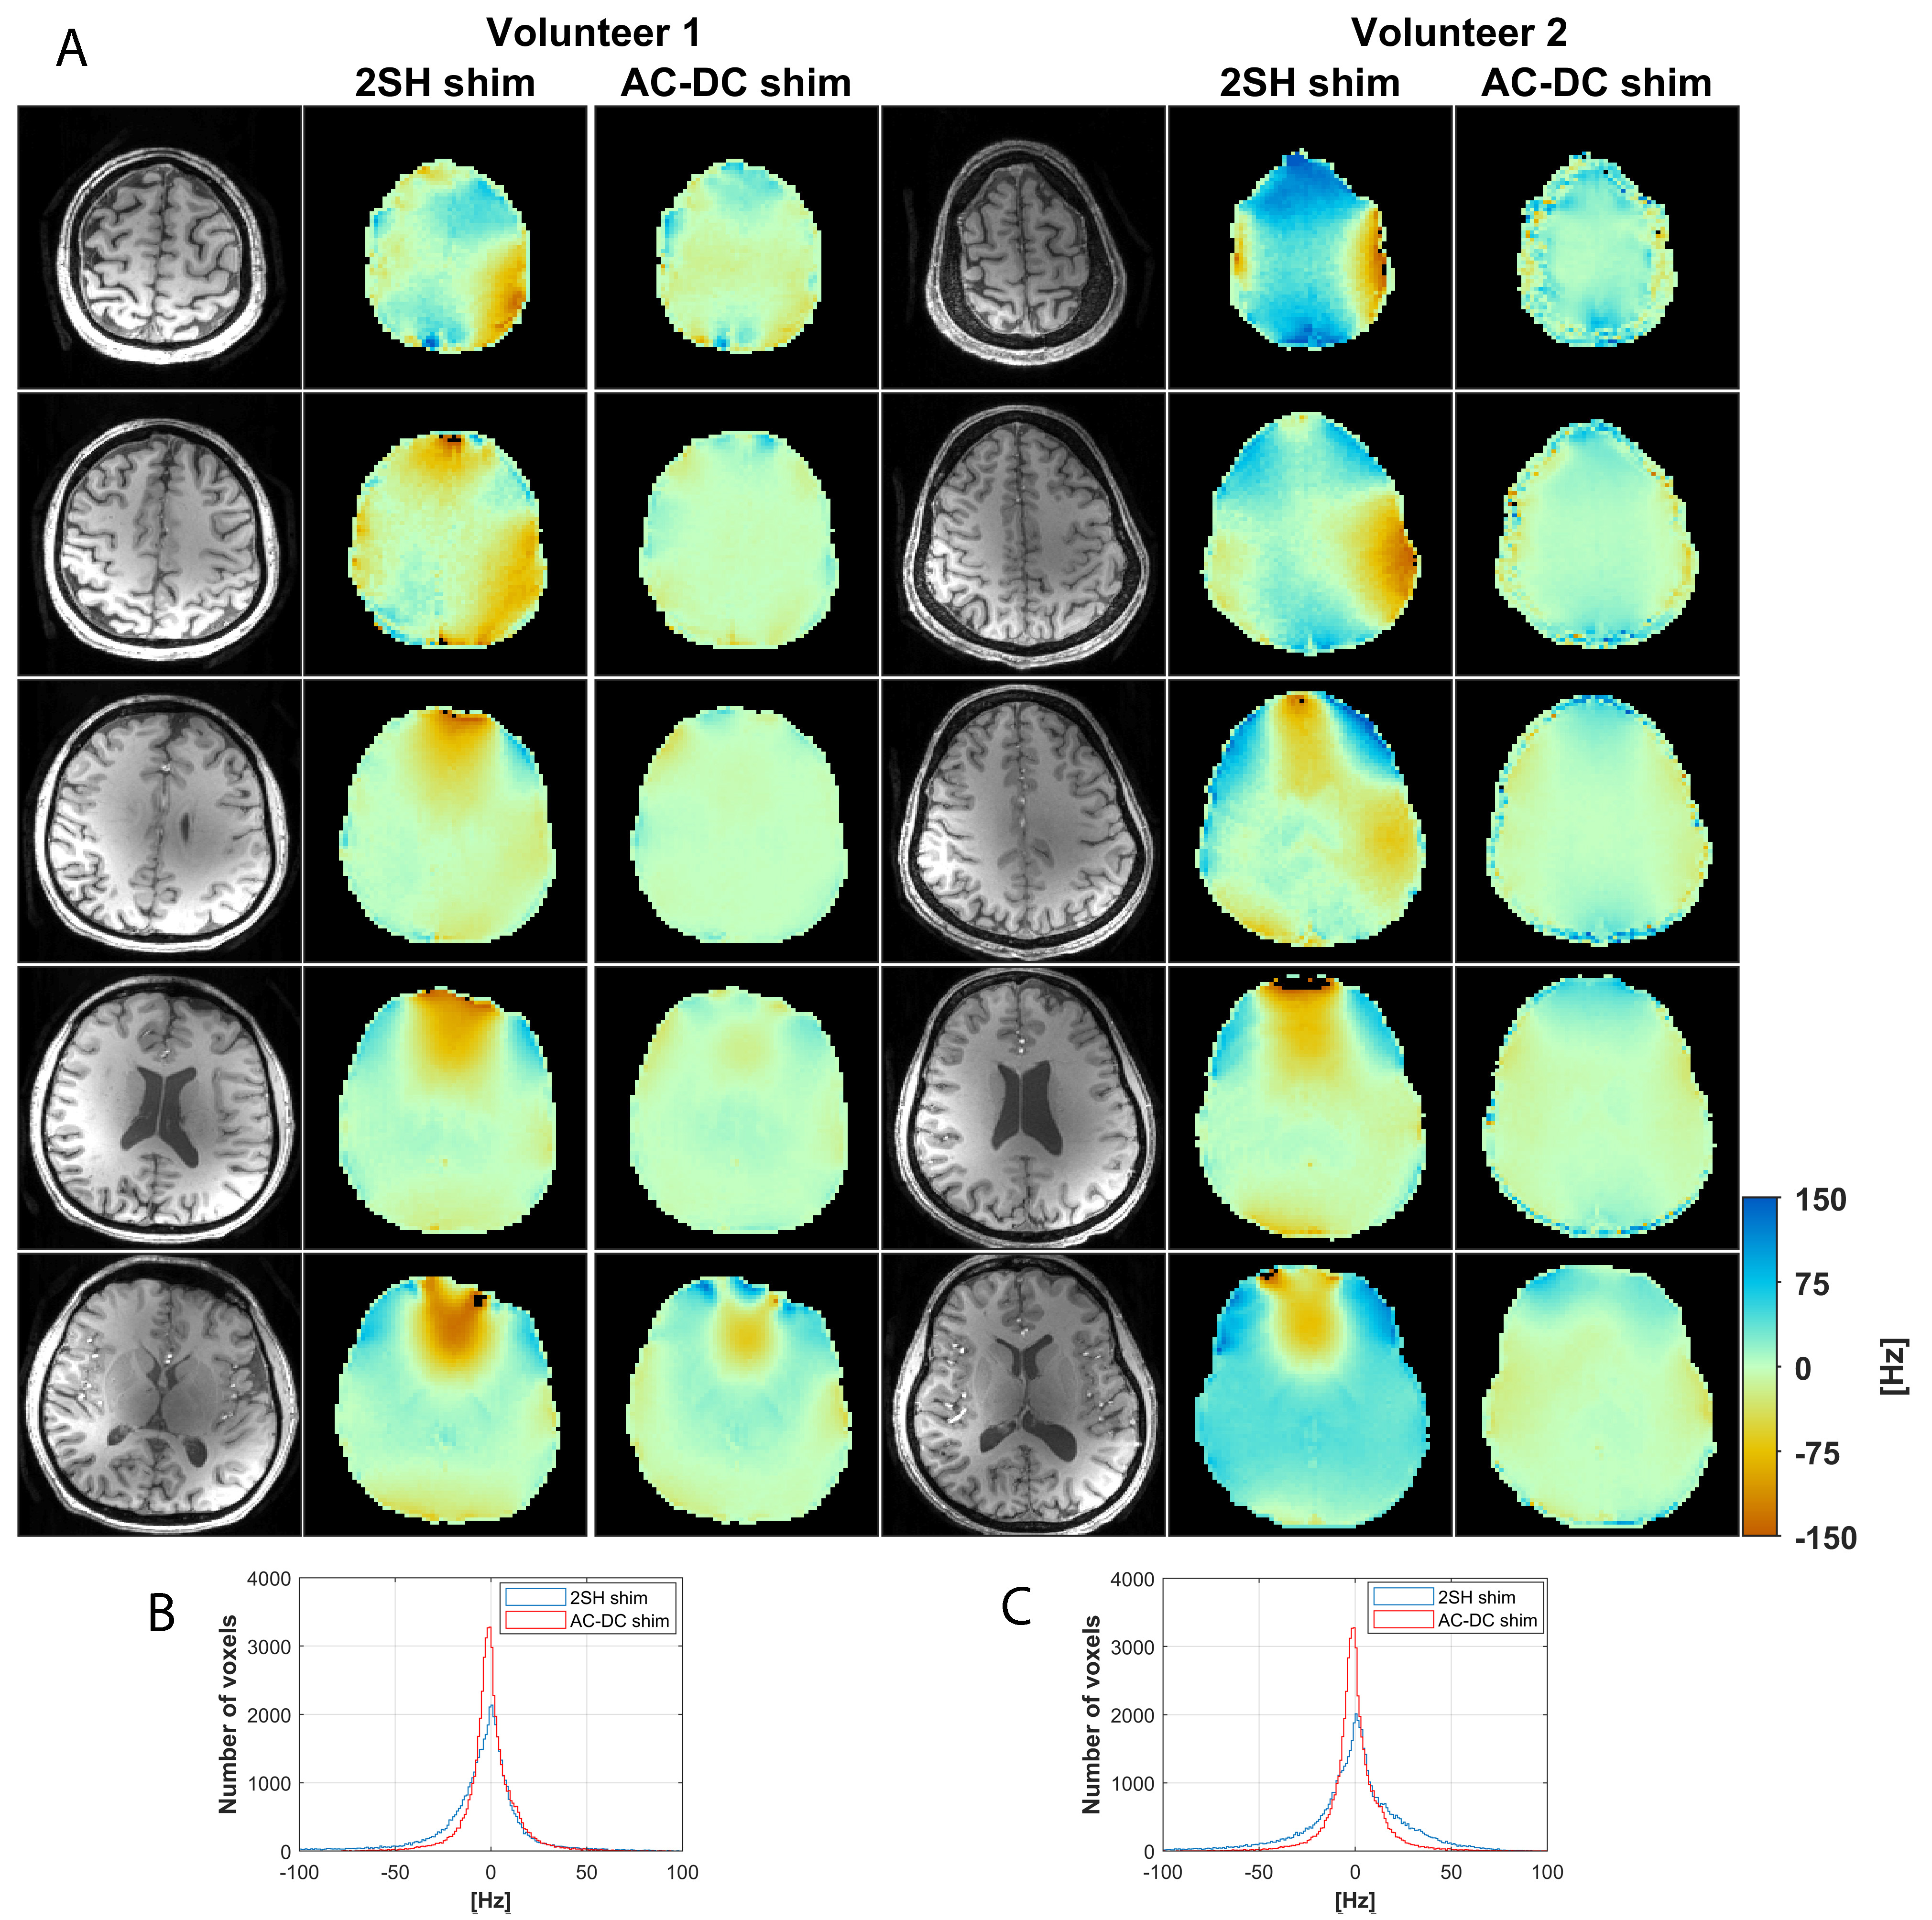
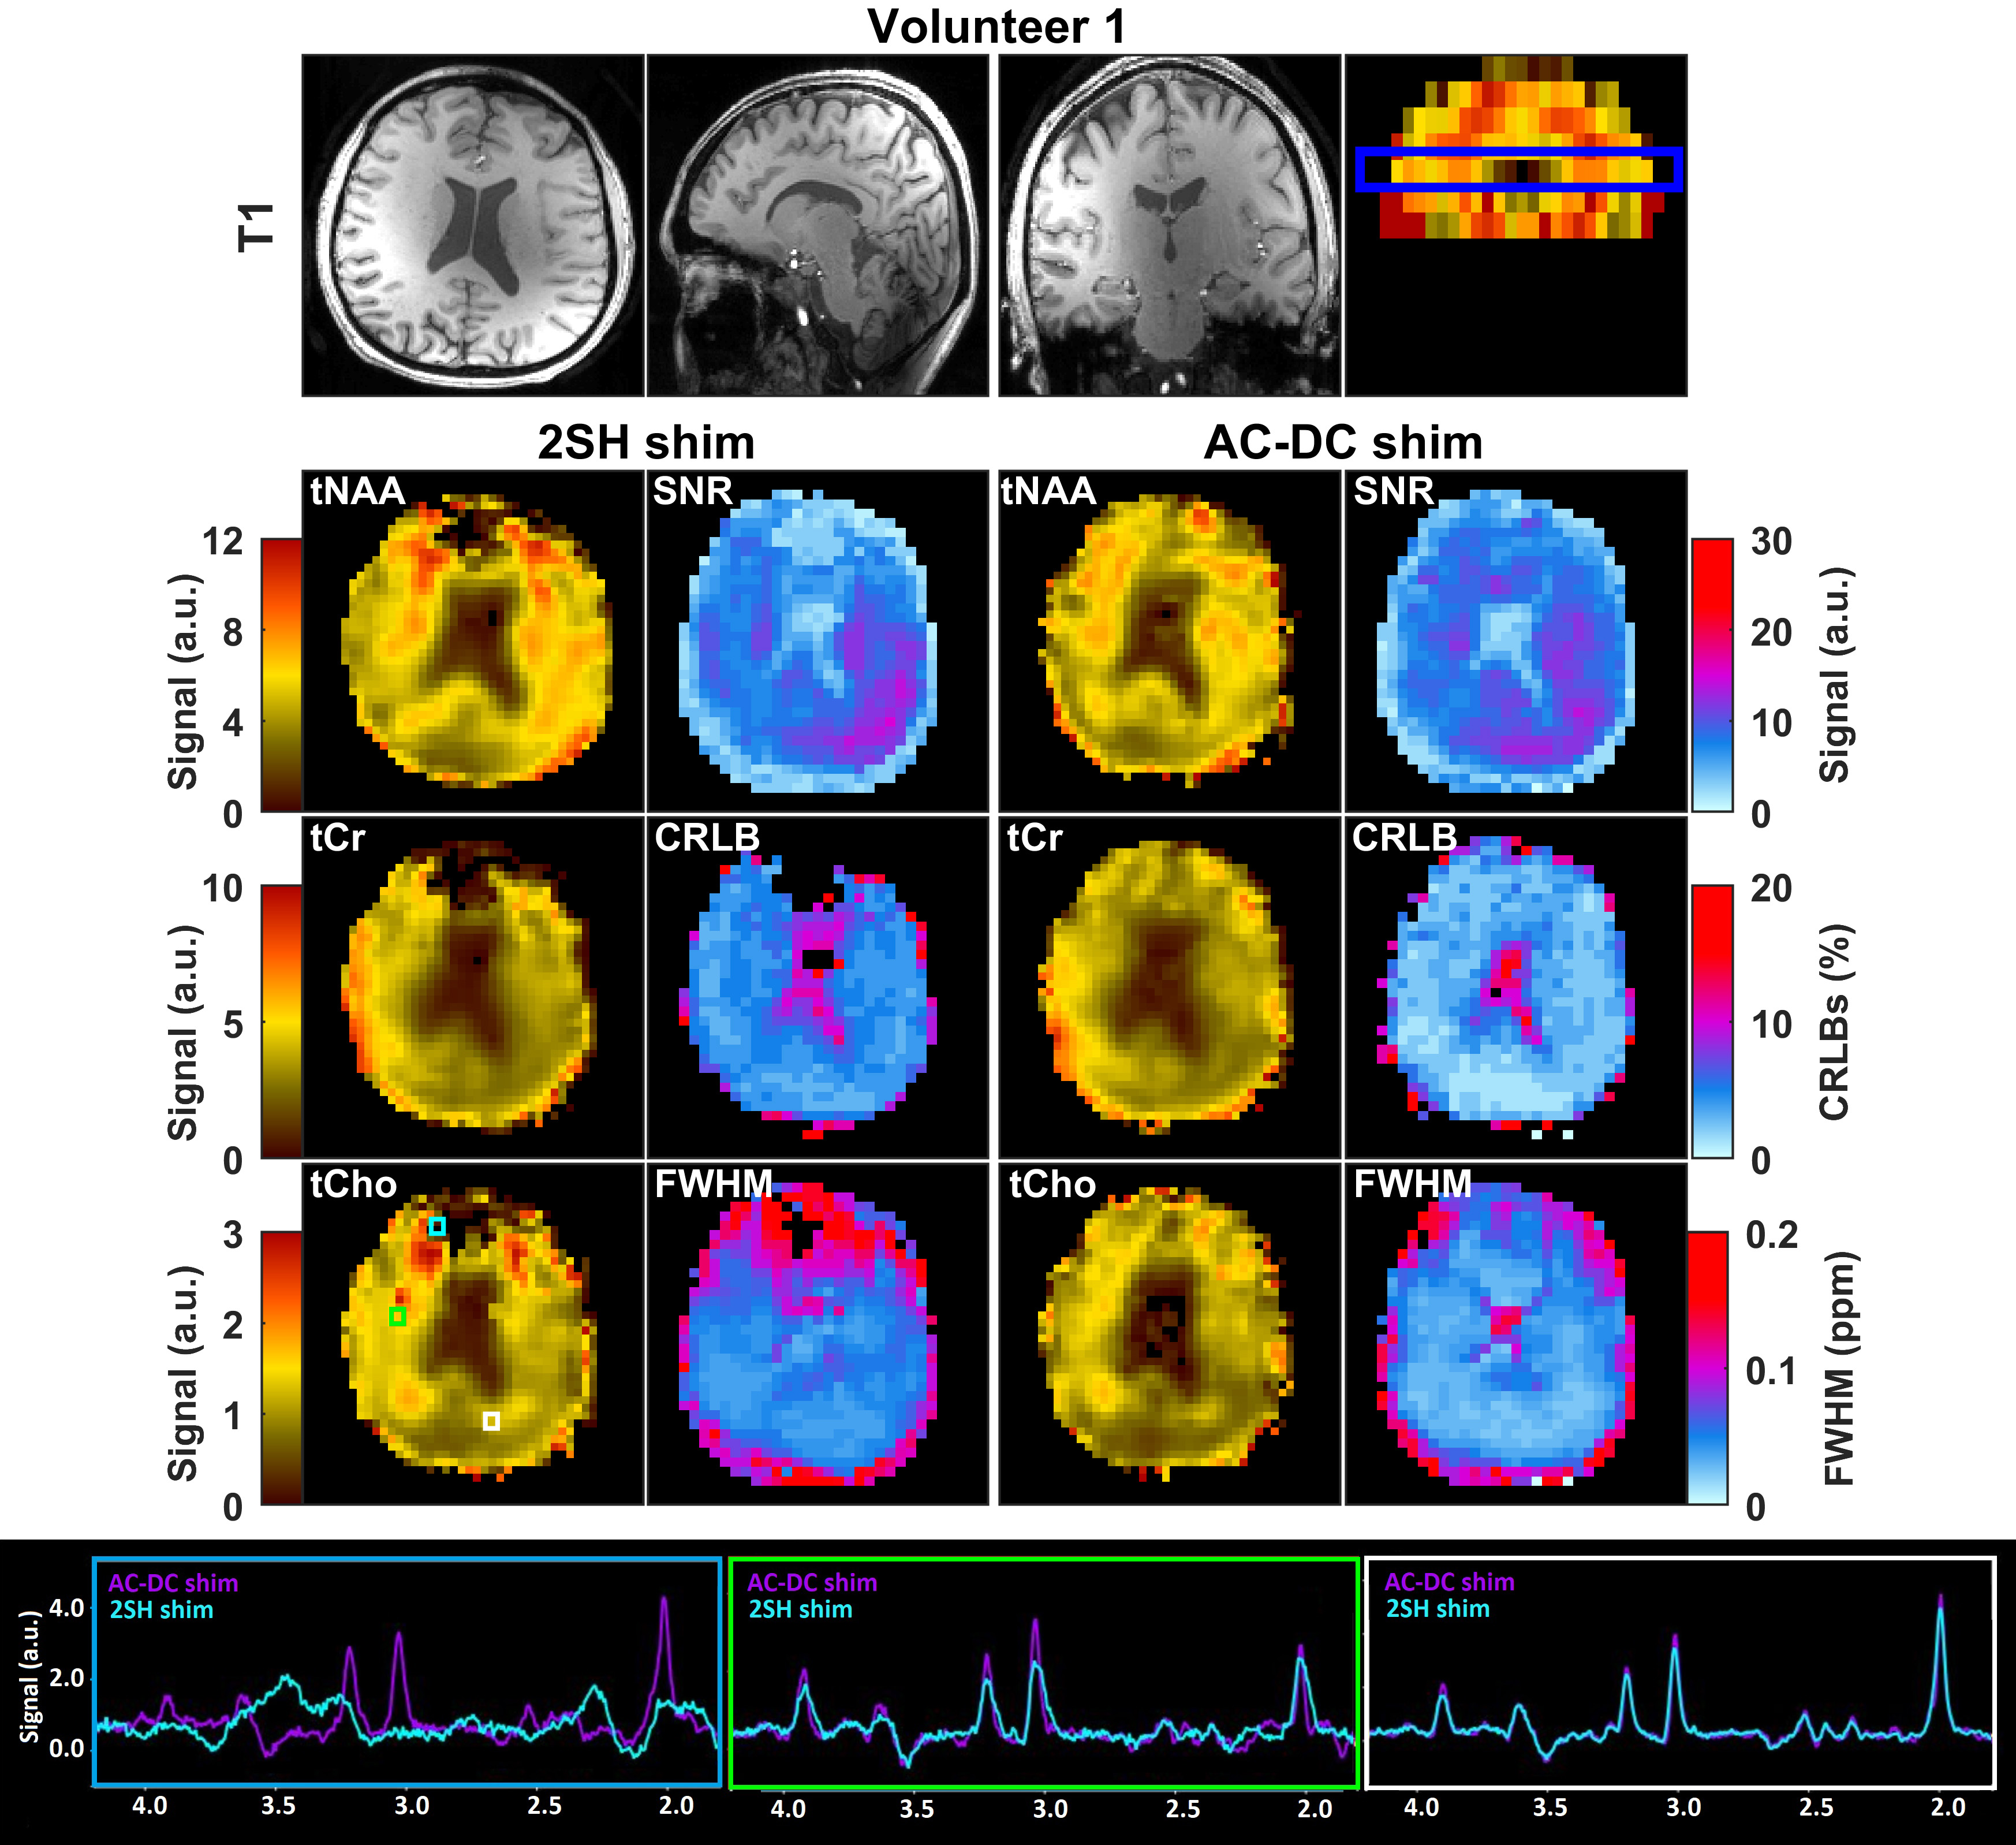
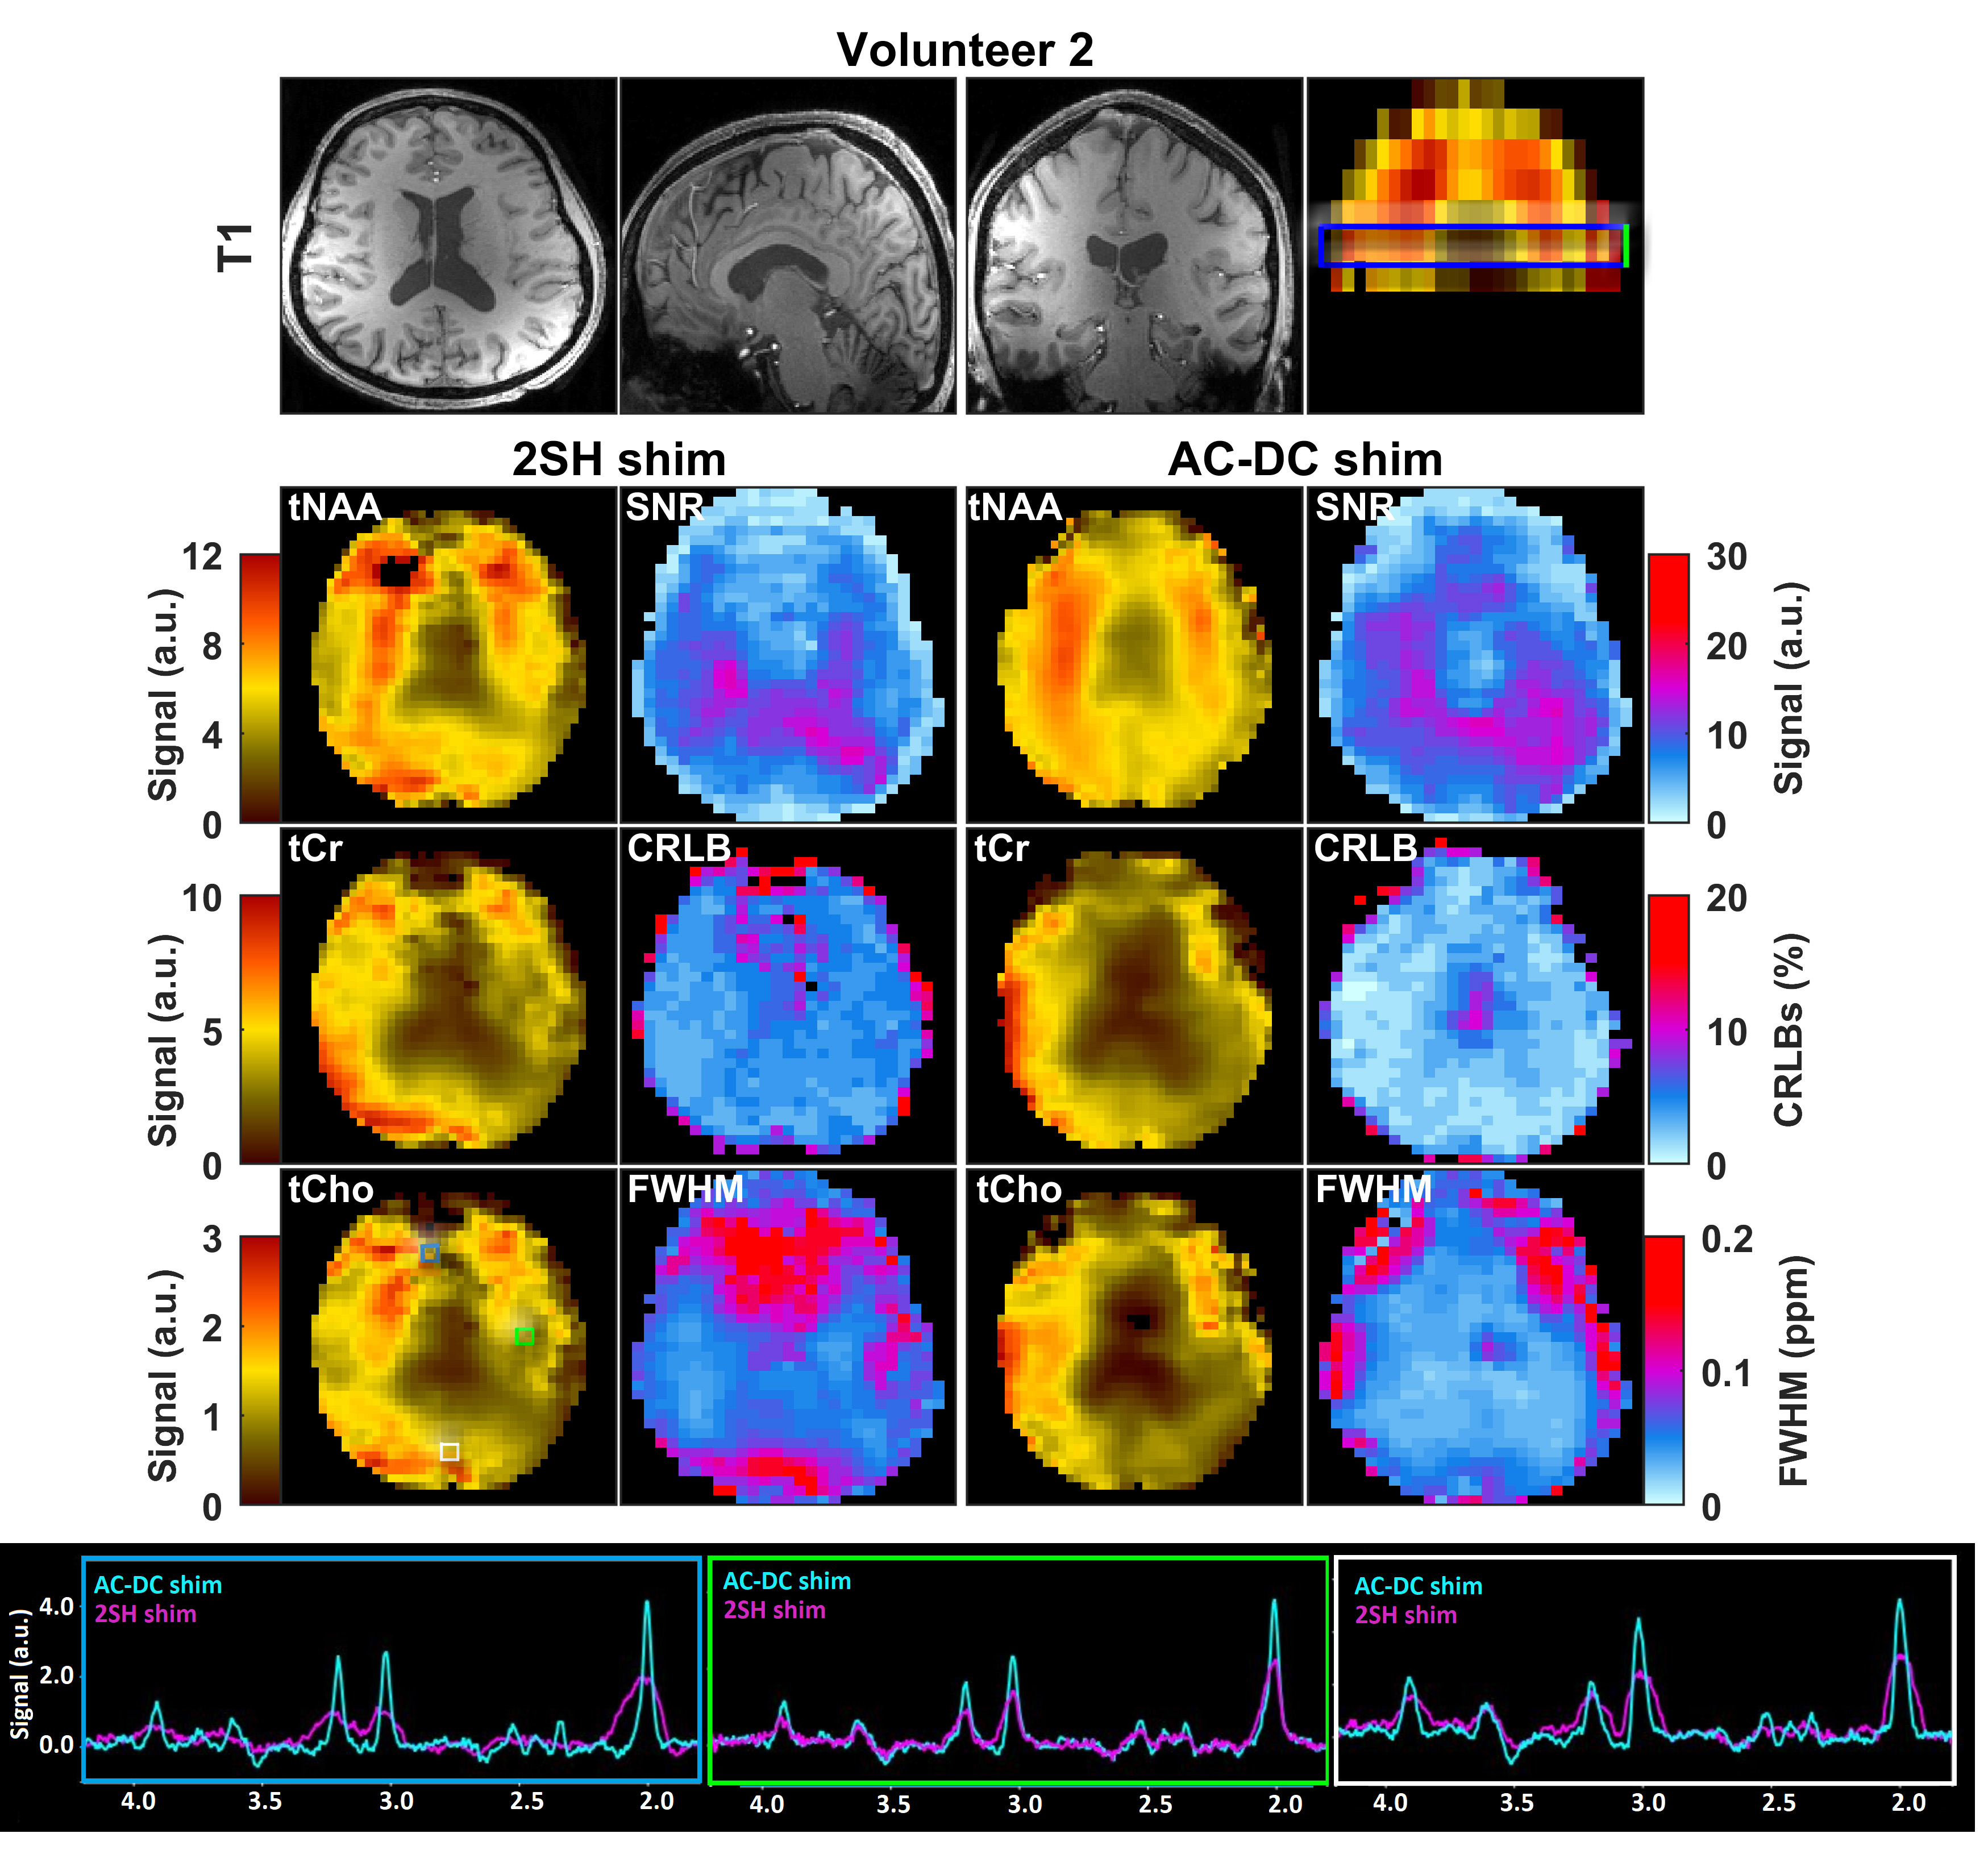
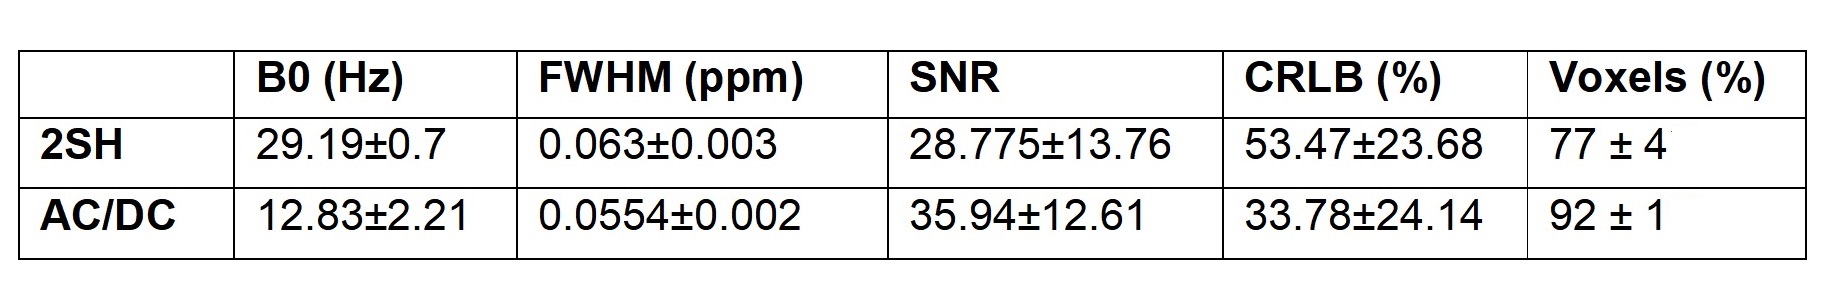
AC/DC-shimming is able to improve the spatial B0 homogeneity when superimposed on the 2SH as can be seen in Figure 1A. In particular, the improvement is higher in the inferior slices where it is notoriously difficult to obtain good quality data in MRSI. The histograms of B0 values over the shimmed brain slab (Fig. 1B,C) is narrower for the AC/DC shimming compared to the 2SH only shimming. The metabolic maps of tNAA, tCr, and tCho exhibit less spatial variability using AC/DC shim compared to 2SH shim (Figs. 2 and 3). In particular, the signal loss in the anterior parts of the brain is recovered with AC/DC shim. Example of spectra from selected voxels in the anterior, center and posterior parts of the brain show a clear improvement in linewidth and signal-to-noise ratio. Spatial improvement in linewidth (FWHM), signal-to-noise ratio (SNR), and Cramer-Rao lower bounds (CRLB) are visible across the brain in the corresponding maps. The improvement in mean and standard deviation of these parameters across the whole brain slab in all volunteers are listed in Table 1.
DISCUSSION
The results from metabolic maps demonstrated improved quality with less variability and signal loss in MRSI acquired with AC/DC multi-coil shim compared to 2SH standard scanner shimming routine. The high order AC/DC multi-coil shimming provided a significant reduction of FWHM and increase of SNR which correspondingly improved the goodness of fit and the accuracy of quantification across the entire brain slab, and particularly important in the inferior brain slices that are the most problematic for MRSI especially at ultra-high field. The real-time motion and shim correction navigator added stability and robustness to the MRSI measurement allowing extended acquisition times for high-resolution whole-brain metabolic imaging at ultra-high field.
CONCLUSION
The AC/DC B0 shimming technology makes whole-brain metabolic mapping feasible with 3D MRSI at 7T ultra-high field. This results in improved data quality and quantification accuracy, which has great potential for investigating brain neurochemistry in healthy and disease conditions.
Acknowledgements
This work was supported by NIH/NCI (1R01CA211080), the South-Eastern Norway Regional Health Authority (Helse Sør-Øst 2018047), and Austrian Science Fund (J 4110, P30701).References
1. Stockmann JP, Witzel T, Keil B, Polimeni JR, Mareyam A, LaPierre C, Setsompop K, Wald LL. A 32-channel combined RF and B0 shim array for 3T brain imaging. Magnetic resonance in medicine 2016;75(1):441-451.
2. Winkler SA, Warr PA, Stockmann JP, Mareyam A, Keil B, Watkins RD, Wald LL, Rutt BK. Comparision of new element designs for combined RF-Shim arrays at 7 T. Concepts in magnetic resonance Part B, Magnetic resonance engineering 2018;48b(1).
3. Esmaeili M, Bathen TF, Rosen BR, Andronesi OC. Three-dimensional MR spectroscopic imaging using adiabatic spin echo and hypergeometric dual-band suppression for metabolic mapping over the entire brain. Magnetic resonance in medicine 2017;77(2):490-497.
4. Rosenfeld D, Panfil SL, Zur Y. Analytic solutions of the Bloch equation involving asymmetric amplitude and frequency modulations. Phys Rev A 1996;54(3):2439-2443.
5. Ogg RJ, Kingsley PB, Taylor JS. Wet, a T-1-Insensitive and B-1-Insensitive Water-Suppression Method for in-Vivo Localized H-1-Nmr Spectroscopy. Journal of Magnetic Resonance Series B 1994;104(1):1-10.
6. Hiba B, Faure B, Lamalle L, Decorps M, Ziegler A. Out-and-in spiral spectroscopic imaging in rat brain at 7 T. Magnetic resonance in medicine 2003;50(6):1127-1133.
7. Bogner W, Hess AT, Gagoski B, Tisdall MD, van der Kouwe AJ, Trattnig S, Rosen B, Andronesi OC. Real-time motion- and B-correction for LASER-localized spiral-accelerated 3D-MRSI of the brain at 3T. NeuroImage 2013;88C:22-31.
8. Provencher SW. Estimation of Metabolite Concentrations from Localized in-Vivo Proton Nmr-Spectra. Magnetic resonance in medicine 1993;30(6):672-679.
9. Bilgic B, Gagoski B, Kok T, Adalsteinsson E. Lipid suppression in CSI with spatial priors and
highly undersampled peripheral k-space. Magn Reson Med 2013;69(6):1501-1511.
Figures