4221
Finite Element Vibration Analysis of Multi-Coil B0 Hardware for Human Brain MRI1Department of Biomedical Engineering, Columbia University in the City of New York, New York, NY, United States, 2Hamburg University of Technology, Hamburg, Germany, 3Department of Radiology, Columbia University in the City of New York, New York, NY, United States
Synopsis
As part of the design of a novel head-only scanner for improved accessibility of MRI and advanced motor coordination studies, we developed a finite element model of the expected vibration modes of a multi-coil array capable of generating linear and non-linear MRI encoding fields. We found significant resonances in the frequency range of interest whose shape and position can be altered by mechanical uncoupling of the array through mounting via rubber elements.
Introduction
In an effort to improve accessibility of magnetic resonance imaging (MRI) a novel compact 1.5 T head-only scanner is currently developed (compare M. Garwood et al., Proc ISMRM 2020). The magnet includes a window for the subject to look through and leaves the shoulders free to enable limb movement. As part of this project we recently developed a multi-coil (MC) array tailored to the small available bore space and the desired low power demand of this scanner1. The MC array is capable of generating both linear2,3 and non-linear4 encoding fields for MRI along with concomitant B0 shim corrections5.The MC hardware employs 31 copper coils embedded in a fiberglass reinforced epoxy (GRE) body. The coils consist of 200 turns per coil that are driven individually with up to 5 A per coil. During operation of these coils inside the 1.5 T scanner magnetic field they will be subject to Lorentz forces. These forces can potentially cause vibrations of the MC array, which in turn can generate unacceptable noise levels and in the worst case provide a safety hazard to the subject and a threat to the structural integrity of the setup. It is, therefore, necessary to comprehensively investigate the force and vibration behavior of the system at hand across the frequency range associated with the intended MRI experiments. As a first assessment of these effects we present a finite element analysis (FEA) of the expected vibration modes of the MC hardware as part of the novel 1.5 T head-only MR system.
Methods
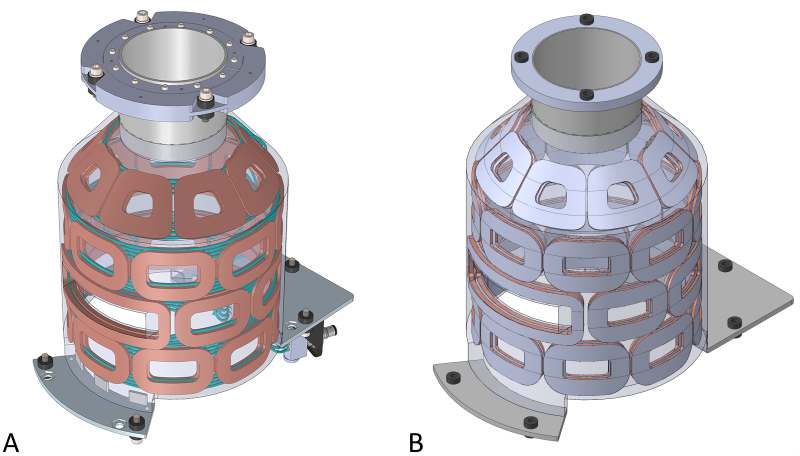
All analyses were performed in Solidworks (Dassault Systèmes, Vélizy-Villacoublay, France). The CAD model of the MC array (Figure 1A) was reduced to relevant structural components to create a suitable FEA model (Figure 1B). A modal analysis was implemented by applying sinusoidal harmonic excitations as torques acting on the MC array’s coil elements and simulating the displacement fields for different excitation frequencies. The torques of up to 5.1 Nm were applied based on precalculated coil currents corresponding to the generation of typical MC fields to be employed for imaging the human head1,3. All material behavior was assumed isotropic linear elastic and material parameters were assigned using Solidworks’ database values. The mounting points (5 at the bottom, 4 at the top, cf. Figure 1) were modeled as fixed restrains without prestressing.The exact material properties of the in-house created GRE are unknown. Therefore, the analysis was performed twice with common values for a softer and a stiffer material (Young’s moduli 23 GPa and 40 GPa). Besides rigid mounting of the MC array to the MR scanner structure, potential and characteristics of mechanical decoupling were analyzed. To this end, in a third analysis, the latter analysis was repeated while introducing rubber elements at the fixture points to introduce vibrational damping of the structure.
Results
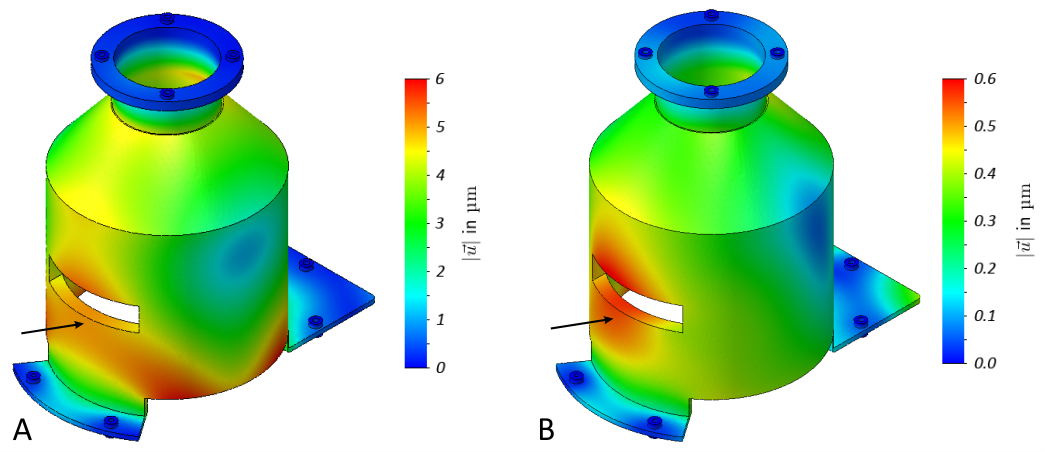
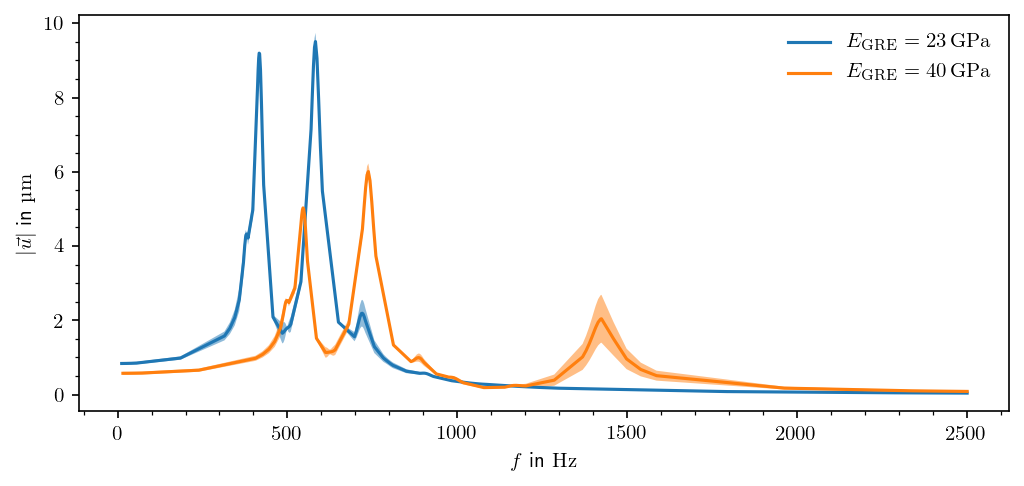
We found that the frequency dependent behavior of the model was best represented by an area below the window (cf. Figure 2). This area was subsequently used to generate so-called amplification functions by plotting the average displacements of nodes in that area $$$\lvert\vec{u}\rvert$$$ as a function of the excitation frequency f.The results for the rigid mounting revealed two significant resonances at 417 Hz and 582 Hz (Figure 3). With the stiffer GRE these resonances were shifted to higher frequencies (546 Hz and 738 Hz, respectively), however, at a reduced magnitude. Additionally, a third broader resonance was found at 1424 Hz.
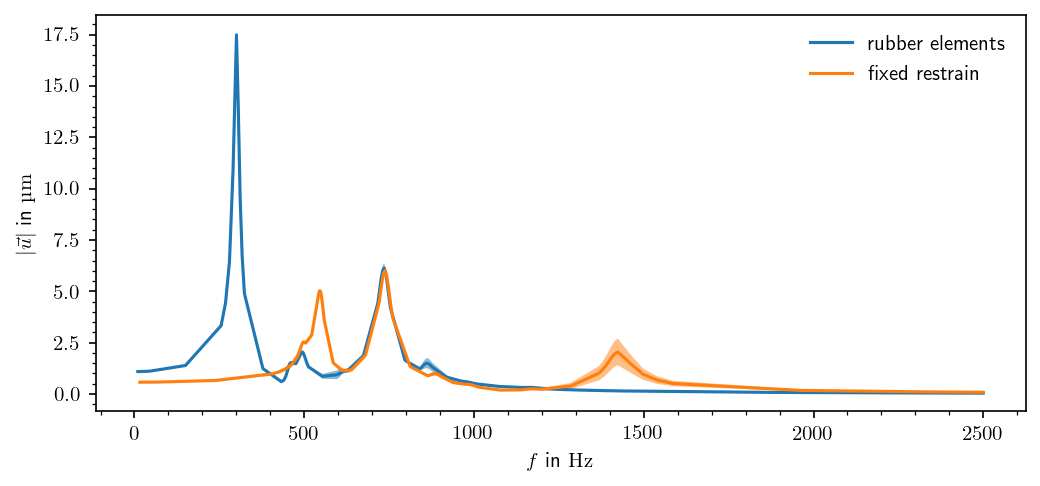
Adding the rubber elements to the mounting positions increased the degrees of freedom in the mechanical coupling between the MC array and the surrounding structure. The corresponding amplification function (Figure 4) revealed a dampening effect at higher frequencies but an amplification of lower frequencies with a high-amplitude narrow peak at 300 Hz. The resonance at 738 Hz appears unchanged.
Conclusion & Outlook
An FEA model of the MC hardware to be used in the newly developed 1.5 T head-only MR scanner was developed and its vibrational behavior investigated in a modal analysis, revealing two significant resonances below 1000 Hz and one around 1400 Hz. The MC array is expected to be used with rise times between 500 µs and 1000 µs1,3, so that mechanical resonances up to 2000 Hz could potentially be excited. The strength and location of the observed resonances were altered by mounting the setup via rubber elements. In reality, GRE is anisotropic while rubber material exhibits a non-linear stress-strain relationship. These aspects have been neglected in the presented work, so that the calculated amplitudes as well as the exact locations of the resonances cannot be expected to be fully accurate and should be considered first approximations. Future extensions of the model will include these effects and will investigate the influence of various levels of prestressing of the setup on the results.Assembly of the head-only 1.5 T MR scanner is scheduled for 2020. Once in place, the derived mechanical eigen-resonances will be carefully measured to confirm acceptable vibration behavior during MR sequence execution and to assure safe operation of the system. Application of different rubber materials at the mounting points is furthermore expected to provide an additional degree of freedom for shaping the vibrational behavior of the system.
Acknowledgements
This research was supported by the National Institute of Biomedical Imaging & Bioengineering of the National Institutes of Health under award number U01EB025153.References
1. Theilenberg S, Shang Y, Kobayashi N, Parkinson BJ, Juchem C. Multi-Coil Array for Combined Imaging and B0 Shimming in a Portable Head-Only Scanner. In: Proc. Intl. Soc. Magn. Reson. Med. 27, 1480 (2019).
2. Juchem C, Nixon TW, McIntyre S, Rothman DL, de Graaf RA. Magnetic field modeling with a set of individual localized coils. J Magn Reson. 2010;204(2):281-289.
3. Juchem C, Mullen M, Kumaragamage C, et al. Dynamic Multi-Coil Technique (DYNAMITE) MRI on Human Brain. In: Proc. Intl. Soc. Magn. Reson. Med. 27, 0219 (2019).
4. Juchem C, Nixon TW, de Graaf RA. Multi-Coil Imaging with Algebraic Reconstruction. In: Proc. Intl. Soc. Magn. Reson. Med. 20, 2545 (2012).
5. Umesh Rudrapatna S, Fluerenbrock F, Nixon TW, de Graaf RA, Juchem C. Combined imaging and shimming with the dynamic multi‐coil technique. Magn Reson Med. 2019;81(2):1424-1433.
Figures