4203
Comparing the use of IR cameras with small media layer heights with temperature probe mapping for gradient induced hotspot evaluations1R&D, MRI-STaR - Magnetic Resonance Institute for Safety, Technology and Research GmbH, Gelsenkirchen, Germany, 2MR:comp GmbH, Gelsenkirchen, Germany
Synopsis
Gradient induced heating of an AIMD is a serious safety hazard. To examine this risk a time consuming temperature mapping of the device with temperature probes is necessary to characterize hotspots on the implant. The use of IR cameras would directly point out where those hotspots occur and simplify those measurements to fewer mapping runs with temperature probes. But the small solution medium layer heights necessary for imaging could alter the hotspot characteristics. We investigated this problem with a laboratory test system and showed that hotspots neither move nor are affected in its location by different media types.
Introduction:
Gradient-induced heating is a well-known potential risk for patients with active implantable medical devices (AIMDs). The switched magnetic fields of the MRI-scanner interact with these devices and induce energy in form of eddy currents into conductive components with a certain minimal size and orientation. This can lead to local heating effects. A method to evaluate this risk is defined in ISO/TS10974 1 and requires a hotspot survey prior to testing. If temperature sensors are used and the device under testing (DUT) is large, a fine-meshed and time consuming grid on the DUT has to be examined. To overcome this problem the use of infrared cameras was proposed to monitor the device heating, but it can only monitor the temperature through a thin layer of liquid (about 2-3mm). So the question we tried to resolve is:Can hotspots be correctly assessed with IR cameras? And do small media heights affect the hotspot characteristics?
Material and Methods:
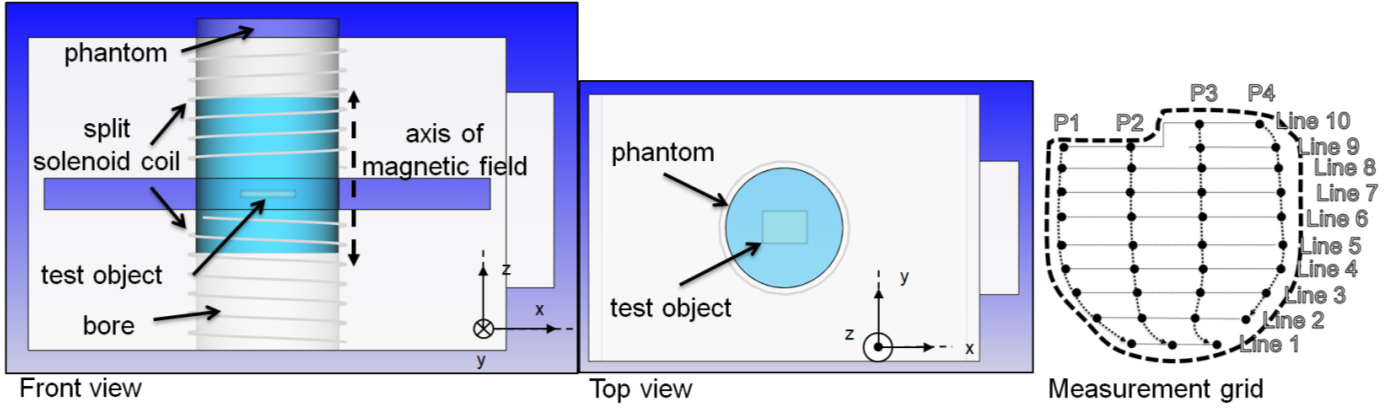
Testing was performed in a laboratory test system. The DUT was placed inside a pulsed magnetic field simulator coil (PMFS, MRI-Tec, Germany) (see Fig.1), which is excited by high performance amplifiers and a function generator that provides the pulse sequences. A triangle wave form with 2500 Hz was selected, with a dB/dtrms of about 140 T/s at the test object location and duration of 300s. Magnetic field condition testing was performed using a calibrated search coil. A measurement grid (see Fig.1) was drawn on the DUT, an explanted generic IPG (maximal spacing: line to line about 5mm, probe point to probe position about 10mm). The IPG was coated with anti-reflection spray and placed in the phantom with its biggest surface oriented perpendicular to the magnetic field. This orientation leads to the highest heating effects. An IR-Camera (FLIR, Wilsonville, OR, USA) is used to monitor the hotspots and Fiber optic temperature probes (Optocon AG, Dresden, Germany) are used for temperature mapping. Two media types were selected and compared: Polyacrylic gel and a NaCl solution (both: σ = 0.47 S/m and εr = 78 1).In a first step the IPG inside the phantom was covered with 2-3mm of gel and the IR-hotspot search was performed using the IR camera. In the second step the temperature probes were placed at the predefined line (P1-P4) on the implant (see Fig.2). The phantom was filled entirely with gel. The medium was stirred until the temperature was homogenously within ± 1.0 °C of the room temperature and the 300s exposition started. This step was repeated until data for all relevant grid positions was obtained. The gel was then replaced with the NaCl solution and the entire experiment was repeated. Grid line measurements were performed in gel at line 1,2,3,4,6,10 (see Fig.3) and in NaCl at line 11,2,,2,3,5,10.
Results and Discusion:
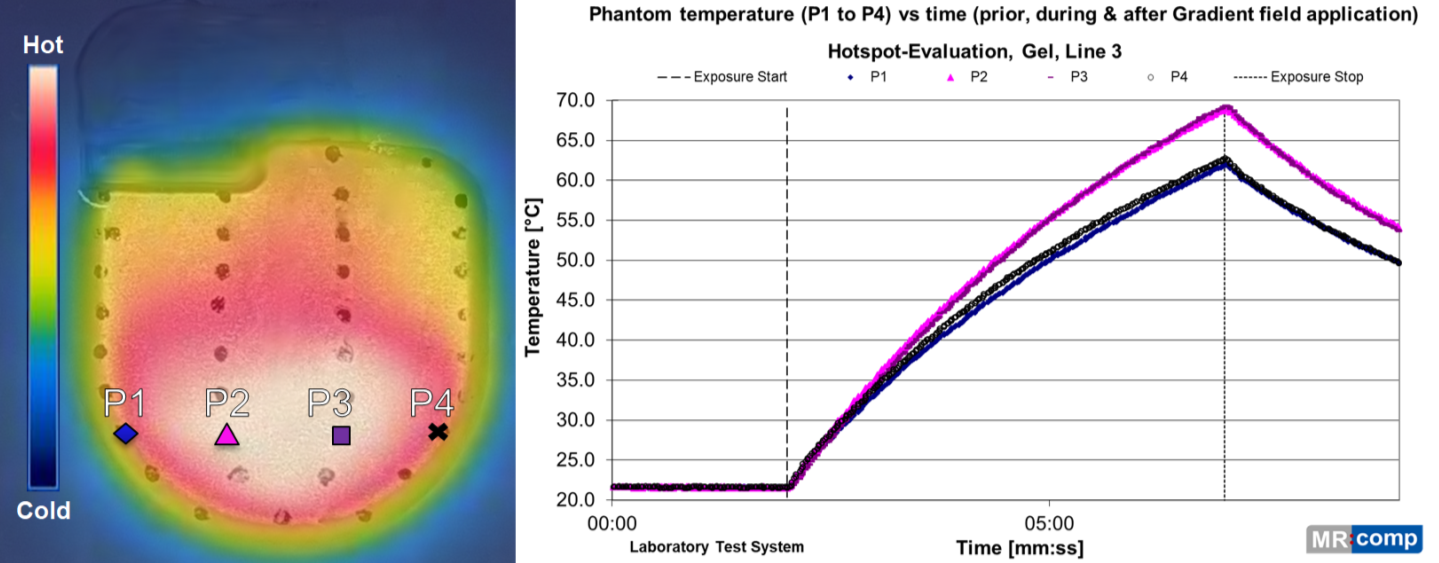
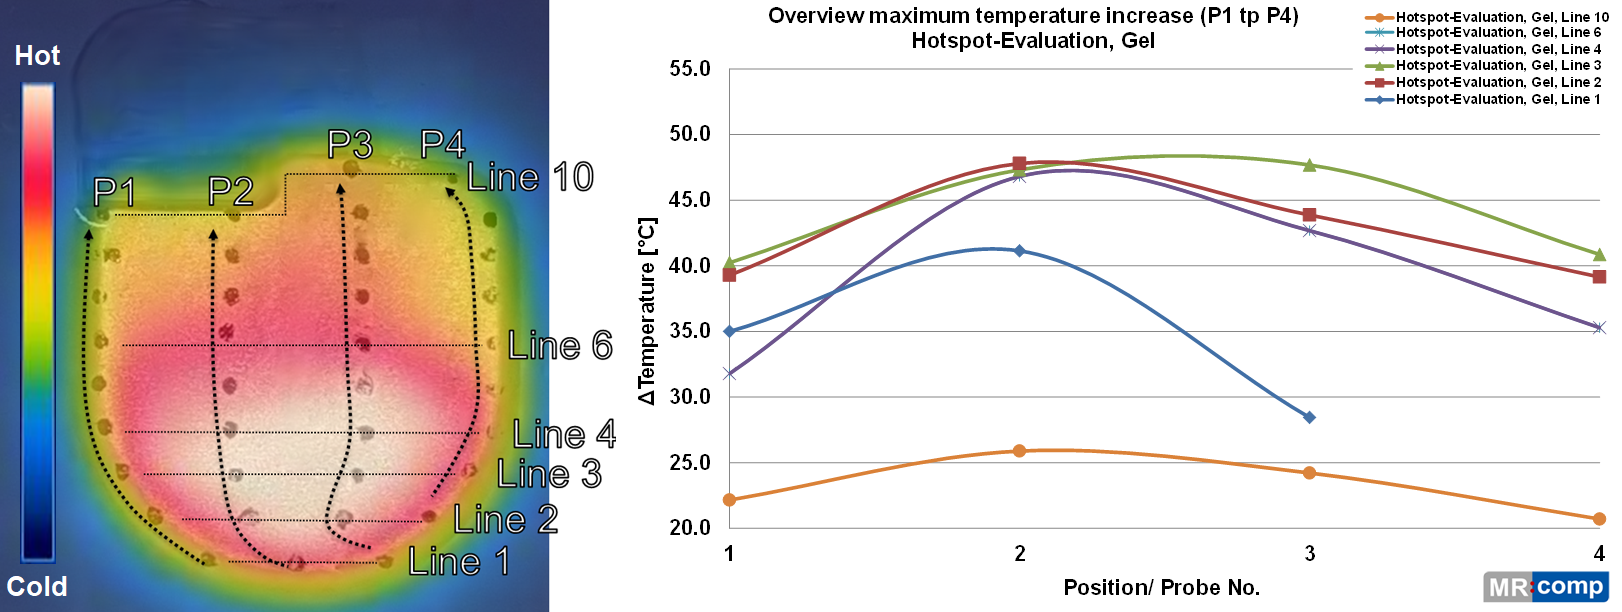
The time-dependent temperature rise in gel for one grid line is presented in Fig.2. The corresponding IR-Image, at tend=300s, shows a large hotspot on the lower half of the IPG, with cooler edges. The same characteristics can be seen on the temperature probes chart in Fig.2, where central sensors P2 and P3 show the highest and the sensors on the edge P1 and P4 show a significant lower temperature.The maximum temperature increase for selected lines is shown in Fig. 3 and is in accordance with the grid locations depicted in the hotspot overlay. Probe 3 shows reduced heating effects on line 2 and 4 compared to probe position 2 on these lines. A reason for this effect could be the more central location of line 2 in the hotspot. According to Fig.3 temperature mapping hotspots are limited to this area, probe position 2 and 3 on line 2 to line 4.
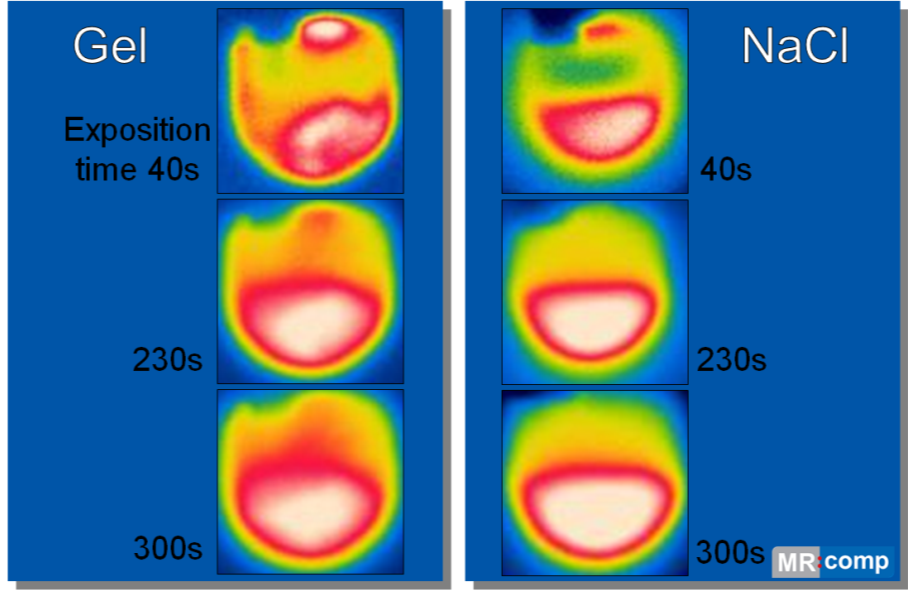
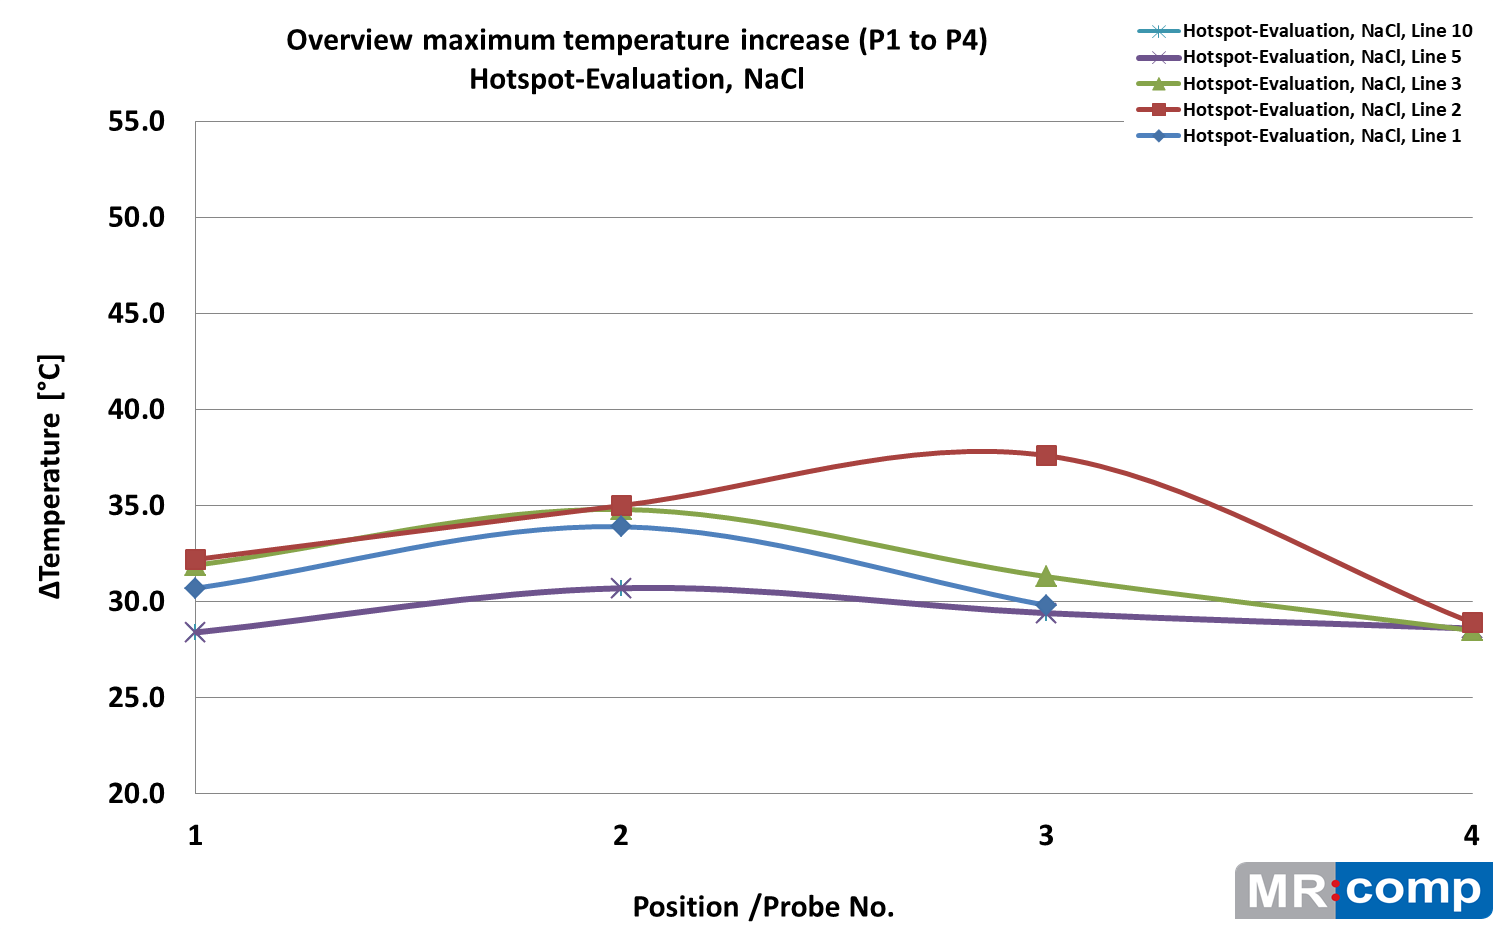
Fig.4. is comparing the hotspot growth in gel and NaCl. The NaCl solutions shows a sharper image with more confined thermal zones, but the maximum temperature rise is much lower compared to gel (see Fig.5). There are also differences between probe position 2 and 3 (line 2 and 3). This could be due to convection effects in the less viscous medium. However hotspot centers and especially maximum temperature areas are very similar.
Conclusion:
It is possible to use IR cameras with small media layers to find hotspots; those are congruent to those found with temperature probe mapping and normal medium level infill. This is the case for both NaCl- and gel-media, both media are showing matching hotspot locations. The more viscous and therefore better isolating nature of gel restrains thermic convection better than the more liquid NaCl solution, but also leads to a blurrier IR-picture 2. The overall temperature increase is much higher in gel than in NaCl. Measurements should therefore always be performed in gel. Since IR cameras only give relative temperatures, exact measurements with temperature probes are still essential, but it is possible to save of lot of time by limiting the measurements on the relevant hotspot found by IR cameras. For example in this measurement setup: a reduction from original 10 mapping lines to just 2 or 3 (lines 2 to 4) would be reasonable and a big time saver.Acknowledgements
No acknowledgement found.References
[1] Technical specification ISO/TS 10974 “Assessment of the safety of magnetic resonance imaging for patients with an active implantable medical device”; www.iso.org.
[2] M. Wolff, S. Scholz, A. Douiri, et al. Thermographic evaluation of different media types for hot spot detection during a simulated switched MRI gradient magnetic field exposure. ESMRMB 2017, 34th Annual Scientific Meeting, Barcelona.
Figures