4202
RF-Induced Heating During MRI Examinations Depends on The Baseline Temperature1Radiological Sciences, Stanford University, stanford, CA, United States, 2Division of Radiology, Veteran Affairs Health Care System, Palo Alto, CA, United States, 3Cardiovascular Institute, Stanford University, Stanford, CA, United States
Synopsis
RF-induced heating was performed at different baseline temperatures (TB). Along with temperature increase, B1-maps, conductivity (σ) and the dielectric permittivity(ε) were analyzed. when TB increases, σ and ε increase. However, RF- induced heating decreases.
Introduction
RF-induced heating is a major safety consideration during MRI examinations. To mitigate temperature increase, RF-power is controlled by limiting the specific absorption rate (SAR, W/kg). However, the scanner’s reported SAR is a simplified model-based estimation. During MRI exams an active implanted medical device (AIMD) is prone to RF-induced heating, mostly due to antenna effects. As a result, RF-energy is transformed into a temperature increase that can result in tissue heating, especially at the lead-tip. Because the interactions are localized at the device-tissue interface, the scanner’s reported SAR is an inadequate method to estimate RF-induced heating. Therefore, in general, analysis of RF-induced AIMD lead-tip heating is performed following the F2182−11a ASTM method, wherein the temperature increase is measured using fiber optic temperature probes that are placed near the device under examination. RF-induced heating depends on the immersive media’s electrical properties: conductivity (σ) and the dielectric permittivity (ε). While σ represents the ease with which RF-current conducts. ε characterizes the propagation of the electric-field in the media relates to the media’s polarization and the dissipation of electric energy into heat or loss factor (ε”; proportional to σ/ω, where ω is the RF-frequency) [1]. It has been shown that σ increases with temperature (Figure 1). The latter suggests that the baseline temperature (TB) of the immersive media will affect RF-induced device heating. B1 mapping techniques have been proposed as a method to estimate the media’s electrical properties [2]. Therefore, B1-maps can carry information related to the rate of temperature increase. The objective of this work was to analyze RF-induced heating for titanium ASTM-reference rod placed in the ASTM phantom. Temperature data along with B1-maps were acquired for different TBs. The media’s electrical properties were also analyzed.Methods
Experiments were performed on an ASTM-phantom filled with poly-acrylic acid (PAA) gel at 3T (Siemens, Skyra). A 13cm, 1/8inch titanium ASTM-reference rod was placed on the left side of the phantom and at 9cm from the anterior position (Figure 2-A). This corresponds to a common AIMD implant location. Thermal data was acquired using fluoroptic temperature probes (Lumasense Technologies). One probe was fixed in a tip-to-tip configuration at the end of the rod. RF-induced heating experiments were separated into two parts:Part-1 analyzed the effect of TB on RF-induced heating only (Figure 2-B). Temperature data was recorded at SAR~4 W/kg for four repeated runs of a turbo spin-echo sequence (5 minutes each) with intervals of one minute between each run. TB was defined as the mean temperature 30 seconds before each TSE sequence started.
Part-2 analyzed the relationship between the electrical properties and TB (Figure 2-C). Experiments were repeated on the same phantom for two TBs. The first TB corresponded to the scanner’s room temperature (18.7C); whereas the second TB corresponded to the phantom warmed outside the scanner room (31.3C). For both TBs, RF-induced heating experiments were performed (15 minutes of RF exposure ~4 W/kg), σ measurements and B1-maps were acquired. σ was measured using a conductivity meter, whereas the B1-maps were acquired using an EPI double angle technique [3]. From the B1-maps, ε-maps for both TBs were estimated [4].
Results
The results for Part-1 are shown in Figure 3. The temperature increase (𝚫T) for the four consecutive runs are shown in Figure 3-A. After each run, TB increased but 𝚫T decreased. Maximum 𝚫T during RF-exposure (𝚫Tmax) is shown in Figure 3-B. When TB increased, 𝚫Tmax decreased. For the first TB (30.4C) 𝚫Tmax was 4.7C. For the last run (TB: 34.5C) 𝚫Tmax was 2.6C.The results for Part-2 are shown in Figure 4. Figure 4-A shows the calculated B1-maps for both TBs (18.7C and 31.3C). Results suggest that the magnitude of B1 decreased with increasing temperature. The estimated ε (Figure 4-B) shows an increased value with increasing temperature. σ also increased when increasing Temperature (0.49 S/m vs. 0.58 S/m). 𝚫T curves for both TBs are shown in Figure 4-C. As observed in the experiments in Part-1, RF-induced heating decreased when TB increased. For a TB=18.7C, 𝚫Tmax was 8.3C. On the other hand, For TB=31.3C, 𝚫Tmax was 5.3C.
Discussion and Conclusion
Results here show that RF-induced heating decreases when the media baseline temperature increases. The latter is attributed to the increased value of the media’s electrical properties with temperature. Therefore, temperature control and monitoring of the media is important for device testing during RF exposure. Similar results have been observed during RF heating at 27 MHz [5]. Where an inverse relationship between the loss factor (ε”) and RF-heating rate was observed. Consequently, for greater ε”, a smaller amount of RF-energy was absorbed by the analyzed sample. Lastly, these results suggest that the evaluation of RF-induced heating of medical devices can benefit from the analysis of the media’s electrical properties using MRI-based techniques. More specifically, B1-maps are a promising approach to measure the change of electrical properties when increasing temperature. Further work needs to be performed to more precisely calculate electrical properties from B1-maps.Acknowledgements
This project was supported, in part, by NIH R01 HL131823 to DBEReferences
1. Jiao Y, Tang J, Wang S, Koral T (2014) Influence of dielectric properties on the heating rate in free-running oscillator radio frequency systems. J Food Eng 120:197–203 2.
2. Liu J, Wang Y, Katscher U, He B (2017) Electrical Properties Tomography Based on B1 Maps in MRI: Principles, Applications and Challenges. IEEE Trans Biomed Eng 64:2515–2530 3.
3. Boudreau M, Tardif CL, Stikov N, Sled JG, Lee W, Pike GB (2017) B1 mapping for bias-correction in quantitative T1 imaging of the brain at 3T using standard pulse sequences. J Magn Reson Imaging JMRI 46:1673–1682 4.
4. Haacke EM, Petropoulos LS, Nilges EW, Wu DH (1991) Extraction of conductivity and permittivity using magnetic resonance imaging. Phys Med Biol 36:723–734 5.
5. Wang J, Olsen RG, Tang J, Tang Z (2008) Influence of mashed potato dielectric properties and circulating water electric conductivity on radio frequency heating at 27 MHz. J Microw Power Electromagn Energy Publ Int Microw Power Inst 42:31–46
Figures
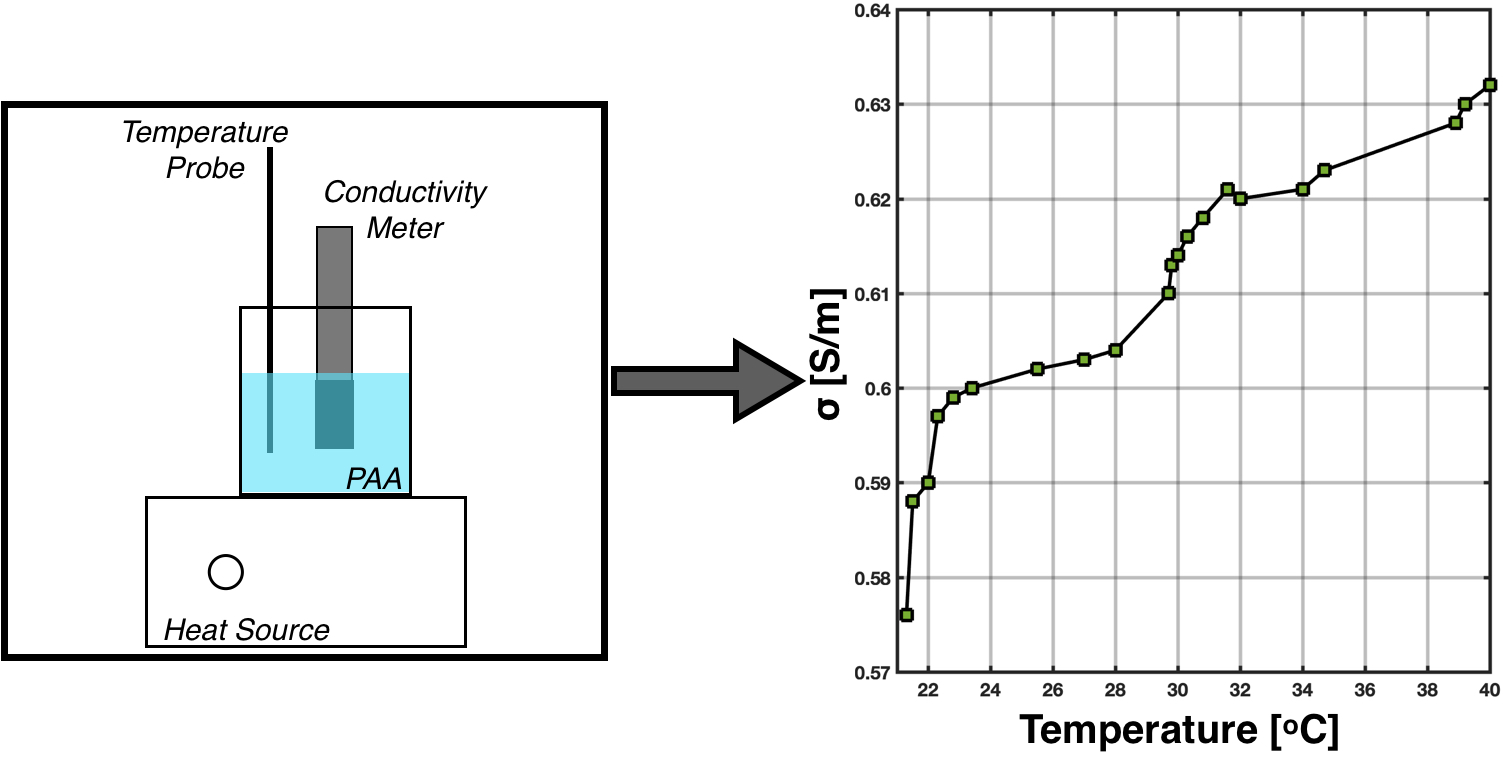
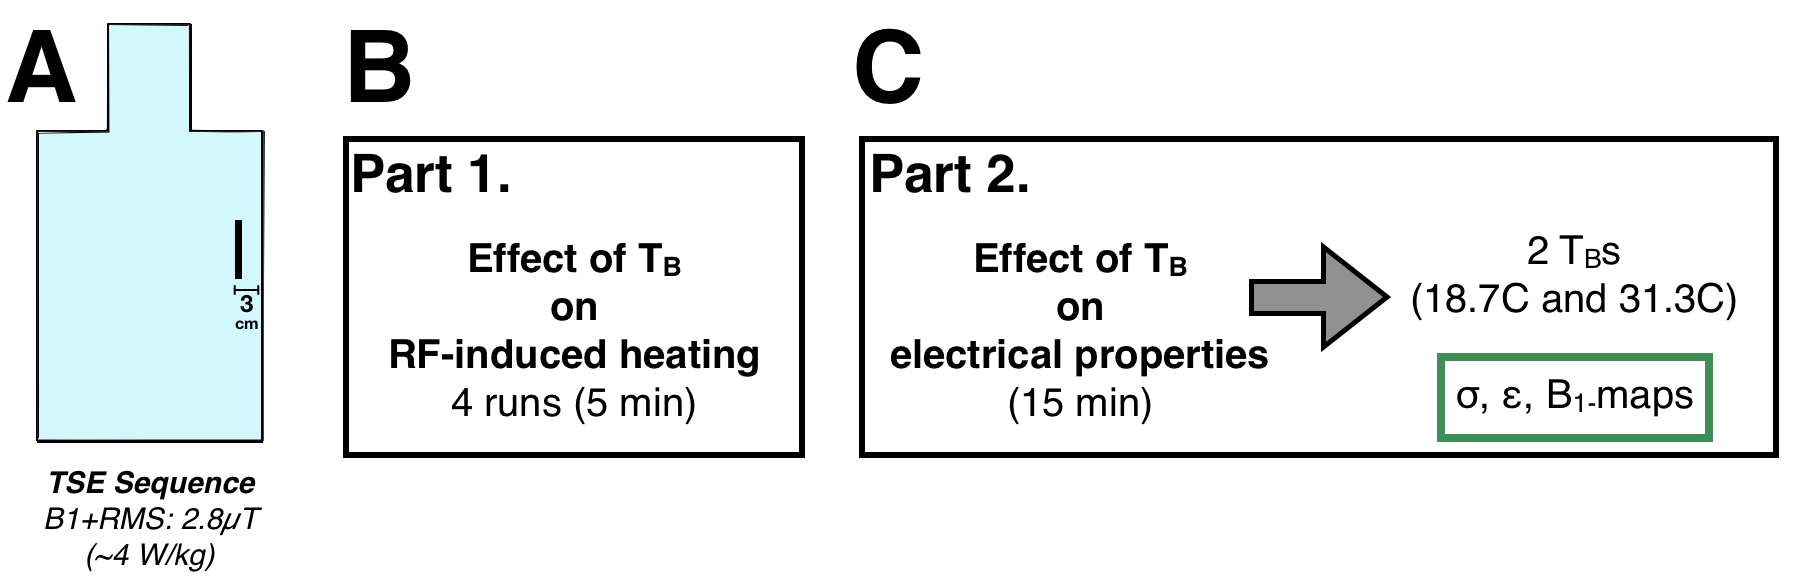
Figure 2. (A) Experimental setup for the 13cm ASTM-reference titanium rod placed in the ASTM phantom. RF-induced heating experiments under First level mode SAR (~4 W/kg). Experiments were performed in two parts: The first part analyzed the effect of baseline temperature (TB) on RF-induced heating only (B). The second part analyzed the relationship between the electrical properties and TB.
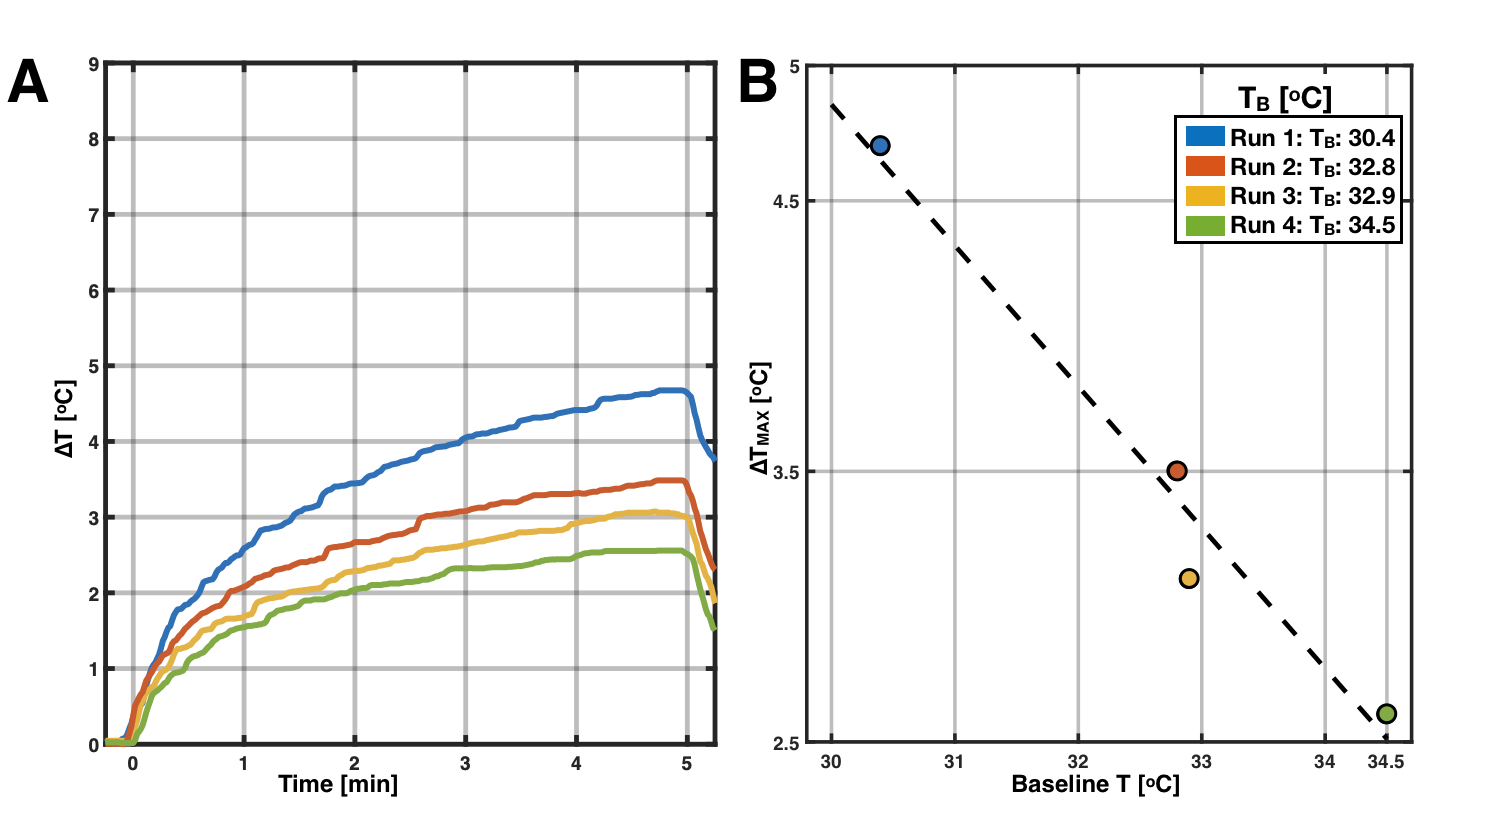
Figure 3. The effect of background temperature (TB) on RF-induced heating experiments for four 5 minutes of consecutive runs of RF-induced heating. (A) Shows the temperature increase (ΔT) for the four runs with different TBs over time. (B) shows maximum recorded ΔT (ΔTmax) during the four runs. ΔTmax decreases when TB increases.
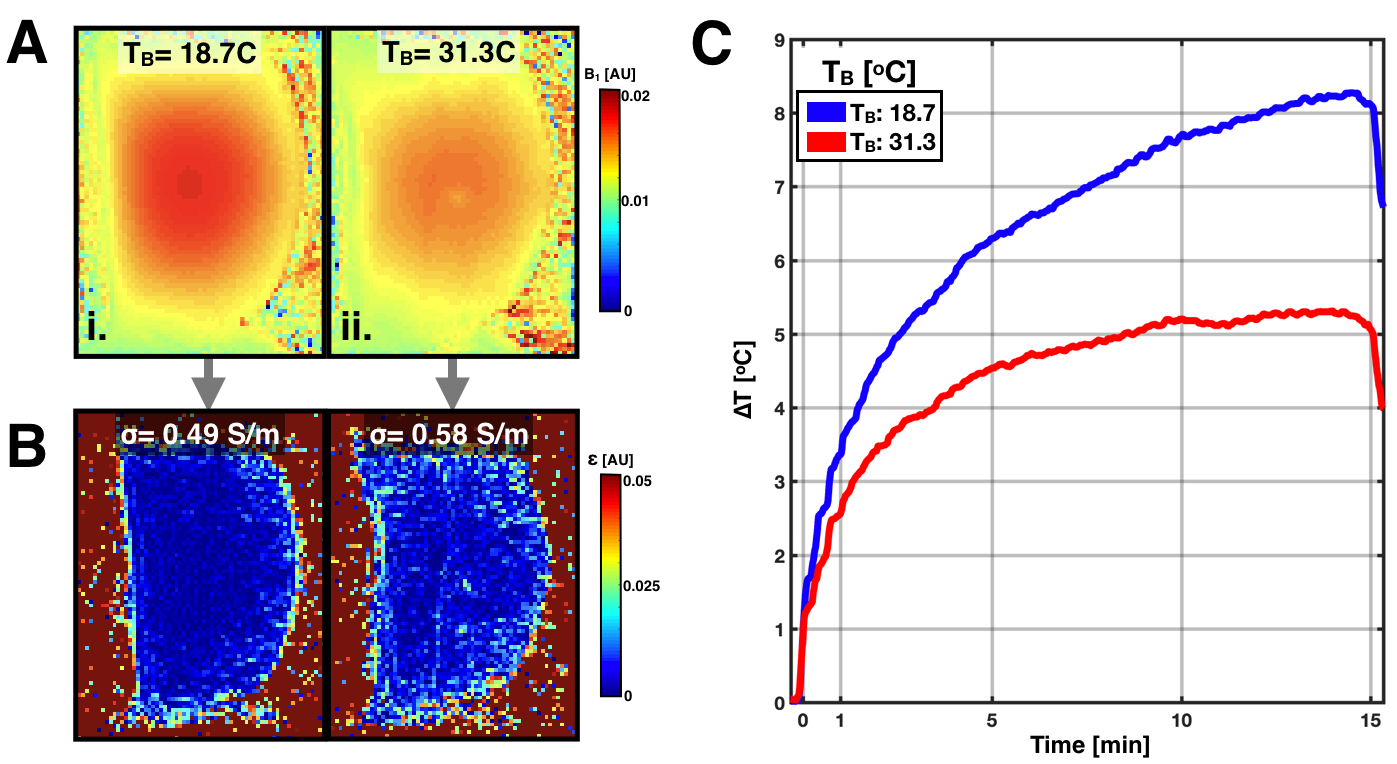
Figure 4. (A) Calculated B1-maps for two baseline temperatures (TBs ). (B) The estimated ε-maps and measured σ for both TBs. Both electrical properties increase with temperature. (C) 𝚫T curves for both TBs. RF-induced heating decreases when TB increases.