4200
Modeling the RF-induced Heating of Stents with an Analytical Model, Electro-Optic E-field Measurements and MR Thermometry1Dept. of Radiology, Medical Physics, Medical Center University of Freiburg, Freiburg, Germany, 2Cortronik GmbH, Rostock-Warnemuende, Germany, 3Institute of Photonics and ICT (IPI), University of Applied Sciences FHGR, Chur, Switzerland
Synopsis
RF-induced currents in stents may cause substantial heating in the surrounding tissue. A precise theoretical calculation of the scattered E-fields is desirable, as heating hot spots occur near the stent surface, which often cannot be measured directly. In this study we present a theoretical model of the scattered E-field of stents and compare it to both electro-optic E-field measurements and MR thermometry. The results demonstrate that the scattered E-field patterns of stents can be precisely calculated from the theoretical model.
Introduction
RF-induced currents in stents may cause substantial heating in the surrounding tissue. RF heating is usually assessed by numerical simulations and temperature measurements1. A precise theoretical calculation of the scattered E-fields at the stents would be desirable, as heating hot spots occur near the stent surface, which often cannot be measured directly. Recently, electro-optic E-field probes were introduced2,3 that allow for a precise measurement of the E-field even at a 2mm-distance to metal surfaces, which makes them the ideal method to experimentally validate theoretical E-field models. In this study we present a theoretical model of the scattered E-field of stents and compare it to both E-field measurements and MR thermometry.Methods
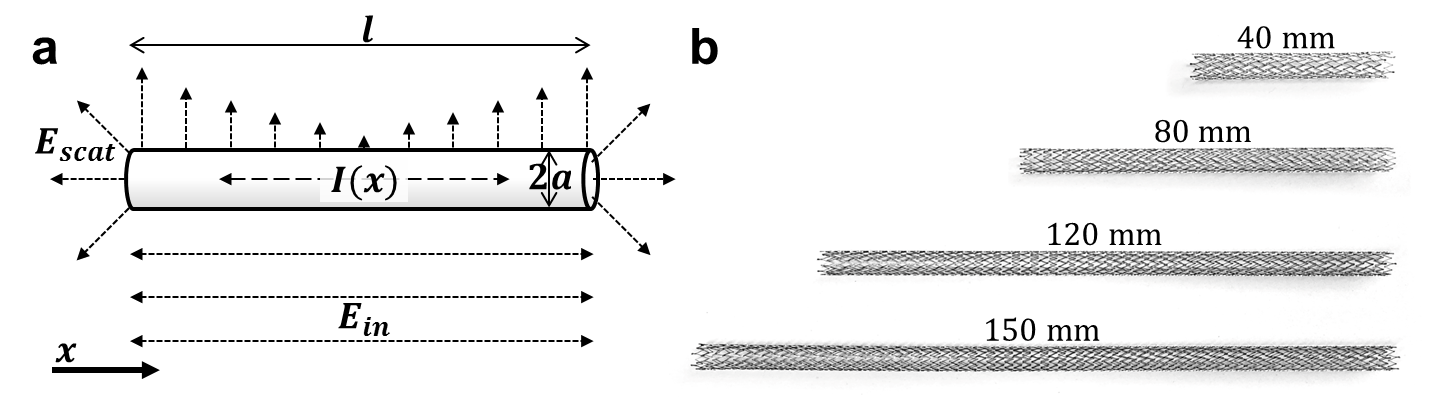
TheoryStents are modeled as cylinders that are exposed to an incident E-field Ein of the RF pulse (Fig. 1). The current induced on the cylinder surface can be found by solving Hallén’s equation
$$\frac{\mu}{4\pi}\underset{-l/2}{\overset{l/2}{\mathop\int}}\,I\left({{x}'}\right)~G\left(x-{x}',a\right)dx'=-i\omega\mu\epsilon~{{\left(\partial_{x}^{2}+{{k}^{2}}\right)}^{-1}}{{E}_{in}}$$with$$G\left(x-{x}',a\right)=\frac{1}{2\pi}\underset{0}{\overset{2\pi}{\mathop\int}}\,\frac{\exp\left(-ikR\right)}{R}d\varphi',~~~~R=\sqrt{{{\left(x-x'\right)}^{2}}+2{{a}^{2}}-2{{a}^{2}}\cos\varphi'}$$Here, a method-of-moments approach4 was used to numerically find I(x) and calculate the vector potential5
$${{A}_{x}}\left(r,x\right)=\frac{1}{8\pi}\underset{-\infty}{\overset{\infty}{\mathop\int}}\,{{J}_{0}}\left(a\sqrt{{{k}^{2}}-{{\zeta}^{2}}}\right)~H_{0}^{\left(2\right)}\left(r\sqrt{{{k}^{2}}-{{\zeta}^{2}}}\right)\left[\underset{-l/2}{\overset{l/2}{\mathop\int}}\,~I\left({{x}'}\right)\exp\left(i\zeta x'\right)~dx'\right]\exp\left(i\zeta x\right)~d\zeta$$From the vector potential, the radial component of the scattered E-field can be determined as$${{E}_{r}}=\frac{1}{i\omega \mu \varepsilon }{{\partial }_{r}}{{\partial }_{x}}{{A}_{x}}$$which can be measured by the E-field sensor (see below).
E-fields were calculated for stents with radius a=5mm and lengths of l=40,80,120,150mm at a distance of 2mm to the stent surface. Stent lengths were chosen around the expected resonance length at 3T of λ/2=135mm. The incident E-field was assumed to be uniform and parallel to the stents. To assess the influence of the frequently used sinusoidal approximation for the induced current6, E-fields were also calculated with
$${I}_{app}\left( x \right)=~\frac{{{E}_{in}}}{Z}-\frac{2{{E}_{in}}}{Z}\frac{\sin \left( kl/2 \right)}{\sin \left( kl \right)}\text{cos}\left( kx \right)$$
Experiment: E-field maps were acquired with a custom-built electro-optic sensor7 (EOS) of 4 Nitinol stents (Biotronik Pulsar-18) with the same dimensions as above. The stents were embedded in distilled water (ε=80) and the EOS was positioned at a distance of 2mm to the stent’s surface to measure Er along a planar grid with 0.75mm step width. For RF excitation a dipole antenna tuned to f1H(3T) = 124MHz was placed parallel to the stents at a distance of 11cm. Additionally, MR thermometry was performed at a clinical 3T system (Siemens TRIO). Stents were embedded in gel (31g/L Hydroxyelthycellulose, 1.55g/L NaCl8) and placed 12cm from the isocenter parallel to B0. Heating maps were acquired 2mm above the stent surface with a proton resonance frequency thermometry sequence9 with an off-resonant heating pulse10: TE/TR=12/23ms, FAimg=12°, FAheat=445°, 1.8x1.8x4mm³ resolution, TA=5.8s (100 repetitions), nominal whole body SAR: 4W/kg. After acquisition of a 20 baseline images, the heating pulse was turned on for 40 images followed by a cooling phase for 40 images.
Results
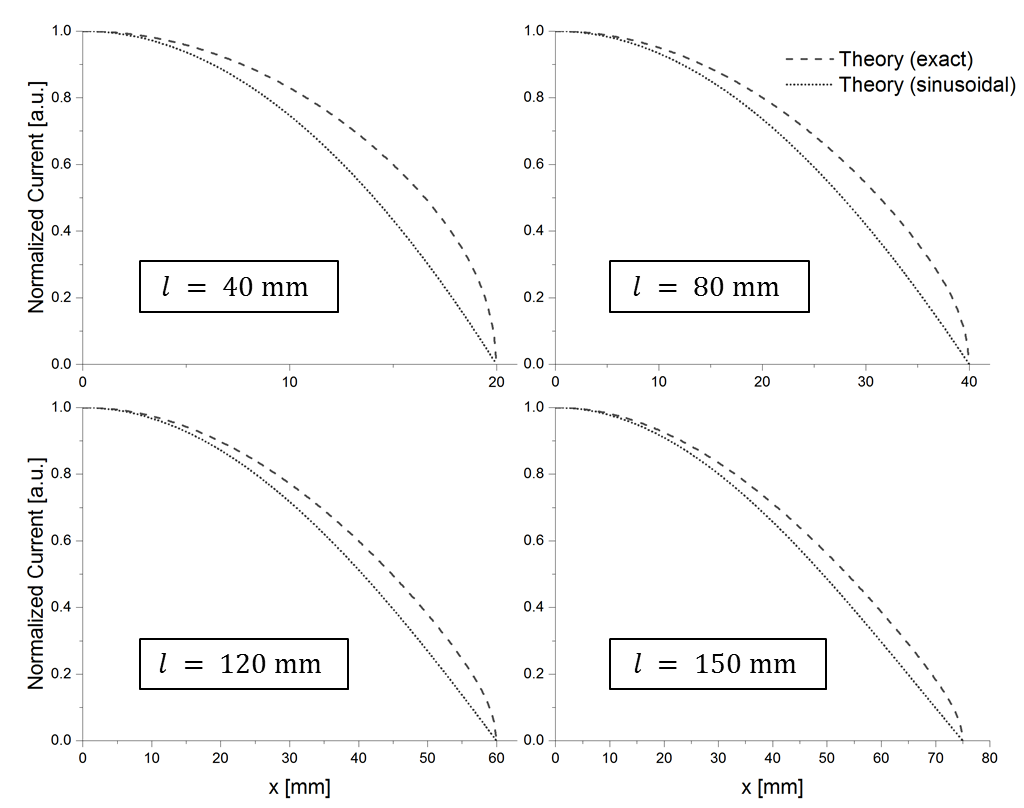
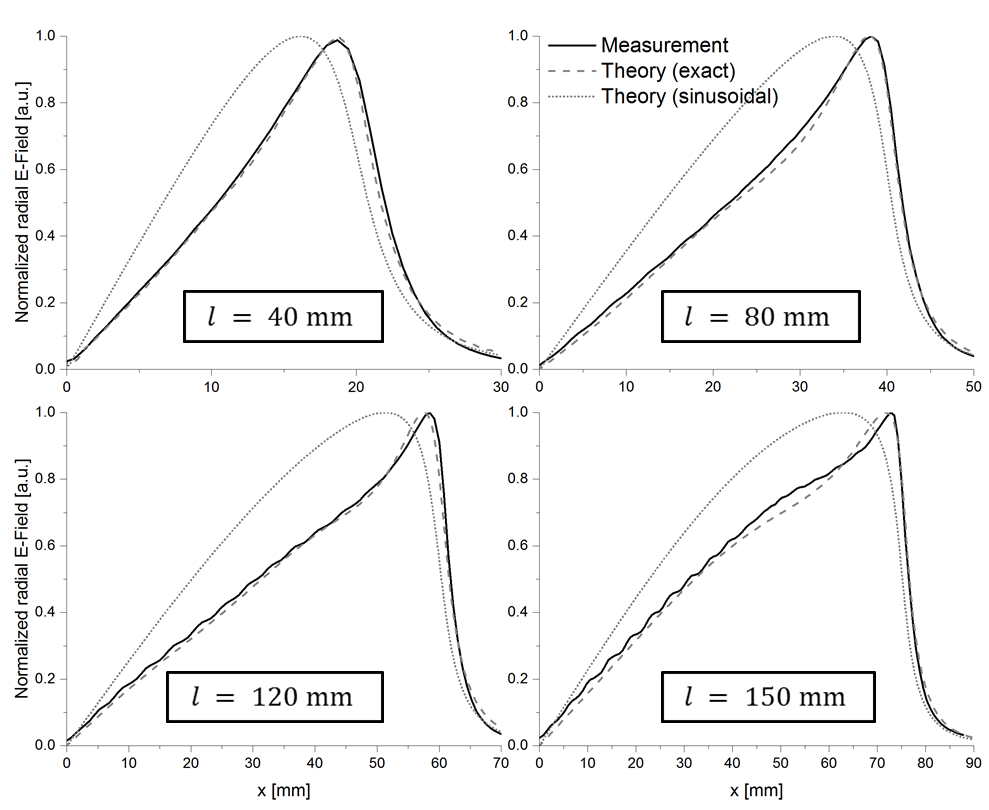
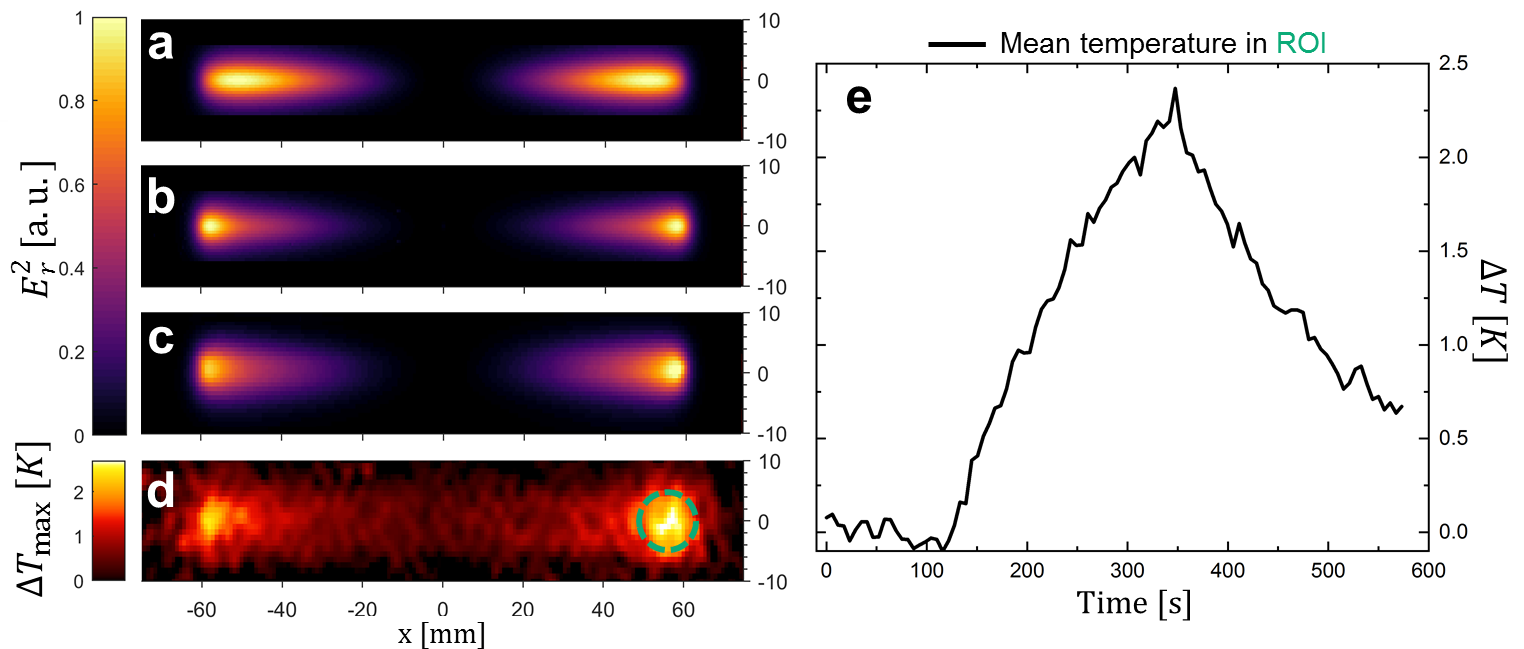
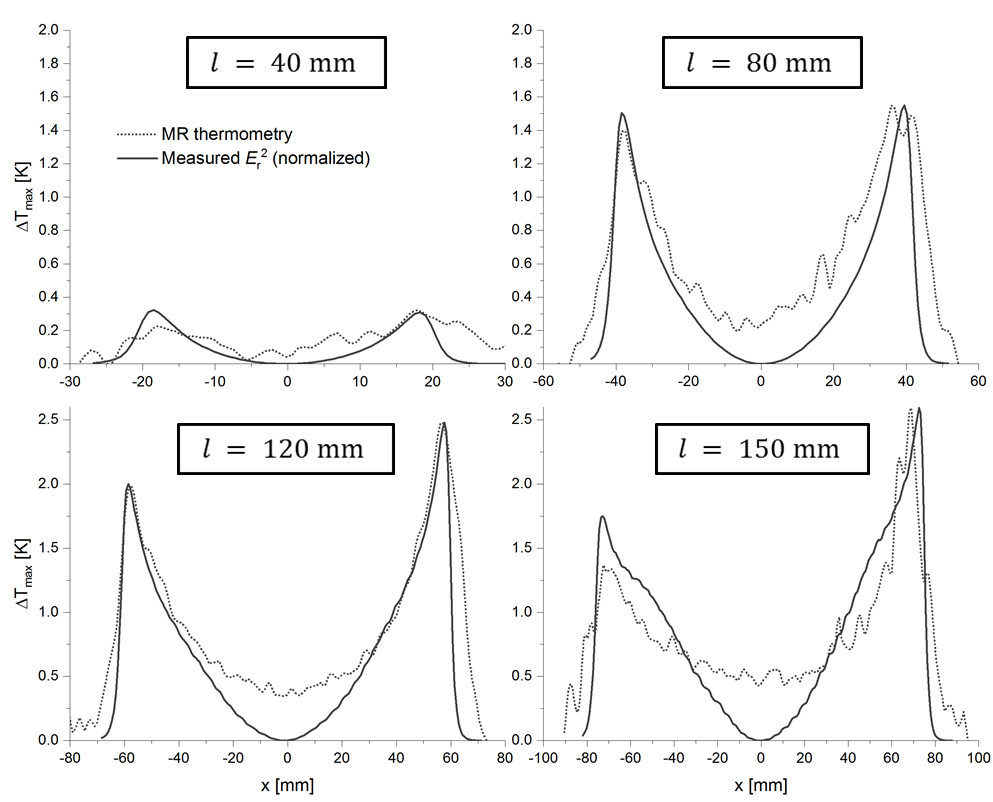
Figure 2 shows the calculated induced current in the stents for the exact solution and the sinusoidal approximation. The exact solution is more concave, and both solutions show the smallest deviation for longer stents. Theoretical Er fields along the stent centerline are compared to measured E fields in figure 3. Again, the field is better approximated by the exact solution (max. error: 5%) as compared to the sinusoidal current approximation (max. error: 40%), and the E-fields of the exact solution are in very good agreement with EOS measurement (R2>0.99 for all stent lengths). Figure 4 shows the calculated and measured Er2 maps of the 12 cm long stent as well as the maximum temperature measured with MR thermometry. MR thermometry is in good agreement with the heating pattern from both theoretical and measured E-fields, and a maximum heating of 2.5K is seen at both tips of the stent. The theoretical E-field predicts maximum heating at a position which is shifted towards the center of the stents and a smaller temperature gradient close to the maximum. Line plots of the measured Er2 as well as the maximum heating are presented in figure 5 for all four stents showing a good agreement in particular close the stent tips. With MR thermometry a temperature increase is observed at the center where the measured E-field which may be a result of the relatively thick imaging slice (4 mm) as well as the directional sensitivity of the E-field sensor.
Discussion and Conclusion
This study demonstrates that the scattered E-field patterns of stents can be precisely calculated from a theoretical model even at a few millimeter to the stent surface. The results indicate that an exact solution for the induced current is necessary to correctly predict the scattered E-field pattern and therefore positions of maximum heating. A sinusoidal approximation of the induced current leads to substantial systematic errors of the E-field pattern in particular for short stents and at small distances to the stent’s surface. With this theoretical prediction, an arbitrary incident E-field can be chosen to calculate the induced current to account for the B1 profile of the transmit coil. The agreement between the calculated and measured E-field patterns shows that the EOS is a valuable tool for the validation of theoretical models as well as numerical simulations of the heating of medical implants. In addition, it can be used for the efficient assessment of the heating potential of medical implants which is demonstrated here by comparing the E-field measurements to MR thermometry.Acknowledgements
No acknowledgement found.References
1. Winter L, Oberacker W, Oezerdem C, et al. On the RF Heating of Coronary Stents at 7.0 Tesla MRI. Magn. Reson. Med. 2015; 74:999–1010
2. Reiss S, Bitzer B, Bock M. An optical setup for electric field measurements in MRI with high spatial resolution. Phys. Med. Biol. 2015;60(11):4355
3. Saniour I, Gwenael G, Perrier AL. Electro-optic probe for real-time assessments of RF electric field produced in an MRI scanner: Feasibility tests at 3 and 4.7 T. NMR in Biomedicine 2017;31:e3849
4. Orfanidis SJ. Electromagnetic Waves and Antennas. Rutgers University 2016
5. Balzano Q, Garay O, Siwiak K. The near field of dipole antennas, part I: Theory. IEEE Trans. Veh. Technol. 1981;30(4):161-74
6. Acikel V, Atalar E. Modeling of radio-frequency induced currents on lead wires during MR imaging using a modified transmission line method. Medical Physics. 2011;38(12):6623-32
7. Reiss S, Lottner T, Oezen AC. Electro-Optic E-field Mapping of Medical Implants with High Spatial Resolution: Resonant Excitation of Metallic Stents. ISMRM 2018
8. ASTM standard F 2182-2011a, 2011. ASTM 2182 Standard test method for measurement of radio frequency induced heating near passive implants during magnetic resonance imaging. ASTM Int. 1–14
9. Ehses P, Fidler F, Nordbeck P, et al. MRI Thermometry: Fast Mapping of RF-Induced Heating Along Conductive Wires. MRM 2008;60(2):457–61
10. Quesson B, de Zwart JA, Moonen CT. Magnetic resonance temperature imaging for guidance of thermotherapy. JMRI 2000;12(4):525–33
Figures