4199
RF Heating of a 64-Channel Implantable Electrode Grid: Simulation and Temperature Measurements1Dept. of Radiology, Medical Physics, Medical Center – University of Freiburg, Faculty of Medicine, University of Freiburg, Freiburg, Germany, 2Department of Microsystems Engineering—IMTEK, University of Freiburg, Freiburg, Germany, 3German Consortium for Translational Cancer Research Partner Site Freiburg, German Cancer Research Center (DKFZ), Heidelberg, Germany, 4CorTec GmbH, Freiburg, Germany
Synopsis
Active implantable medical devices (AIMD) can restore body function in patients with neurological or other disorders which increases their quality of life considerably. In this work we measure RF-induced heating by MRI thermometry in combination with FOTP measurements and simulations and apply it to a 64-channel electrode grid. The combination of MR thermometry with high spatial resolution, FOTPs with high thermal resolution and supplementary simulations of electromagnetic and thermal processes shows how limitations of the individual methods are overcome and result in a more comprehensive understanding of the thermal dynamics resulting from the exposure of implants to RF-fields.
Introduction
Active implantable medical devices (AIMD) can restore body function in patients with neurological or other disorders which increases their quality of life considerably. Unfortunately, patients with AMIDs are exposed to a significant safety hazard during an MRI exam, as the radio-frequency (RF) fields can couple resonantly to the metallic structures of the AIMD resulting in tissue heating. To ensure patient safety, AIMDs are tested with temperature measurements using fiber-optic temperature probes (FOTP)1. This method is tedious for high-channel-count implants (e.g., 64-channel intracranial (ic) EEG electrode grids), since FOTP systems only have 4-8 sensors. To overcome this, the most relevant electrodes may be identified by simulating the scattered fields that are associated with tissue heating according to ISO‑TS‑109742. It has recently been shown, that MR thermometry is possible in the vicinity of planar electrodes, so that heating information can be directly extracted from a rapidly acquired temperature map. In this work we measure RF-induced heating by MRI thermometry in combination with FOTP measurements and simulations and apply it to a 64-channel electrode grid.Methods
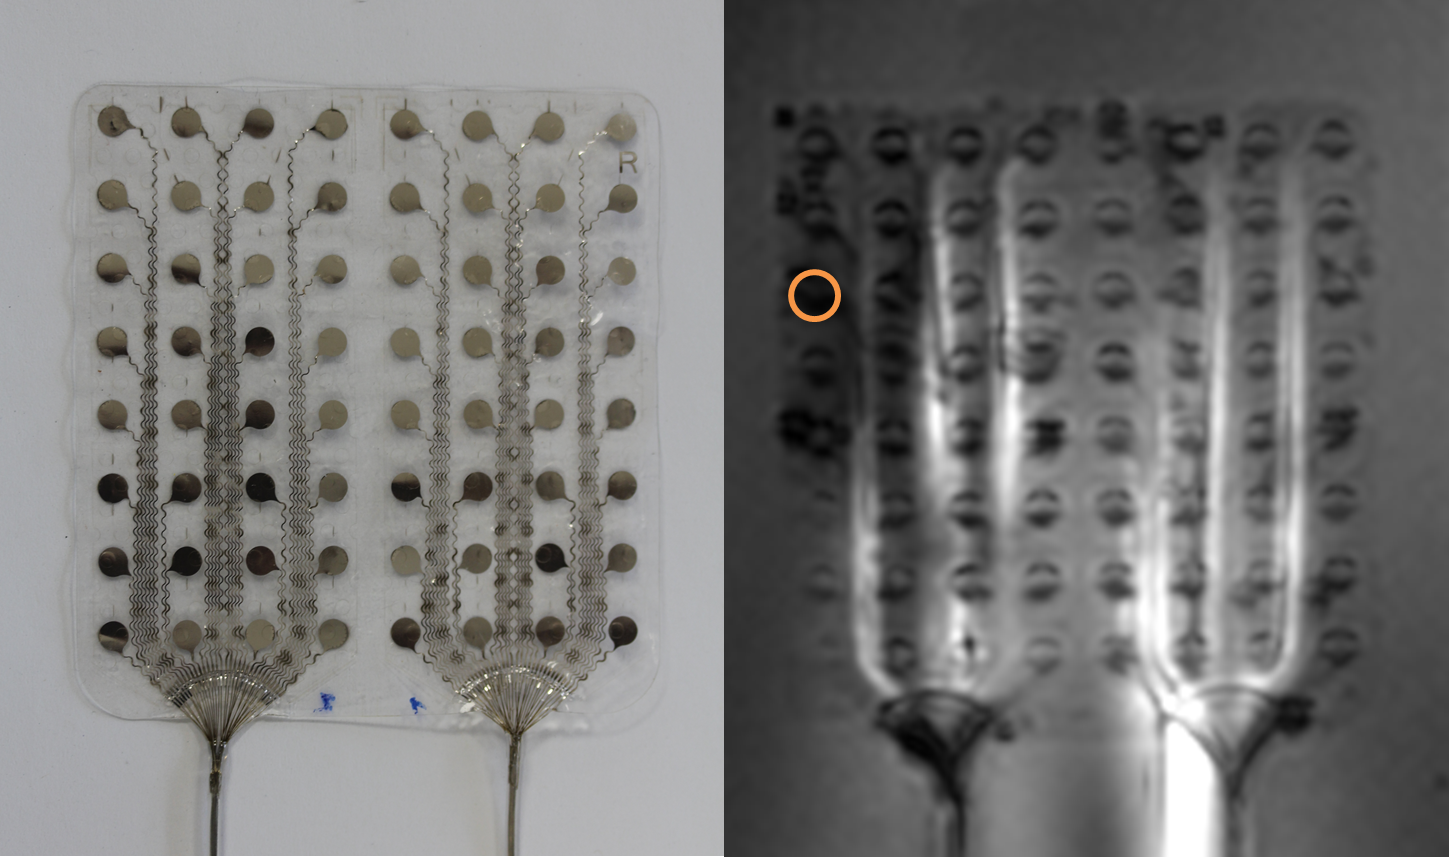
A commercially available °AirRay Cortical Electrode (CorTec GmbH, Germany) with 8x8=64-channels made of 25µm thick Pt90/Ir10 (Figure 1), where each electrode contact (opening diameter: 2.7mm) on the grid with silicone rubber substrate was connected via metal tracks to a 45cm-long cable was placed on an acrylic-glass sample holder with the leads parallel to B0 and off-center (Dx = 21cm) in a phantom (15x15x50cm) filled with HEC gel (31g/L Hydroxyelthycellulose, 1.55g/L NaCl1). Heating was measured in a clinical 3T MRI system (Magnetom TRIO, Siemens Healthineers, Erlangen, Germany) using a proton resonance frequency (PRF) thermometry sequence3 with an off-resonant RF pulse for heating4. The following parameters were used: TE/TR = 10/21 ms, αimaging = 11°, αheating = 380°, 1.6x1.6x4 mm³ resolution, TA =5.6 s x 80 repetitions = 7.5 min, nominal whole body SAR: 4 W/kg. The heating pulse was active for 6min followed by a 1 min cooling period. The lower bound of the PRF imaging slice was placed 4mm above the electrodes, and temperature change maps were calculated from the difference between 15 baseline images and phase maps acquired during heating. Additionally, temperature was measured using a FOTP (FOTEMP9-16 Optocon AG, Dresden, Germany) placed 2 mm above the electrode contact with the highest temperature change that was seen in preliminary PRF thermometry measurements. Furthermore, different immersion lengths of the implant cables (fully immersed (45cm), 41, 37, 33cm immersion) were measured. Electro-magnetic FDTD simulations were performed using a single electrode contact in Sim4Life (Version 5.0, ZMT-AG, Zurich, Switzerland). The resulting SAR values were further used to simulate thermal behavior, where the input power was scaled to minimize the difference between FOTP/Thermometry dynamics and maximum temperature changes for the corresponding location in the simulationResults
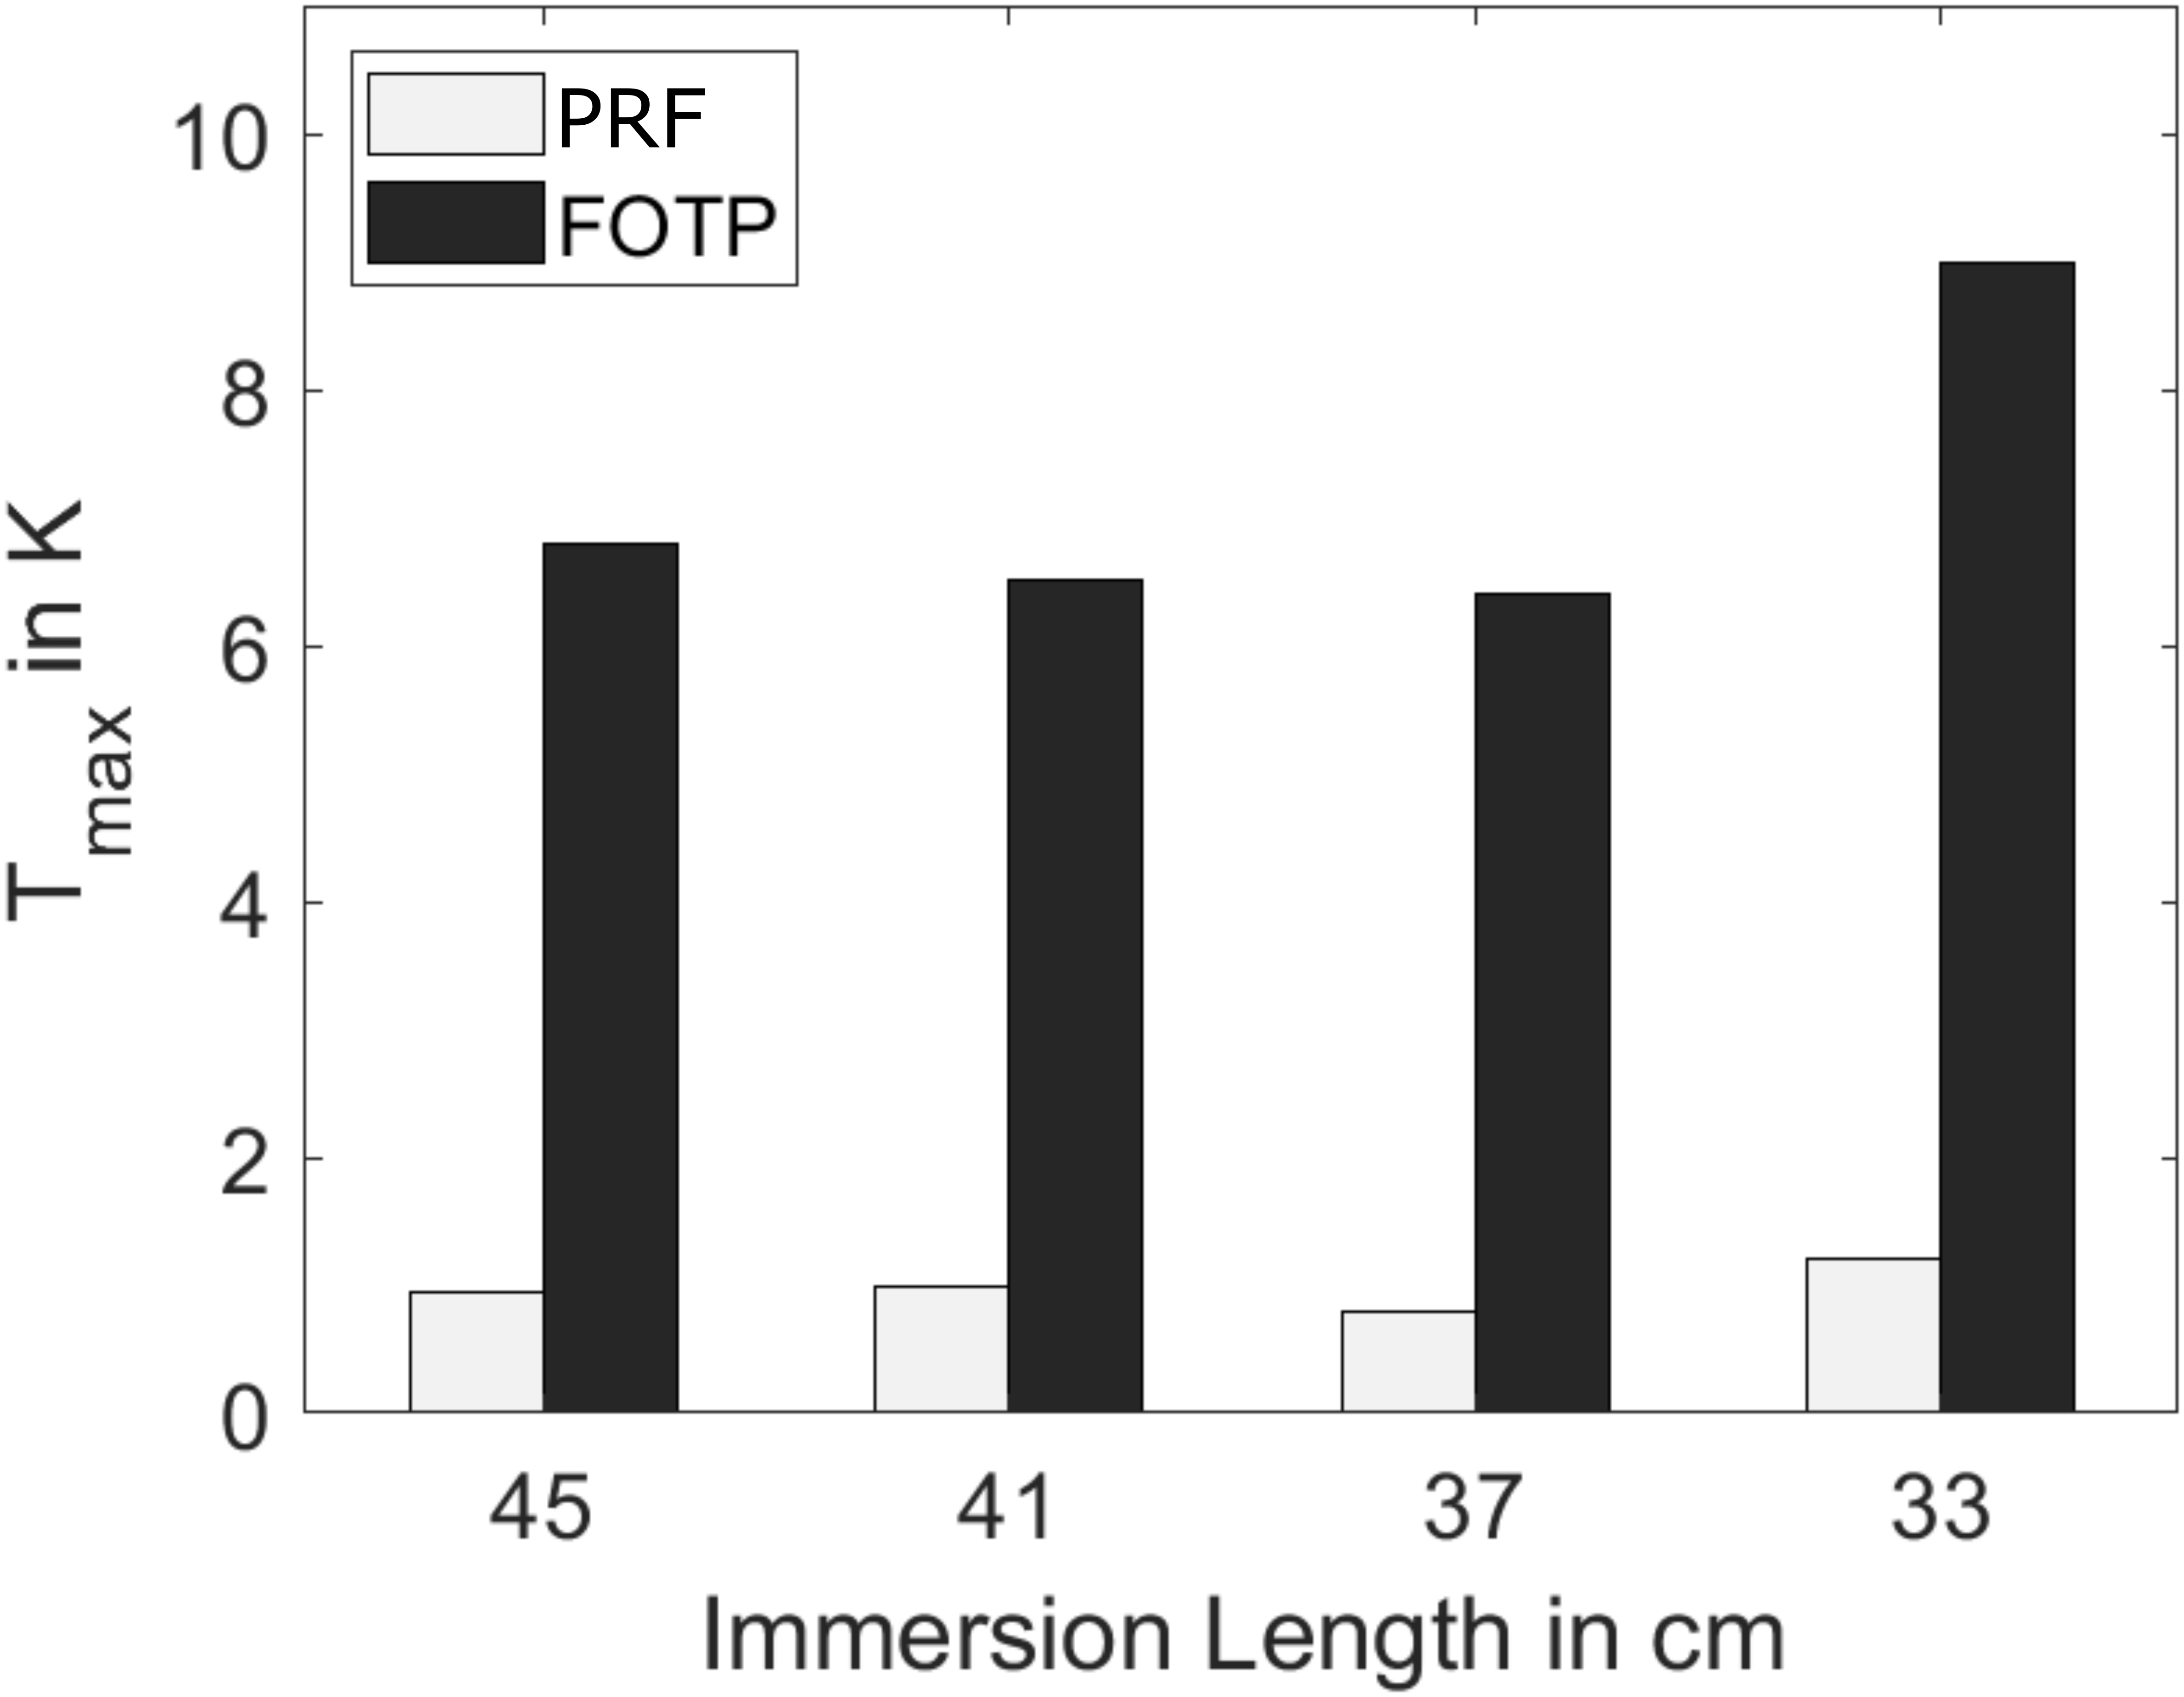
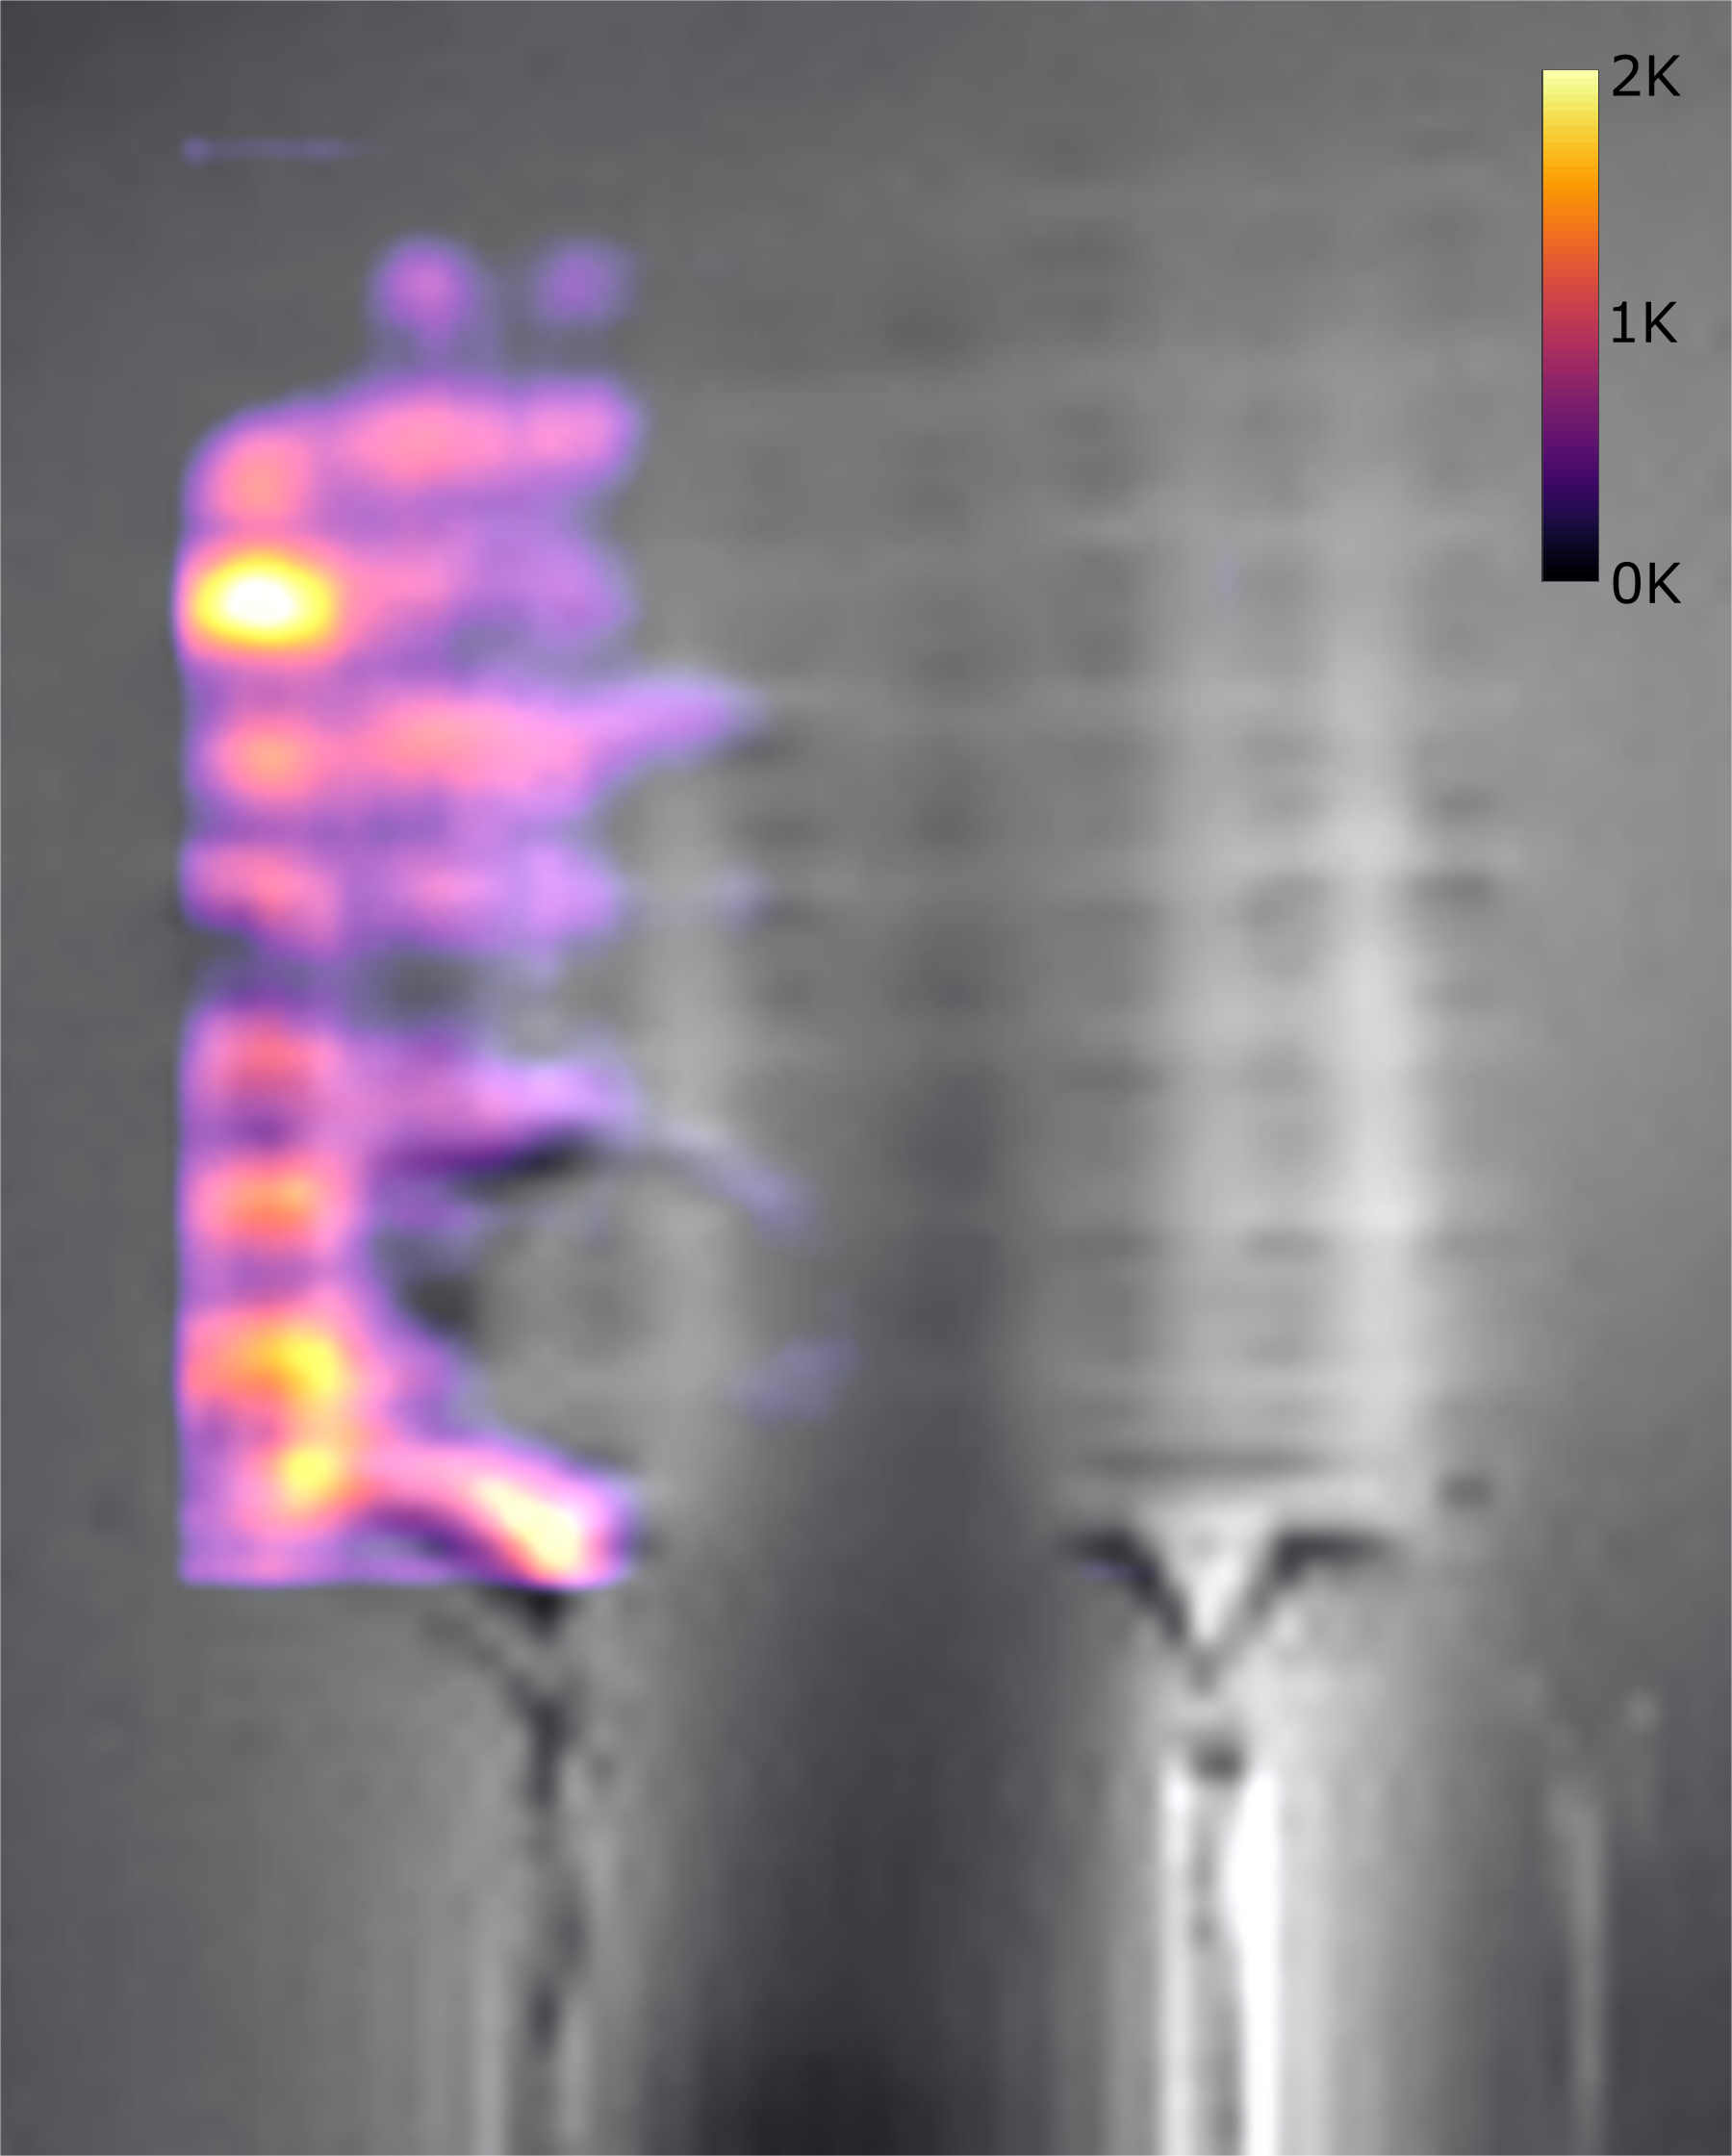
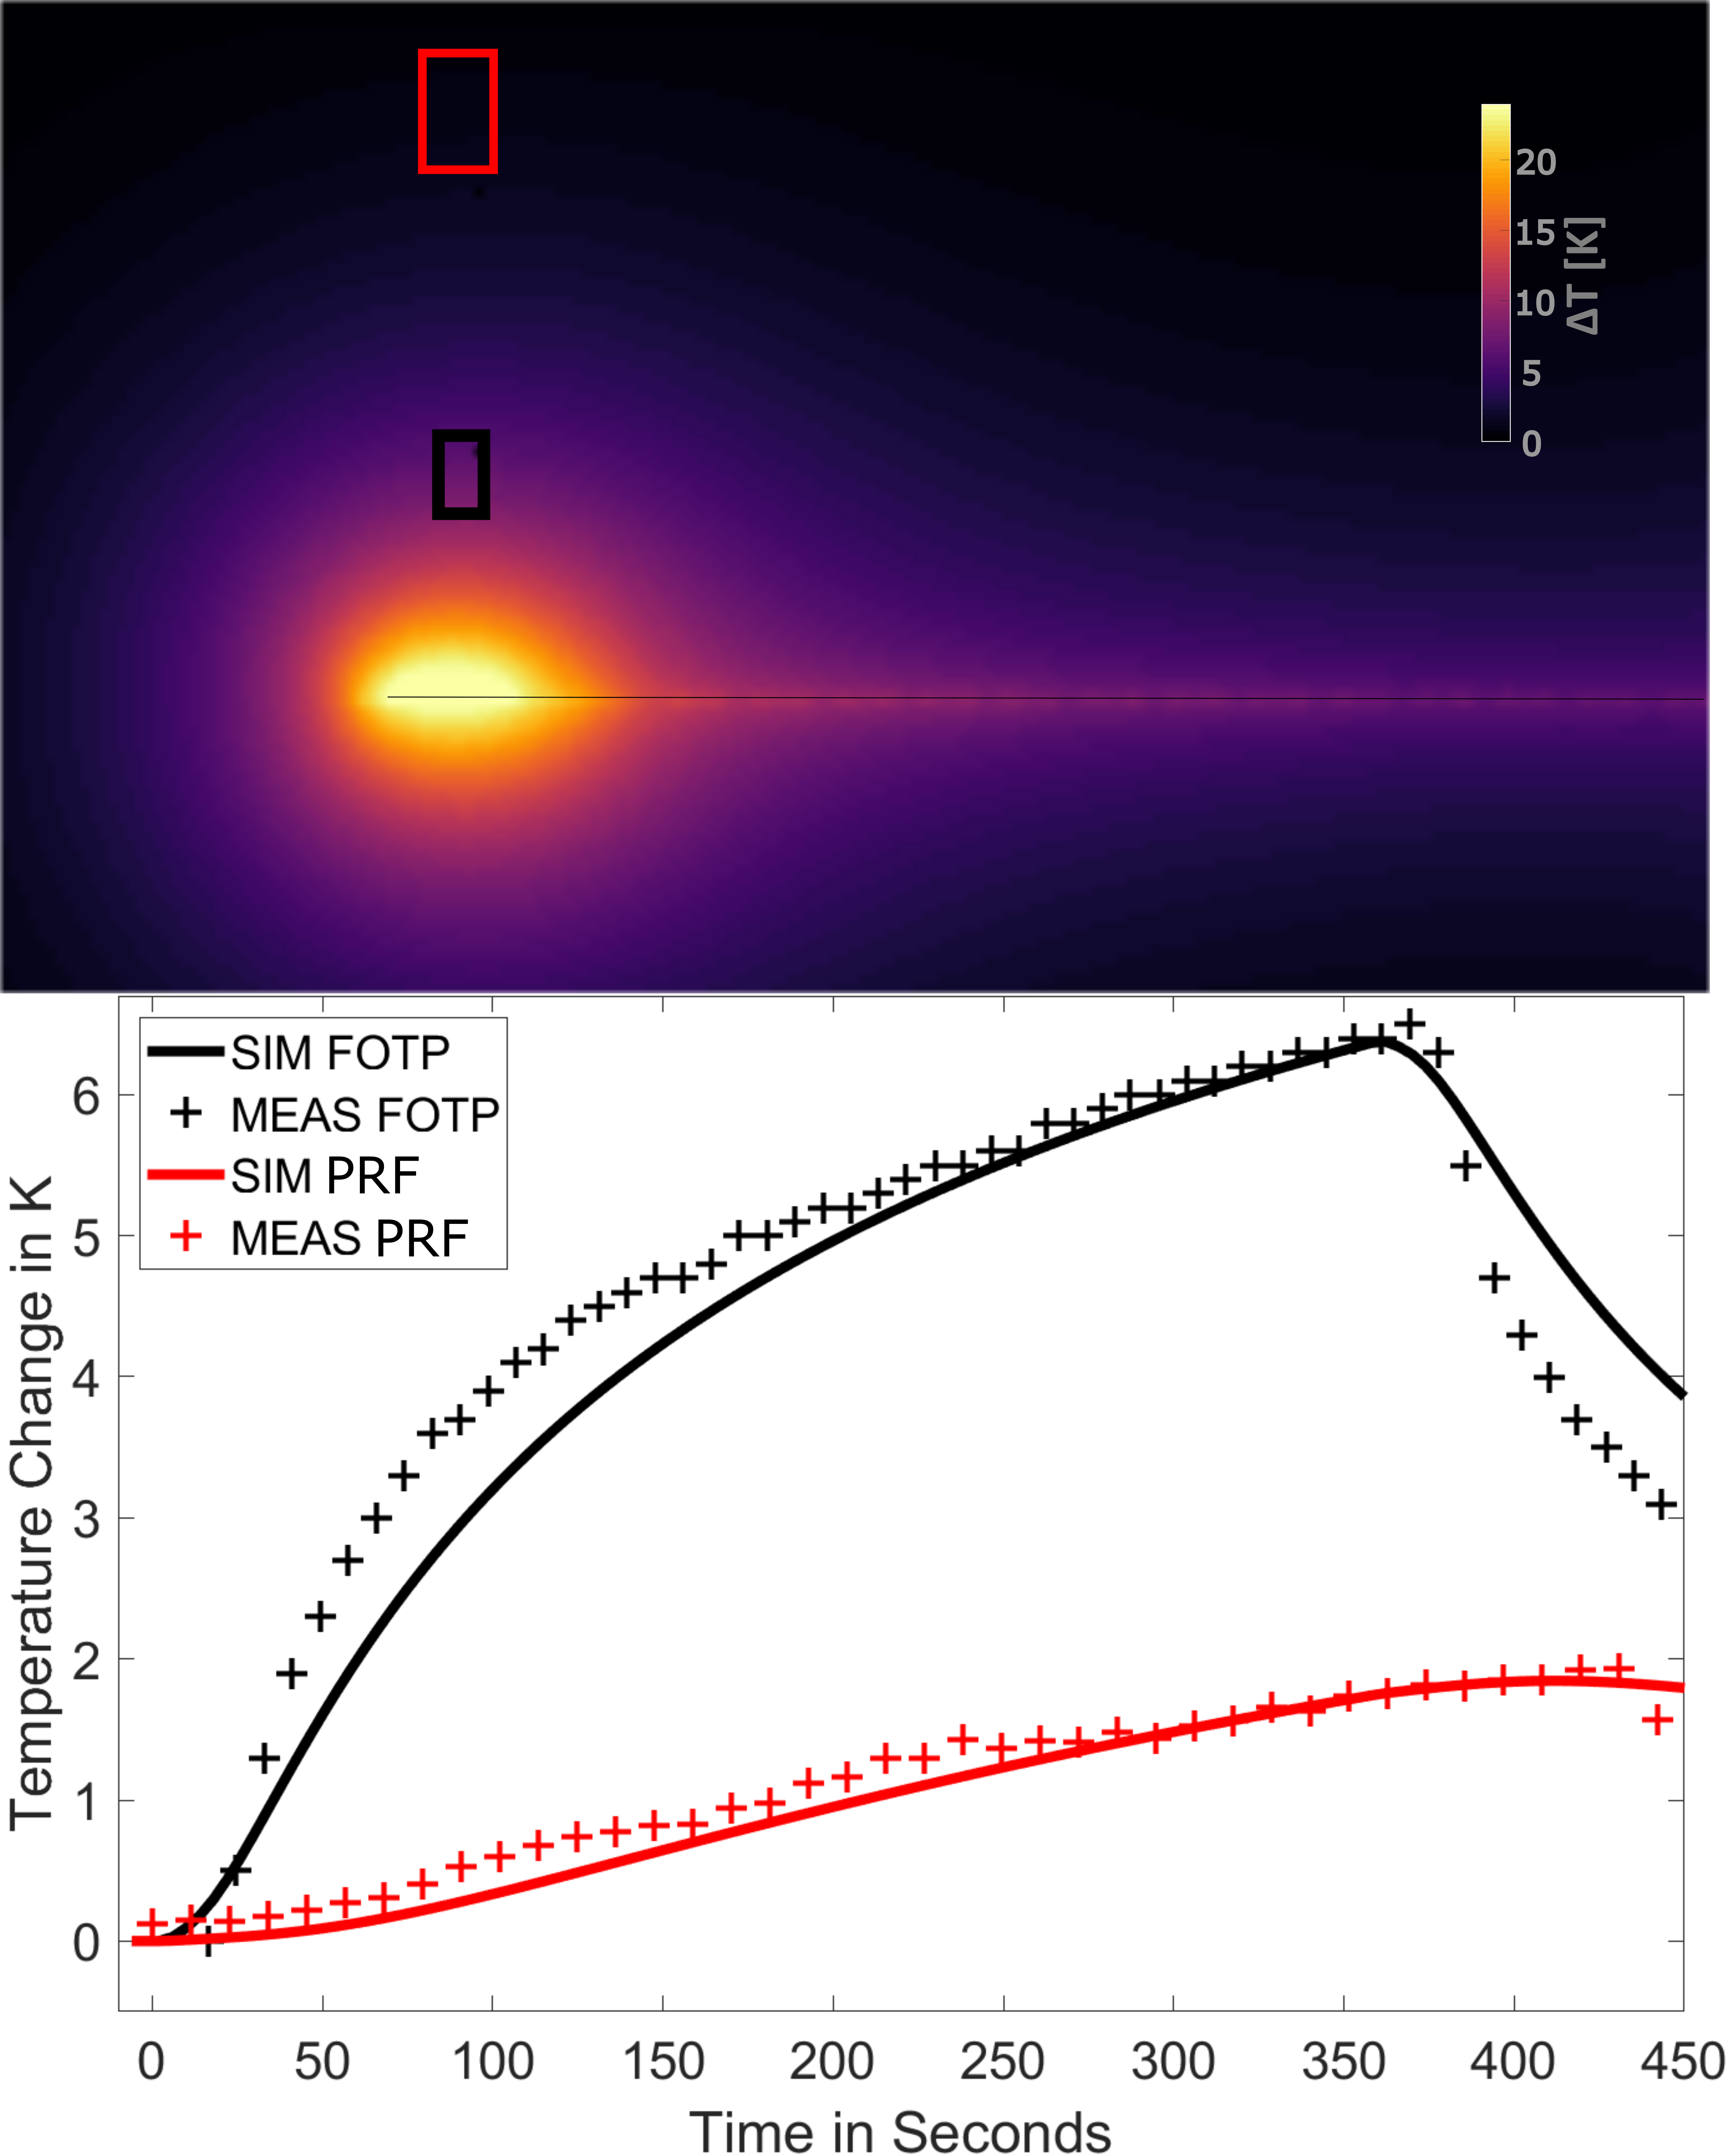
Figure 2 shows the maximum temperature changes over time ΔTmax, which were located above the electrode marked in Figure 1. ΔTmax, is largest for the immersion length of 12cm in air. Comparing ΔTmax, for FOTP and PRF shows a R2=0.88 with a scaling factor of 6.58. Figure 3 shows an MRI image of the electrode with an overlay indicating the temperature increase in a slice 4mm above the electrode (immersion length 12cm). The dissipation of heat concentrates around the electrode contacts and shows an increase towards the left side of the implant. Figure 4 shows a slice perpendicular to the electrode of simulated ΔTmax, with a resolution of 0.2x0.2x0.2mm3. Indicated simulated ΔT-t curves of the FOTP and PRF show good agreement with the measurements.Discussion
This study shows that simultaneous heat measurement of 64 individual electrode contacts is feasible. The visible asymmetry of the heat dissipation in Figure 3 can be attributed to the positioning relative to the body coil. All temperature measurements and simulations show the expected behavior. The difference in the maximum temperature between FOTP and MR thermometry can be attributed to differences between MR and FOTP position. FOTP measurements are characterized by high temporal (0.1 samples/s) and thermal resolution (0.1K), but are limited by the number of sensors and hence spatial resolution. Here, MR thermometry can be used to cover a whole implant with millimeter resolution and a temperature resolution of about 1K . Although this temperature resolution may not be sufficient for safety assessment, which requires a temperature sensitivity well below 1K, it may help to locate hot spots at which the FOTP should be placed.Conclusion
The combination of MR thermometry with high spatial resolution, FOTPs with high thermal resolution and supplementary simulations of electromagnetic and thermal processes shows how limitations of the individual methods are overcome and result in a more comprehensive understanding of the thermal dynamics resulting from the exposure of implants to RF-fields.Acknowledgements
We gratefully acknowledge support for Sim4Life by ZMT, www.zurichmedtech.comReferences
1ASTM standard F 2182-2011a, 2011. ASTM 2182 Standard test method for measurement of radio frequency induced heating near passive implants during magnetic resonance imaging. ASTM Int. 1–14
2ISO, "ISO TS 10974: Assessment of the safety of magnetic resonance imaging for patients with an active implantable medical device," International Organization for Standardization, Geneva, Switzerland; 2012.
3Ehses P., et al, 2008 MRI Thermometry: Fast Mapping of RF-Induced Heating Along Conductive Wires, MRM, 60:457–461
4Quesson B., et al, 2000. Magnetic resonance temperature imaging for guidance of thermotherapy. JMRI 12, 525–533
Figures