4197
Multi-Physics Co-Simulation of Heating Due to Transcranial Direct Current Stimulation at 3T1Neurophysics, Max-Planck-Institute for Human Cognitive and Brain Sciences, Leipzig, Germany, 2Neurophysics, Max Planck Institute for Human Cognitive and Brain Sciences, Leipzig, Germany, 3Nuclear Magnetic Resonance Unit, Max Planck Institute for Human Cognitive and Brain Sciences, Leipzig, Germany
Synopsis
We modelled RF-induced power deposition and temperature rise at 3T due to presence of standard tDCS equipment using an high resolution human head and torso model. The influence of gel pad geometry on the power deposition was analysed. Our case study provided strong evidence that (i) the tDCS setup has a relevant impact on temperature rise at skin in proximity of tDCS electrode edges at 3T, (ii) assessing temperature rise due to presence of the tDCS setup using one or a few temperature probes located in gel at arbitrary positions cannot be considered as a reliable procedure.
Introduction
An increasing number of MRI investigations to study the human brain employ multi-modal setups, where additional devices are used to record complementary information or to manipulate brain states. In the case of transcranial direct current stimulation (tDCS) this entails two external wires with an electrode each and high-conductivity gel to ensure good contact to the human skin. RF-induced heating of tissues near tDCS electrode is a potential problem for subjects undergoing MRI. Goals of the current study were: (i) to calculate RF-induced temperature rise at 123.2MHz in a high-resolution human head and torso model positioned in the body coil, in presence of standard tDCS equipment labeled MR “conditional”; (ii) to evaluate the influence of different gel distributions on the temperature riseMethods
The simulated whole-body coil was a 16-rung high-pass birdcage of equivalent design as widely used in clinical 3T scanners (inner diameter 615mm; total length 480mm). The coil was shielded by a metal enclosure that mimicked a 1220mm-long scanner bore. The high-resolution human head and torso model was developed in previous work [1]. Keeping the external dimensions, the original human model was modified by defining skin and fat layers of 2 mm thickness each (Fig. 1a-b). Electrical and thermal properties of human tissues were adopted from the IT’IS database [2]. The tDCS setup consisted of two quadratic electrodes, two leads, and a metal connection box located 410mm away from the coil enclosure (see Fig. 1c). Two gel patch geometries were investigated: quadratic and quadratic with chamfered corners (Fig. 1d-e). The model head was positioned in the coil’s isocenter. The coil was tuned, matched, decoupled and excited as described previously [3]. The multi-physics evaluation was based on RF-circuit (ADS Keysight, Santa Clara, CA, USA), 3D-EM (HFSS ANSYS, Canonsburg, USA) and thermal co-simulations (NLT ANSYS, Canonsburg, USA). The initial temperature for both the gel pad and the human tissues was 37°C. The computational meshes of the 3D-EM and thermal domains were independently generated in each solver to ensure the best suitable mesh for each simulation modality. The RF exposure was continuous for 540s. As a reference, the simulation was repeated without the tDCS setup. All results were normalized to obtain a head specific absorption rate (headSAR) of 3.2W/kg.Results and Discussion
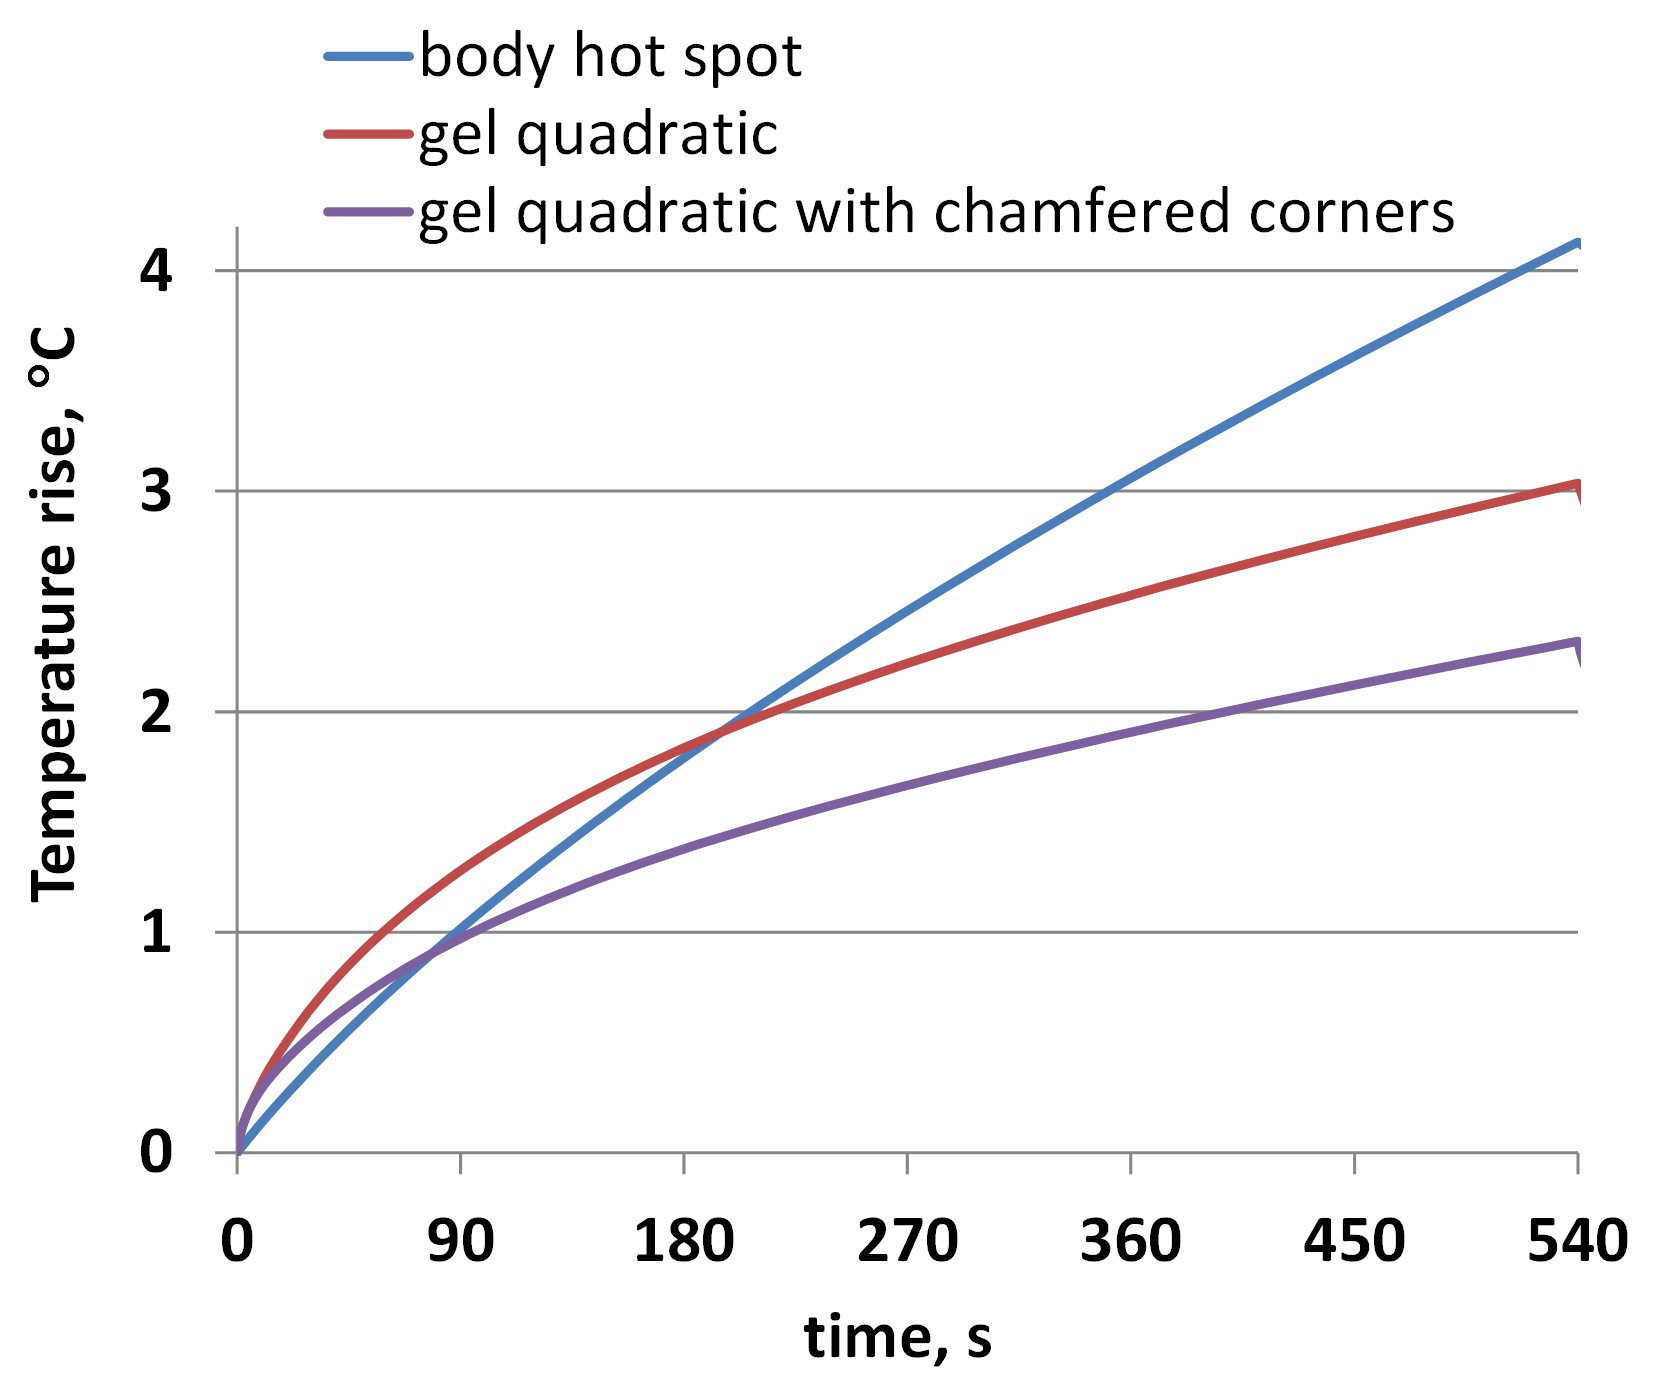
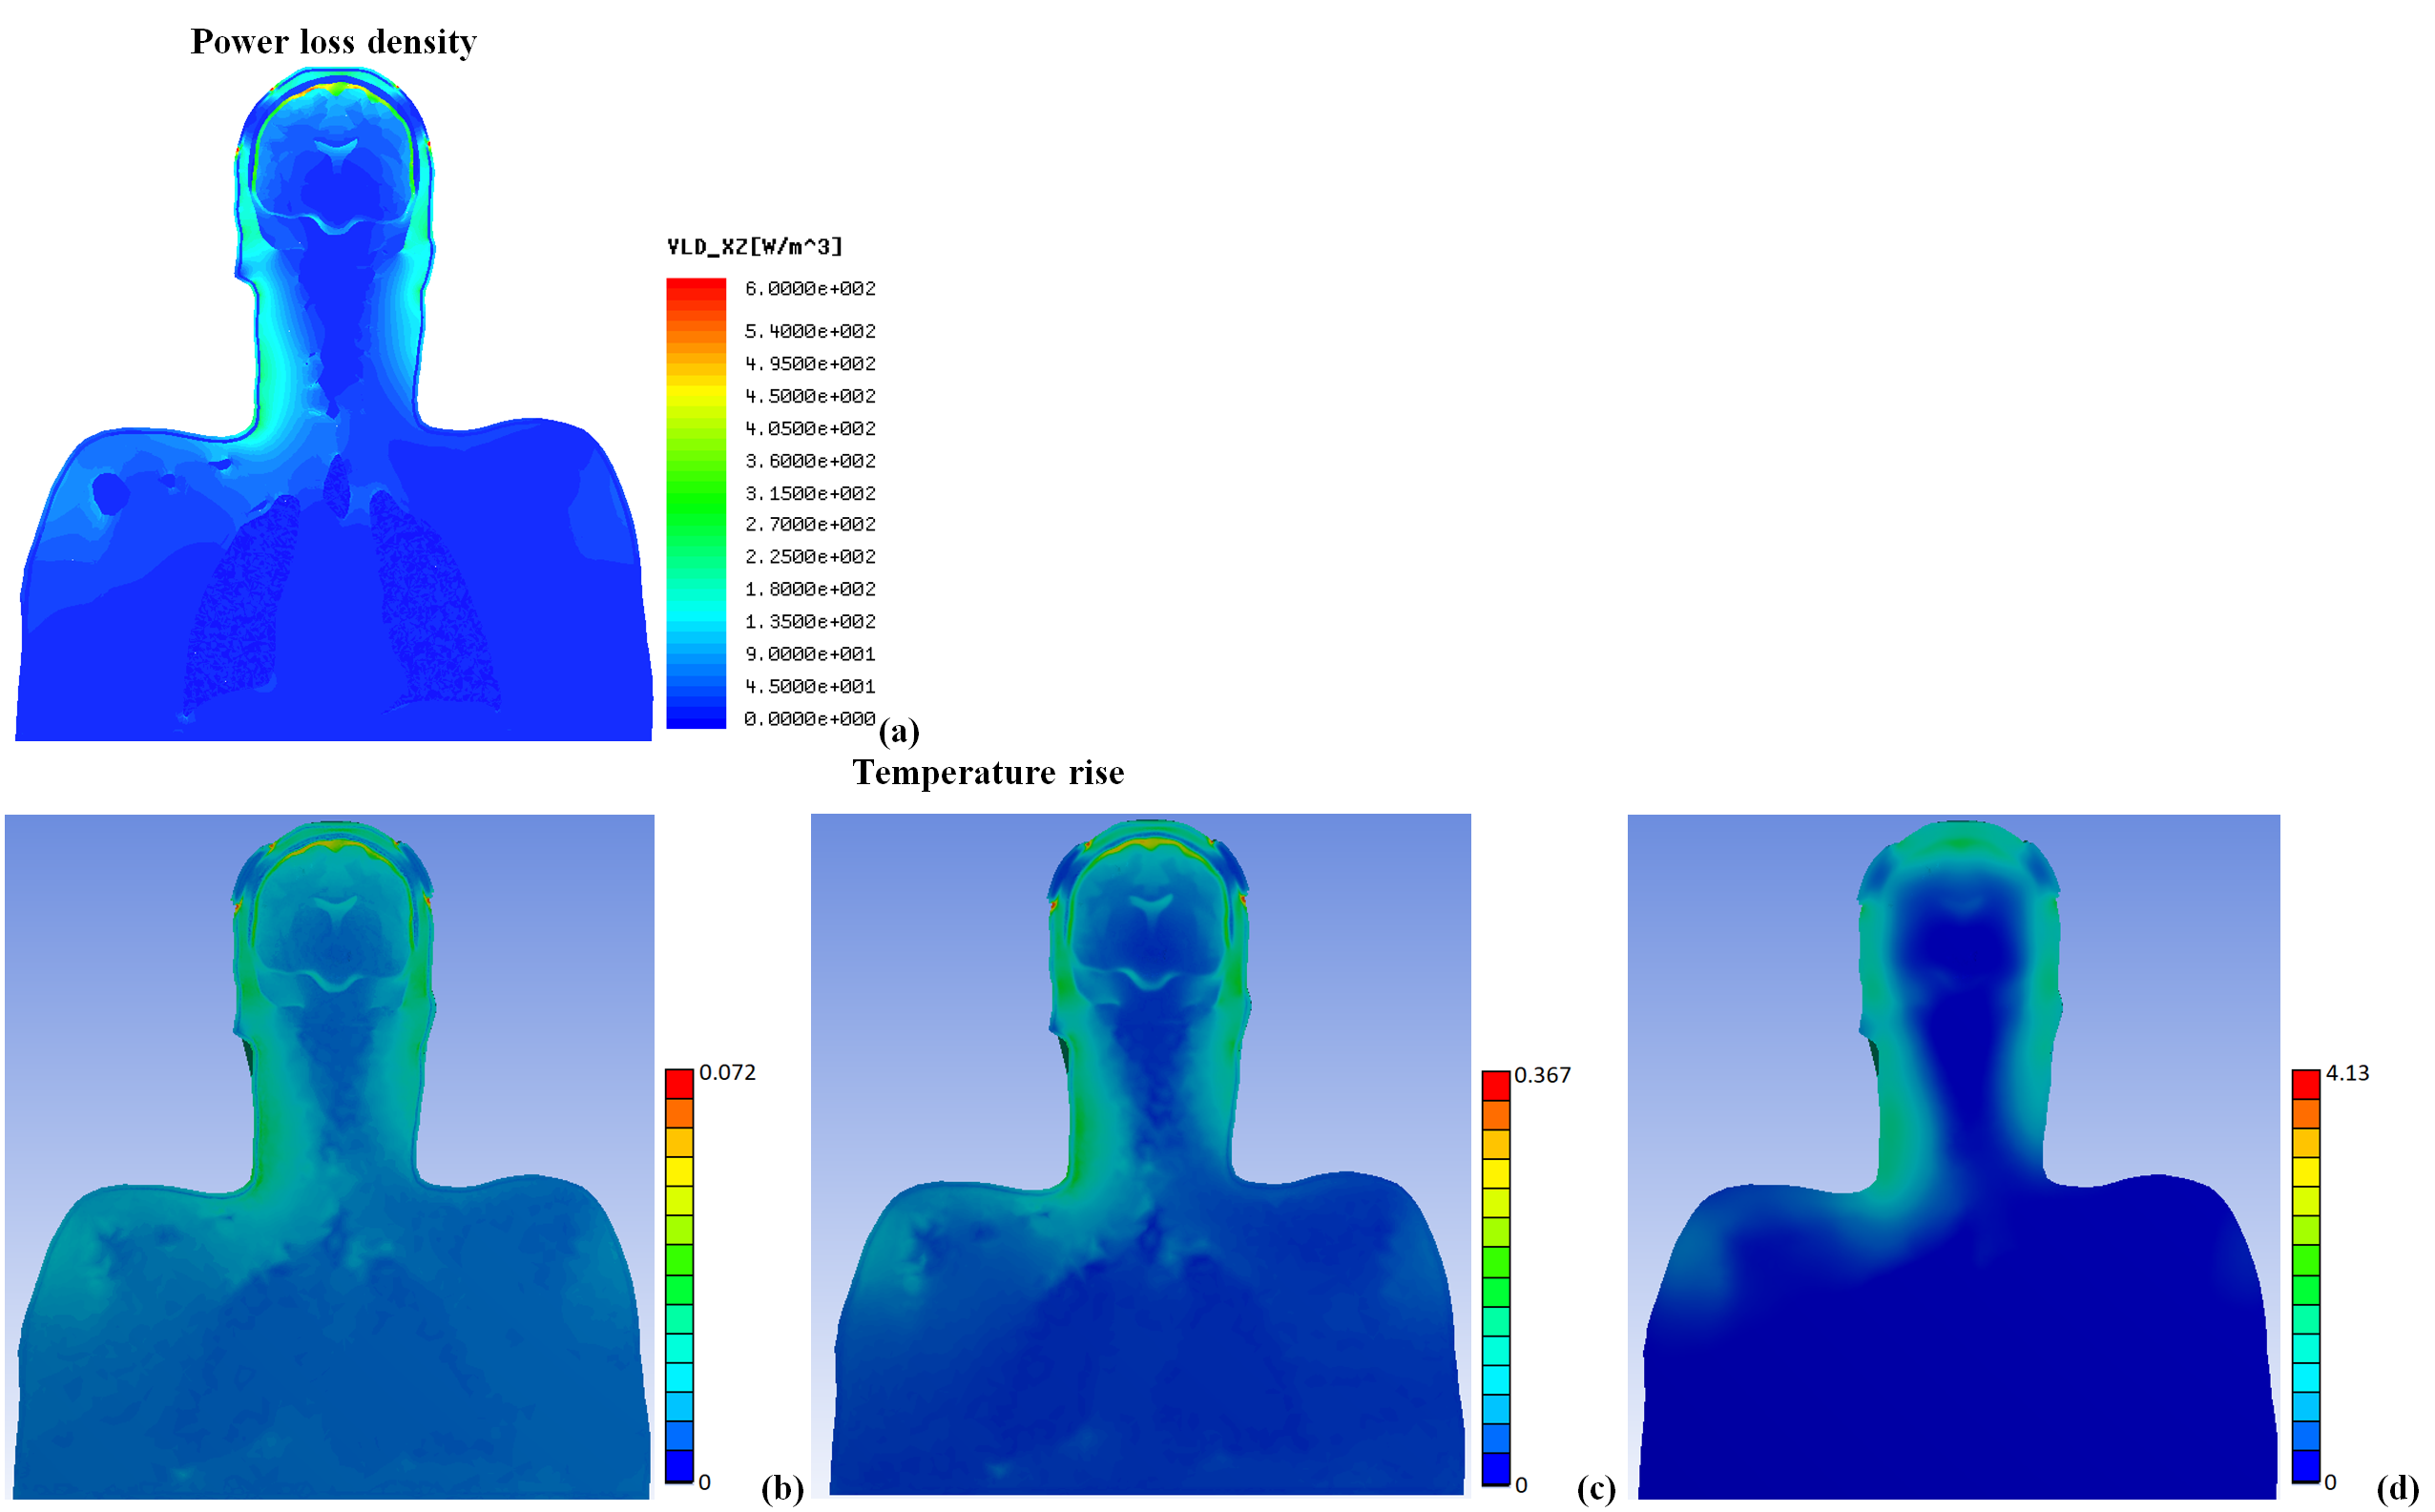
Our observations included: (i) A substantial influence of the gel pad shape on the temperature rise in proximity of the electrode (Fig.2a). (ii) A wide range of temperature rises (<1°C to 3°C) after 540s of RF exposure at different locations in the gel and at the skin surface in contact with the pad. (iii) Only a small portion of the gel was heated by 3°C (Fig.2b). (iv) The skin area with the highest temperature rise was not in contact with the gel (Fig.2c). These observations seem to challenge the reliability of current procedures to assess temperature using only a few probes at arbitrary positions in the gel. A temperature rise due to tDCS was visible up to a depth of approx. 4mm from the skin (Fig.2d). At the muscle surface, the temperature increase was approx. 1°C less than that on the skin surface (Fig.2e). Modelling without the tDCS setup confirmed that a hot spot generated by RF from the birdcage coil was located below the left eye (Fig.3a), and that its location and thermal behavior were not affected by the tDCS setup. The thermal time constant was larger at the hot spot than at the gel pad (Fig.4). Importantly, the temperature rise at the hot spot exceeded that at the gel pad after 540s of RF exposure, whereas the opposite result was obtained for exposure times below 200s. Note that cerebrospinal fluid (CSF) possesses a relatively high conductivity and acts as a weak screen to RF exposure [4], resulting in enhanced power deposition inside CSF and a slightly reduced RF transmit field in the intracranial volume. However, this did not result in a significant high temperature increase after 540s of exposure (Fig.5). Due to high thermal conductivity of surrounding tissues the deposited power was redistributed in a large volume so that temperature rise was similar in these tissues. Inclusion of blood perfusion in modelling approach will further smooth temperature rise in intracranial volume. However the blood perfusion in the skin is significantly smaller than blood perfusion in intracranial tissues. Thus, reduction of temperature rise in close proximity to the tDCS electrode is expected to be at moderate level. A modest level of blood perfusion is expected in areas below the eyes because practically perfusion is practically zero in the skull.Conclusion
Our simulations provide evidence that (i) the tDCS setup may lead to an additional temperature rise in the skin; (ii) a temperature rise above 2°C might result under conditions of minimal perfusion, (iii) a reliable measurement of the temperature rise due to tDCS is challenging. Future work should include (i) simulations with additional consideration of a suitable perfusion model; (ii) experimental validation of the numerical findings. While our results were for realistic conditions for commercially available equipment, it is to note that they cannot be readily generalized because only a single coil geometry and a single tDCS device were included in our investigation.Acknowledgements
No acknowledgement found.References
[1] Kalloch, B., Bode, J., Kozlov, M., Pampel, A., Hlawitschka, M., Sehm, B., Villringer, A., Möller, H. E., Bazin, P.‐L. (2019) Semi‐automated generation of individual computational models of the human head and torso from MR images. Magnetic Resonance in Medicine, 81(3), 2090-2105.
[2] Hasgall, PA, Di Gennaro, F., Baumgartner, C.,
Neufeld, E., Gosselin, MC., Payne, D., Klingenböck, A., Kuster, N., “IT’IS
Database for thermal and electromagnetic parameters of biological tissues,”
Version 3.0, September 1, 2015. www.itis.ethz.ch/database.
[3] M. Kozlov, B. Kalloch, M. Horner, P.-L. Bazin, N. Weiskopf, and H.E. Möller „Patient-specific RF safety assessment in MRI: Progress in creating surface-based human head and shoulder models“, in book “Brain and Human Body Modeling” S. Makarov et al. (eds.), pp. 245 – 282, https://doi.org/10.1007/978-3-030-21293-3_13
[4] Kozlov M., Bazin P.-L., Möller H.E., Weiskopf N., „Influence of Cerebrospinal Fluid on Specific Absorption Rate Generated by 300 MHz MRI Transmit Array“, Proceedings of 10th European Conference on Antennas and Propagation (EuCAP), 2016, DOI: 10.1109/EuCAP.2016.7481666
Figures