4183
Patient-specific Implant Safety Assessment using Low-SAR Reverse Polarization Imaging and a Fast Electromagnetic Solver1Athinoula A. Martinos Center for Biomedical Imaging, Charlestown, MA, United States, 2Harvard Medical School, Boston, MA, United States, 3Dept of Electrical Engineering and Computer Science, Massachusetts Institute of Technology, Cambridge, MA, United States, 4Institute for Medical Engineering and Science, Massachusetts Institute of Technology, Cambridge, MA, United States, 5Harvard-MIT Division of Health Sciences and Technology, Cambridge, MA, United States
Synopsis
Current characterization of RF-heating in orthopedic implants is based on electromagnetic simulations models and phantom experiments. However, these approaches may not accurately characterize the implant heating within a specific patient’s anatomy. A personalized medicine approach, whereby the patient-specific implant/body model is generated as the patient is in the scanner, may provide more accurate safety limits. In this study, we developed a low-SAR, fast methodology to scan and segment the implant and surrounding tissue, and calculate the 1g local SAR. Our combination of MSVAT-SPACE, reverse polarization PETRA, and a fast electromagnetic solver yields local SAR estimates in under 6 minutes.
Introduction
Orthopedic implant safety is of increasing concern in magnetic resonance imaging (MRI), particularly as the percent of the population with metal implants increases rapidly, be they orthopedic or surgical implants such as titanium screws and plates.1 Currently, the standard approach for characterizing the RF-heating of orthopedic implants is through electromagnetic (EM) simulations or experimentally within phantoms.2-9 However, simulations and phantom measurements either do not take into account a specific patient’s exact implant’s location and orientation or the individual’s anatomy. A personalized medicine approach using the local specific absorption rate (SAR) computed for the specific patient/implant being imaged would help alleviate these issues, possibly providing more accurate SAR constraints for efficient imaging. Achieving patient specific implant analysis requires both fast image-based model generation of the implant and anatomy and a fast EM solver. We have provided in the past a workflow for fast local SAR assessment in patients without implants,10 and present here an extension that can deal with bulk metal implants with arbitrary shapes, orientations and positions in the body.Methods
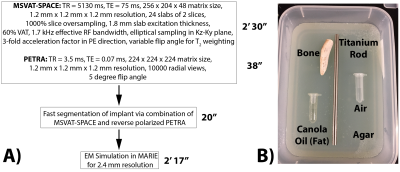
MRI Acquisitions Overview and Theory: We first obtain the geometry of the implant using a Multiple Slab acquisition with View Angle Tilting-SPACE sequence (MSVAT-SPACE),11-13 which has been shown to be a low SAR alternative to conventional MRI metallic imaging sequences.14,15 However, in the resulting images, metal appears dark and cannot be distinguished from bone and air (Figure 2). We solve this using a combination of MSVAT-SPACE and Pointwise Encoding Time Reduction with radial Acquisition (PETRA),16 which we selectively sensitize to the implant by using the principle of reverse polarization (RP).17-19 RP can be performed in transmit or receive mode. In transmit mode, a quadrature birdcage coil is driven in the anti-CP mode, which results in low signal levels in the body except around the implant which acts as an antenna (linear polarization) and thus creates its own B1+ excitation. A similar principle is applicable in receive mode, with multi-channel receive coils combined so as to null the MR signal in the body except around the implant. Combining this technique with the low-SAR, short echo-time capability of PETRA provides us with a rough estimate of the contour of the implant. MSVAT-SPACE can then use that location as prior knowledge to segment out the implant from the surrounding tissue. MSVAT-SPACE features improved in-plane and through-plane distortion correction compared to PETRA and is preferred for obtaining the most accurate geometry of the implant.Implant Phantom: A grade 5 titanium rod of diameter of 6.35mm and length of 152.4mm was used to mimic a metallic implant. Figure 1B has details of the full phantom.
MRI Acquisitions: Figure 1A shows the workflow and acquisition parameters for both MSVAT-SPACE and PETRA. All experiments used the body coil for transmit and the length of the titanium rod was oriented along B0. MSVAT-SPACE was acquired on a 3T Siemens Trio scanner with a 4-channel head array. As part of this proof of concept, we acquired reverse polarized PETRA using both the transmit and receive RP approach.18 The receive approach was tested on a 3T Siemens Trio scanner with a 4-channel head array. The reconstruction of the reverse polarized images was performed as described previously.18 The transmit approach was acquired on a 3T Siemens Skyra scanner using a 20-channel head array. The phase of port 2 of the body coil was set to -75º for reverse polarization imaging, and 90º for conventional imaging (for comparison).
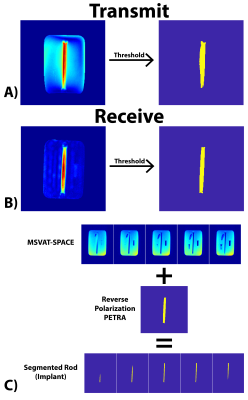
Implant Segmentation: The maximum intensity projection (MIP) PETRA images were thresholded in order to generate a mask of the spatial location of the implant. The mask was then overlaid on the MSVAT-SPACE images to remove the surrounding agar, fat, bone, and air, and another threshold was performed to generate the segmented rod.
Electromagnetic simulation using MARIE: All phantoms were simulated in a 32-rung high-pass body coil using the Magnetic Resonance Integral Equation (MARIE) fast EM solver,20 as described previously.10 All segmentation and electromagnetic analysis was performed on an Nvidia Tesla P100 GPU in a high end workstation using MATLAB.
Results
The total workflow time was 5’45”, with the MRI acquisitions taking 3’08”, segmentation taking 20”, and EM simulation taking 2’17”. Figure 2 shows representative slices from both the transmit and receive reverse polarization PETRA results. The forward polarization (conventional imaging) images feature the titanium rod and air/bone as isointense (dark), while the reverse polarization images shows the highest signal intensity around the rod. Figures 3A/B show the thresholding of the MIP PETRA images for both the transmit and receive case, revealing the spatial location of the rod, while removing surrounding tissue and air/bone. Figure 3C shows the combination of the SPACE images and MIP PETRA images, segmenting out only the titanium rod. Figure 4 shows the resulting 1g local SAR for different resolutions of the phantom, with all three resolutions showing good agreement.Conclusion
We demonstrated the ability of our method to 1) rapidly segment arbitrarily shaped bulk metal implants and 2) simulate an individual’s local SAR around the implant in under 6 minutes. Future work will focus on further validation and testing this methodology in human case-studies of diverse implants, implant orientation, and simulation resolution.Acknowledgements
NIH grants R00EB019482 and R01EB006847 and the Skolkovo Institute of Science and Technology Next Generation Program.References
1. Scanning patients with MR Conditional implants. http://usa.philips.com/healthcare/education-resources/publications/fieldstrength/mri-and-mr-conditional-implants. Published 2015.
2. Murdock K, Gross DC, Leewood A, et al. Computational modeling of RF-induced heating due to a titanium-alloy rod: An Interlaboratory Comparison for the ASTM F2182 task group. In: Proc. Intl. Soc. Mag. Reson. Med. 27 (2019) 0730.
3. Feng DX, Mccauley JP, Morgan-Curtis, Fea K.Salam RA, Pennell DR, Loveless ME, Dula AN. Evaluation of 39 medical implants at 7.0T. Br. J. Radiol. 2015;88:20150633.
4. Dula AN, Virostko J, Shellock FG. 28 Implants and Other Objects. Am. J. Roentgenol. 2014;202:401–405 doi: 10.2214/AJR.13.10777.
5. Kumar R, Lerski RA, Gandy S, Clift BA, Abboud RJ. Safety of Orthopedic Implants in Magnetic Resonance Imaging: An Experimental Verification. J. Orthop. Res. 2006:1799–1802.
6. Ho HS. Safety of Metallic Implants in Magnetic Resonance Imaging. J. Magn. Reson. Imaging 2001;14:472–477.
7. Kozlov M, Member GMN, Nazarian A, Sergey N, Member S. Comparative Analysis of Different Hip Implants within a Realistic Human Model Located Inside a 1.5T MRI Whole Body RF Coil. In: Conf Proc IEEE Eng Med Biol Soc. ; 2015. pp. 7913–7916.
8. Stijnman PRS, Luijten PR. Accelerating implant RF safety assessment using a low‐rank inverse update method. Magn. Reson. Med. 2019.
9. Guo R, Yang R, Zheng J, Kainz W, Chen J. Computational and experimental investigation of RF‐induced heating for multiple orthopedic implants. Magn. Reson. Med. 2019;82:1848–1858.
10. Milshteyn E, Guryev G, Torrado-Carvajal A, et al. Individualized SAR Calculations Using Computer-Vision-Based MR Segmentation and a Fast Electromagnetic Solver. In: Proc. Intl. Soc. Mag. Reson. Med. 27 (2019) 4174.
11. Li G, Nittka M, Paul D, Lauer L. MSVAT-SPACE for fast metal implants imaging. In: Proc. Intl. Soc. Mag. Reson. Med. 19 (2011) 3171.
12. Ai T, Padua A, Goerner F, et al. SEMAC-VAT and MSVAT-SPACE Sequence Strategies for Metal Artifact Reduction in 1.5T Magnetic Resonance Imaging. Invest. Radiol. 2012;47:267–276.
13. Hilgenfeld T, Prager M, Heil A, et al. PETRA, MSVAT-SPACE and SEMAC sequences for metal artefact reduction in dental MR imaging. Eur. J. Radiol. 2017;27:5104–5112.
14. Lu W, Pauly KB, Gold GE, Pauly JM, Hargreaves BA. SEMAC: Slice Encoding for Metal Artifact Correction in MRI. Magn. Reson. Med. 2009;62:66–76.
15. Koch KM, Lorbiecki JE, Hinks RS, King KF. A Multispectral Three-Dimensional Acquisition Technique for Imaging Near Metal Implants. Magn. Reson. Med. 2009;61:381–390.
16. Grodzki DM, Jakob PM, Heismann B. Ultrashort Echo Time Imaging Using Pointwise Encoding Time Reduction With Radial Acquisition (PETRA). Magn. Reson. Med. 2012;67:510–518.
17. Celik H, Ulutu A, Talı T, Atalar E. A Catheter Tracking Method Using Reverse Polarization for MR-Guided Interventions. Magn. Reson. Med. 2007;58:1224–1231.
18. Celik H, Atalar E. Reverse Polarized Inductive Coupling to Transmit and Receive Radiofrequency Coil Arrays. Magn. Reson. Med. 2012;67:446–456.
19. Overall WR, Pauly JM, Stang PP, Scott GC. Ensuring Safety of Implanted Devices Under MRI Using Reversed RF Polarization. Magn. Reson. Med. 2010;64:823–833.
20. Fernandez Villena J, Polimeridis AG, Eryaman Y, et al. Fast Electromagnetic Analysis of MRI Transmit RF Coils Based on Accelerated Integral Equation Methods. IEEE Trans. Biomed. Eng. 2016;63:2250–2261.
Figures


