4179
MRI RF Safety of Active Implantable Medical Devices (AIMDs): Tissue Simulating Medium properties for accurate modeling of MRI-conditional AIMDs1Electrical & Computer Engineering, Texas A&M University, College Station, TX, United States, 2Micro Systems Engineering Inc., Lake Oswego, OR, United States, 3Electrical & Computer Engineering, University of Houston, Houston, TX, United States
Synopsis
The Tier 3 procedure for testing electrically long active implantable medical devices (AIMDs) for MRI RF safety involves the development of transfer function models (TFMs) of the AIMDs. Accuracy of the TFM depends on how closely the TSM mimics the tissues in which the AIMD is implanted. We find that the conductivity of the medium surrounding the lead electrode has a strong influence on the transfer function magnitude of the DUT. Therefore, TFMs of the DUT developed in a TSM whose conductivity mimics that of the in-vivo tissue that surrounds the electrode under test results in the most accurate TFM.
Introduction
The Tier 3 ISO procedure 1,2 for testing electrically long active implantable medical devices (AIMDs) for MRI RF safety involves the development of transfer function models (TFMs) of the AIMDs. The TFMs of the lead electrode relate the incident tangential E-field (Etan) along the length of the AIMD from an MRI RF coil, to the tissue RF power deposition at the lead electrode as:$$$P_{dep}=S\int{TF(z)*E_{tan}(z)dz}$$$ (1)
where, is the normalized complex piecewise transfer function3, S is the experimentally determined power conversion factor. The product of S and TF(z) yields the TFM of the lead electrode.
Accurate estimates of tissue RF power deposition are obtained when the conductivity of the tissue simulating medium (TSM) in which the TFMs are measured closely mimics the conductivity of the target tissue medium in which the AIMD is implanted. Currently, TSM related test specifications impose unduly severe testing requirements and raise concerns about the resulting accuracy of the estimated tissue RF power deposition.
This work is an extension of previous work4,5, where we prove our hypothesis that the conductivity of the tissue that is in intimate contact with the lead electrode has a stronger influence on the tissue RF power deposition than the conductivity of the tissue surrounding the rest of the lead body.
Methods
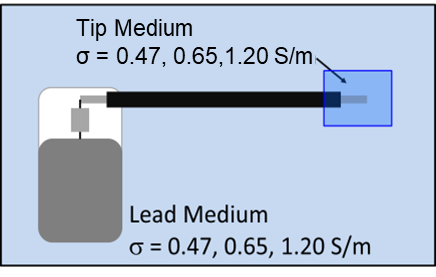
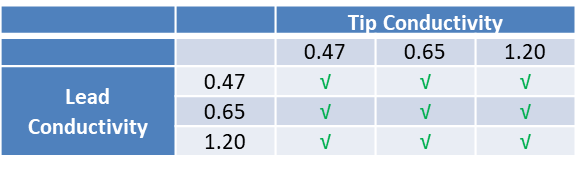
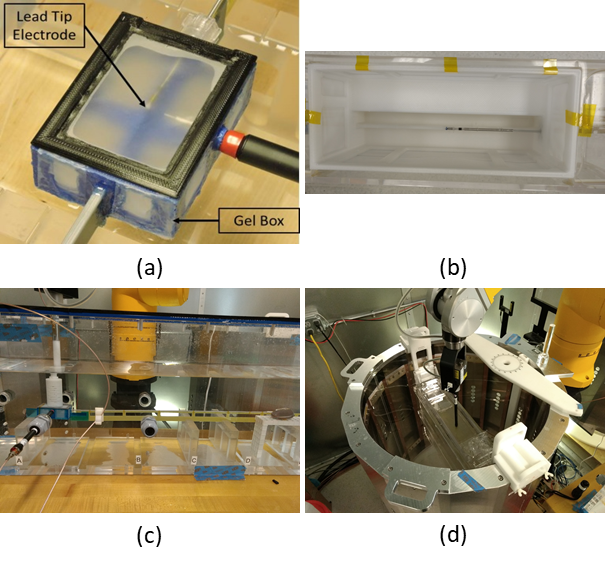
The device under test (DUT) consisted of a 530 mm long commercial bradycardia lead whose proximal contacts were connected to an Implantable Pacing Generator (IPG). The DUT was placed in heterogeneous media as shown in Figure 1. Three candidate TSM conductivities corresponding to body average (0.47 S/M), myocardium average (0.65 S/m) and blood (1.20 S/m) (Table 1) were considered for this analysis. The normalized TF(z) of the helical tip electrode for each TSM conductivity combination (Table 1) was obtained at 64 MHz with a PiX system (ZMT, Zurich, Switzerland). The corresponding scaling factor (S) measurements were obtained with a SAR probe in the MITS 1.5T system (ZMT, Zurich, Switzerland) over 3 different lead pathways (foldback positions) for each TSM conductivity combination.For both TF(z) and S measurements, gel box fixtures (Figure 2) that consisted of 3D printed plastic frames to which were glued porus fabric material were constructed. The DUT helical tip electrode was placed within the gel box fixtures and the remainder of the lead body was placed outside the fixtures but within the appropriate phantom for TF(z) or S measurements. The gel box fixtures were filled with a PAA gel set to the tip conductivities specified in Table 1. The remainder of the phantom was filled with saline solution set to the lead conductivities specified in Table 1. The porus fabric material ensured that the gel material and conductivity remained unchanged during the measurement, while simultaneously ensuring electrical contact with the surrounding saline.
E-field maps in multiple human body models spanning the 5th to 95th percentiles of BMI and height, exposed to MRI RF electromagnetic fields from several different birdcage coil models at various landmark positions, patient positioning (eg. Supine, prone, etc) were obtained using a numerical simulation software (SEMCAD, ZMT, Zurich, Switzerland). Complex Etans along 6 cardiac lead pathways were extracted from each resulting in vivo E-field map. Tissue RF power deposition at the DUT helical tip electrode was computed using equation (1). The 99th percentile worst case RF power deposition was computed for each TFM above.
Results
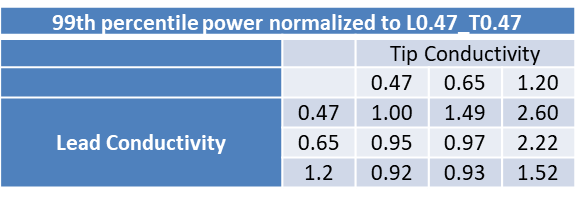
TFMs of the DUT helical tip electrode corresponding to the 9 combinations of Tip TSM and Lead TSM in Table 1 are shown in Figure 3. The 99th percentile worst case in vivo RF power deposition of each of the above TFMs normalized to homogeneous TSM with conductivity of 0.47S/m (Tip TSM, Lead TSM = 0.47S/m, Table 1) are shown in Table 2.Discussion
The TFMs of the DUT (Figure 3) as well as the computed normalized 99th percentile worst case RF power deposition (Table 2) show greater sensitivity to change in the tip medium conductivity (average change of 220% over the tested conductivities) than change in lead medium conductivity (average change of 29% over the tested conductivities). Electrode power deposition decreases with increase in lead medium conductivity, indicating increased capacitive power loss in the lead body. Further error analysis is required to determine the cause of lower than expected increase in RF power deposition for lead conductivity of 0.65 S/m and 1.20 S/m for a tip conductivity of 0.65 S/m, although the trend is preserved.Conclusion
The conductivity of the medium surrounding the lead electrode has a strong influence on the transfer function magnitude of the DUT, whereas the conductivity of the medium surrounding the remainder of the lead body has a weaker influence on the transfer function magnitude. For cardiac applications, a heterogeneous medium (lead conductivity: 1.20 S/m, tip conductivity: 0.65 S/m) yields the most accurate estimate of RF power deposition. However, developing TFMs of the DUT helical tip electrode in a homogeneous TSM with conductivity set to 0.65 S/m yields conservative estimates of the tissue RF power deposition and reduces testing complexity.Acknowledgements
No acknowledgement found.References
1 ISO/TS 10974 Ed.1, Clause 10,
2 ISO/TS 10974 Ed. 2, Clause 8,
3 Park SM et al, JMRI 2007 Nov;26(5): 1278-85,
4 Kurpad K et al, ISMRM Workshop on Ensuring RF Safety in MRI: Current Practices & Future Directions, McLean VA, Sep 28-Oct 1 2017,
5 Kurpad K.N. et al, ISMRM 26th Annual Meeting and Exhibition, Paris, France, Jun 16-21 2018, Program #4075.
Figures