4170
Application of pulse energy method (NEMA standard MS-8) for SAR measurement: location of current sensing flux loops and measurement quality
Xin Chen1, Shinji Mitsui2, Yoshinori Hamamura1, and Michael Steckner1
1Canon Medical Research USA, Inc., Mayfield Village, OH, United States, 2Canon Medical Systems Corporation, Otawara-shi, Japan
1Canon Medical Research USA, Inc., Mayfield Village, OH, United States, 2Canon Medical Systems Corporation, Otawara-shi, Japan
Synopsis
Pulse energy SAR measurement method (NEMA standard MS-8) uses current sensing flux loops to measure coil power loss, which varies in different imaging conditions. Modeling results suggest that using multiple flux loops distributed around Tx coil, as presently defined by the standard, may not give accurate results. For whole body birdcage coil loaded with a human subject, single flux loop spaced from endring and positioned at 3 or 9 o’clock may give more accurate results.
Introduction
Two widely used Whole Body (WB) SAR assessment methods (pulse energy method and calorimetry method) are described in NEMA standard MS-81, but only the pulse energy method can be used with a human subject. The critical aspect is current sensing flux loops placement near the Tx coil to measure coil power loss, which varies in different imaging conditions. RF power deposition in the subject Psub is calculated as:Psub = Pin – PCPL_loaded [1]
where Pin is Tx coil “net” input power, i.e. forward power minus reflected power, and PCPL_loaded is
coil power loss with the presence of test subject. Furthermore,
PCPL_loaded = PCPL_unloaded x (Vsub/Vunloaded)2 [2]
where Vsub and Vunloaded are B1 field induced voltage in the flux loop measured with the test subject and a lossless phantom respectively, and PCPL_unloaded is the Tx coil net input power measured with the lossless phantom. The standard recommends using a sufficient number of flux loops distributed evenly to get a balanced sample of the coil currents. In this case, the sum of the squared voltage values from all flux loops need to be calculated in Equation [2], assuming all flux loops have same sensitivity:
Vsub2 (with test subject) or Vunloaded2 (with the lossless phantom)= ∑ Vflux loop2 [3]
We use numerical EM modeling to show that using multiple flux loops evenly distributed around the birdcage coil and spaced from endring may not give accurate results. Instead, single flux loop at a strategically selected location can give more accurate results.
Methods
Numerical FDTD EM modeling was performed with a generic 3T WB Tx coil (16-rung high-pass birdcage, diameter 750mm, length 650mm. RF shield diameter 790mm, length 850mm.2,3) with Sim4Life (v4.4, ZMT, Zurich, Switzerland). The coil was tuned to 128MHz for 3T MRI and driven with two voltage sources located on one end ring. Sixteen square flux loops (Figure 1) were positioned near the coil endring (Figure 2), per MS-8. The flux loops form a circular loop with 730mm diameter. Visible Man4 was modeled with three imaging conditions (head, abdomen, and foot), and the following computed: power deposition in the subject, coil input power and induced voltage in all flux loops recorded by 50 Ohm resistors.Results
Table 1 shows the differences between the RF power deposition in Visible Man and the value calculated based on MS-8, using all 16 flux loops and Equations [1]-[3]. RF power deposition in Visible Man is also compared with values calculated with each individual flux loop’s voltage using Equation [1], assuming each flux loop provides a separate measurement (Figure 3).Discussion
Table 1 shows that based on MS-8, pulse energy measurement with a number of flux loops spaced from birdcage coil’s endring and evenly distributed around the coil (all with same sensitivity) did not give accurate power deposition in Visible Man for the three imaging landmarks investigated. The error ranges from 14.7% underestimate for abdomen and 41.0% overestimate for head. We did not model flux loops placed between coil rungs in the center axial slice. Experiment setup like the modeling presented here with all flux loops outside coil imaging volume is more advantageous at reducing cable (used to transmit flux loop voltage signal) exposure to Tx coil fields and resultant inference with the measurement. It can also help reduce potential interaction between human subject (especially big subjects) and flux loops if the loops are placed at positions 4, 5, 13, and 14 in Figures 2 and 3 (i.e. 3 and 9 o’clock). For the three landmarks investigated, although gray curves in Figure 3 had different patterns, flux loops placed at side of the bore (e.g. 3 and 9 o’clock locations) generally give better results than other locations.Conclusion
We used numerical EM modeling to investigate the impact of current sensing flux loop’s location on pulse energy SAR measurement accuracy. Results obtained with a human model at three imaging landmark positions suggest that a single flux loop placed at 3 or 9 o’clock and spaced from WB birdcage coil’s endring may give more accurate results.Acknowledgements
References
- NEMA Standards Publication MS 8-2016: Characterization of the Specific Absorption Rate (SAR) for Magnetic Resonance Imaging Systems.
- Murbach M, Neufeld E, Kainz W, et al. Whole-body and local RF absorption in human models as a function of anatomy and position within 1.5T MR body coil. Magn. Reson. Med. 2014; 71(2):839-845.
- Murbach M, Cabot E, Neufeld E, et al. Local SAR enhancements in anatomically correct children and adult models as a function of position within 1.5 T MR body coil. Prog Biophys Mol Biol. 2011; 107(3):428-433.
- Collins CM and Smith MB. Calculations of B1 distribution, SNR, and SAR for a surface coil adjacent to an anatomically-accurate human body model. Magn. Reson. Med. 2001; 45: 692-699.
Figures
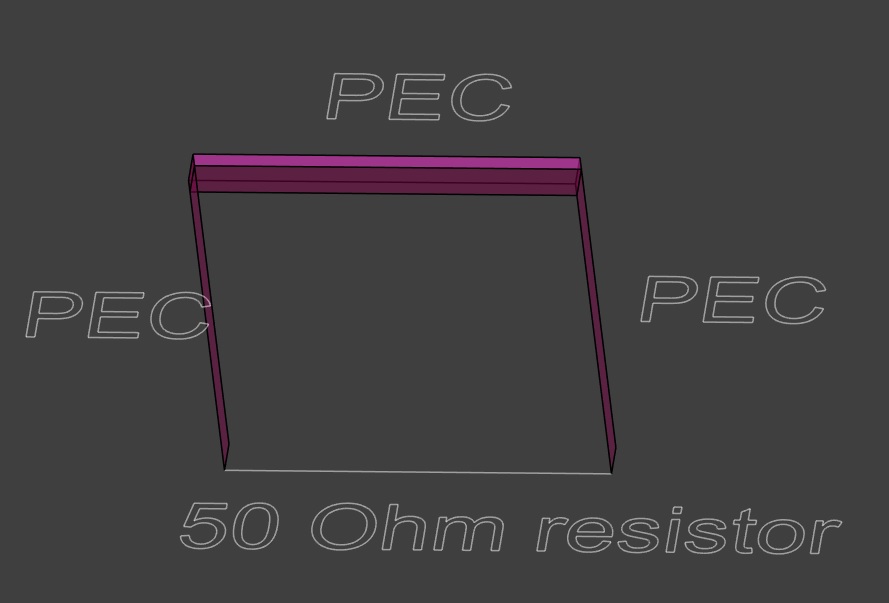
Figure
1. Flux loop is modeled as 5cm
x 5cm square with three perfect electric conductor (PEC) strips and one 50 Ohm
resistor.
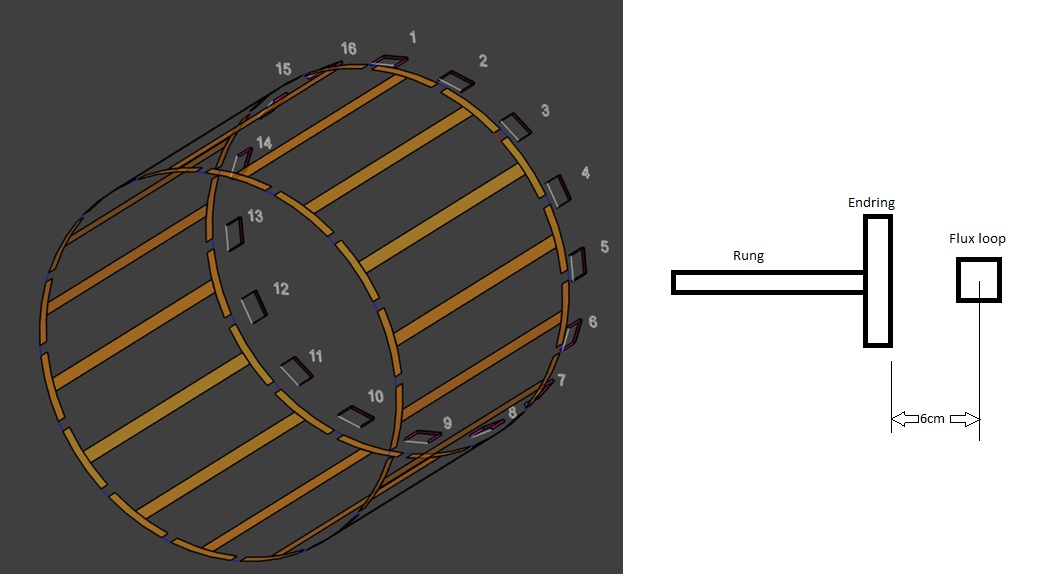
Figure 2. WB coil model with
16 flux loops. The center of the flux loop is 6cm from the edge of endring.
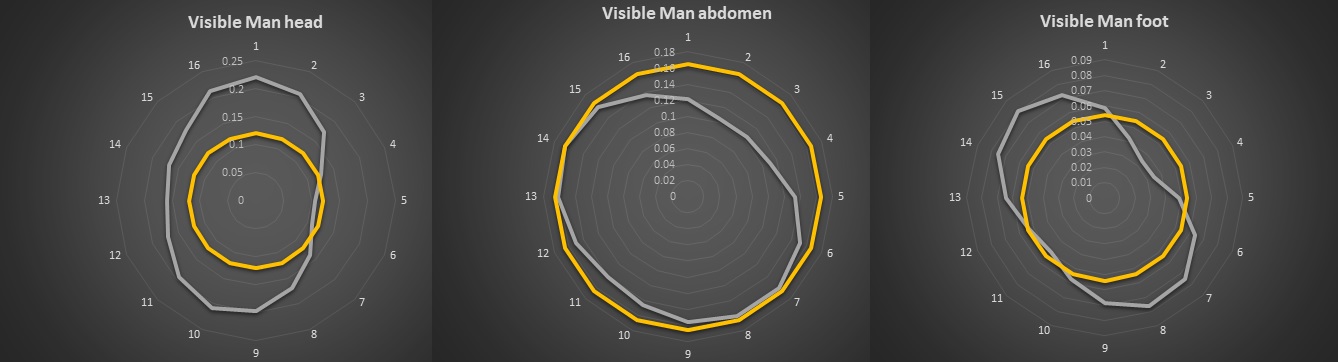
Figure 3. RF power deposition in Visible Man (gold) compared with values calculated with each individual flux loop’s voltage (gray) for the three
landmarks shown in Table 1.
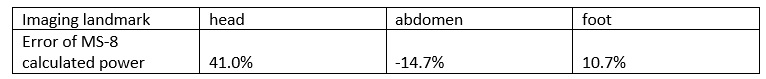
Table 1. The differences
between power deposition in Visible Man and values calculated with MS-8, using
16 flux loops evenly distributed around the birdcage coil and spaced from
endring. The difference is calculated as MS-8 calculated value/True value –
100%.