4167
SAR Safety Analysis for a 8Tx/16Rx Coil Array Prototype for Human Cardiac MRI at 7 T1Chair of Cellular and Molecular Imaging, Comprehensive Heart Failure Center (CHFC), University Hospital Würzburg, Wuerzburg, Germany, 2Rapid Biomedical, Rimpar, Germany, 3Department of Internal Medicine l, University Hospital Wuerzburg, Wuerzburg, Germany
Synopsis
The purpose of this study was to simulate the variation of SAR caused by shifting the position of a cardiac array prototype when different B1-shimming phase vectors are employed. The variation of 10g average SAR distribution due to displacing the anterior array position on the thorax (central, shifted 5 cm to the right, left, head, foot and diagonal directions) was computed and analyzed using two human voxel models. The final goal is to determine maximal driving voltage of the array with adequate safety margins considering new hot-spots originated from possible array misplacement
Introduction
MRI using ultra-high B0 field (UHF) is an emerging technique to improve the signal-to-noise ratio (SNR) compared to clinical scanners (B0=1.5-3T). However, the application of UHF in cardiac MRI (cMRI) faces numerous hurdles. The shortened wavelength of field at 7T ( λ ≈ 12 cm - in the order of a human thorax), results in strong field inhomogeneity. Different types of RF coils including, multichannel Tx (mTX) loops1-4 and dipole antenna arrays5,6 are used for mitigating these inhomogeneities performed by adjusting phases of the driving voltage for the individual elements (B1+-shimming phase vector).Motivation
For mTX arrays applied in UHF cMRI the main problem remains achieving sufficiently high flip-angle (FA) at the posterior wall of a myocardium. This plays a key role in using saturation and inversion rf-pulses which is prerequisite in the functional cMRI application (first-pass perfusion, late-gadolinium enhancement, T1-mapping). Thus, dedicated B1-shimming and sufficient driving voltages are essential to achieve maximal B1+ penetration depth. However, at ultra-high-field the critical factor limiting mTX-array usage is the local energy deposition characterized by the specific absorption rate (SAR). The peak SAR computed using human body models is used for setting a safety limit for the driving voltage of the array via the so-called “k-factor”. The individual human thorax anatomy varies in shape and dimensions influencing the position of the array location. This may lead to an essential deviation of the SAR from computed model values.The purpose of this study was to simulate the variation of SAR for an mTx array prototype for 7T cMRI caused by a displacement of the coil position with respect to the thorax and different B1-shimming phase vectors. The final goal is to determine the maximal driving voltage of the array with adequate safety margins considering possible new SAR “hot-spots” originated from possible array misplacement.
Materials and Methods
Both the anterior and posterior parts of the cardiac array prototype are composed of eight loop elements (Fig 1a). For SAR safety and field optimization, EM-simulations were performed using CST-Microwave-Studio (CST-MWS). The simulations were performed using Duke and Ella human voxel model with 2×2×2 mm3 resolution. The final total number of mesh cells was 40.9 million. The local averaged 10g SAR values were evaluated in CST-MWS using IEEE/IEC-62704-1 standard averaging method. For all cases, the 16 loop elements of the array were excited with the same total input stimulated power (Pin=8W). In this work, we analyzed the variation of the SAR which comes from the two sources:1) Adjustment of the phases of individual elements needed to provide homogeneous profile. Four phase vectors {Φ}1-{Φ}4 preliminary pre-computed to provide optimized profile in Duke and Ella models were considered.
2) Variation of SAR due to different positioning of the anterior part of the array on the human subject thorax. The anterior array position was shifted from the central allocation on 50 mm to the right, left, head, foot, all diagonal directions and tilted on 100 from the horizontal allocation.
From the 3D SAR maps simulated for each of the phase vectors the primary maximal intensity projection (MIP1) maps within the slabs of 20 mm distance from the anterior part was computed (Figure 2b). Then the secondary MIP2 was computed using stack of the above determined 4 MIP1 for each of 4 phase vectors. The relative variation of SAR MIP2 with respect to the reference position was analyzed in order to determine worst-case situation.
Results
Fig. 1(a) demonstrates a sketch of the 8Tx/16Rx mTX array prototype and its default position on the human subject thorax. Fig. 1(b) shows the coronal slabs used to evaluate 10g SAR. Fig. 2(a) shows an example of the volume-rendered SAR distribution for centered array and zero phase vector (prior to B1-shimming). Figure 2b demonstrates slab for MIP1 computation. Fig.3 Shows the scheme of computing anterior MIP2 SAR with 4 phase vectors. Fig 4 and 5 demonstrate variation of MIP2 SAR due to change of the position of the array on the thorax (four positions) of Duke and Ella models normalized to the maximal SAR of the central array position.Discussion
Maximal variation of 10g SAR due to the changes of the position of the anterior array part was observed for horizontal (left-right shift). However, the maximal increase of SAR in the new hot-spot does not exceed 25% from the initial position for the Duke model. For the smaller thorax dimensions of the model Ella no increase of SAR is observed for the shifted array positions. Usually, without such an analysis of conservative safety margins for the worst-case SAR (and, therefore, k-factor) use to be applied (typically factor 2 from the modeled value). The computed SAR variation originated from the array displacement, however, should allow for setting more realistic safety margins.Conclusion
The performed simulation demonstrated sufficient stability of SAR calculation with respect to array position changes and will provide more flexibility for the cMRI application demanding to the achievable B1+ magnitude.Acknowledgements
Financial support was obtained from the German Ministry of Education and Research (BMBF) under grants: 01EO1004 & 01EO1504.References
[1] Graessl, et al., (2014), Modular 32-channel transceiver coil array for cardiac MRI at 7.0 T, MRM, 72(1), 276-290.
[2] Dieringer, et al., (2011), Design and application of a four-channel transmit/receive surface coil for functional cardiac imaging at 7T, JMRI, 33(3), 736-741.
[3] Gräßl, et al., (2013), Design, evaluation and application of an eight channel transmit/receive coil array for cardiac MRI at 7.0 T. EJR, 82(5), 752-759.
[4] Thalhammer, et al., (2012), Two-dimensional sixteen channel transmit/receive coil array for cardiac MRI at 7.0 T: design, evaluation, and application. JMRI, 36(4), 847-857. [5] Oezerdem, et al., (2016), 16-channel bow tie antenna transceiver array for cardiac MR at 7.0 tesla, MRM, 75(6), 2553-2565. [6] Raaijmakers, et al., (2016), Dipole antennas for ultrahigh-field body imaging: a comparison with loop coils. NMR in Biomedicine, 29(9), 1122-1130.
Figures

Figure 1
A sketch of the novel multichannel 8Tx/16Rx coil array prototype. Blue contours marks the default position on the human subject thorax, white contours denote some of the shifted positions analyzed in current work.
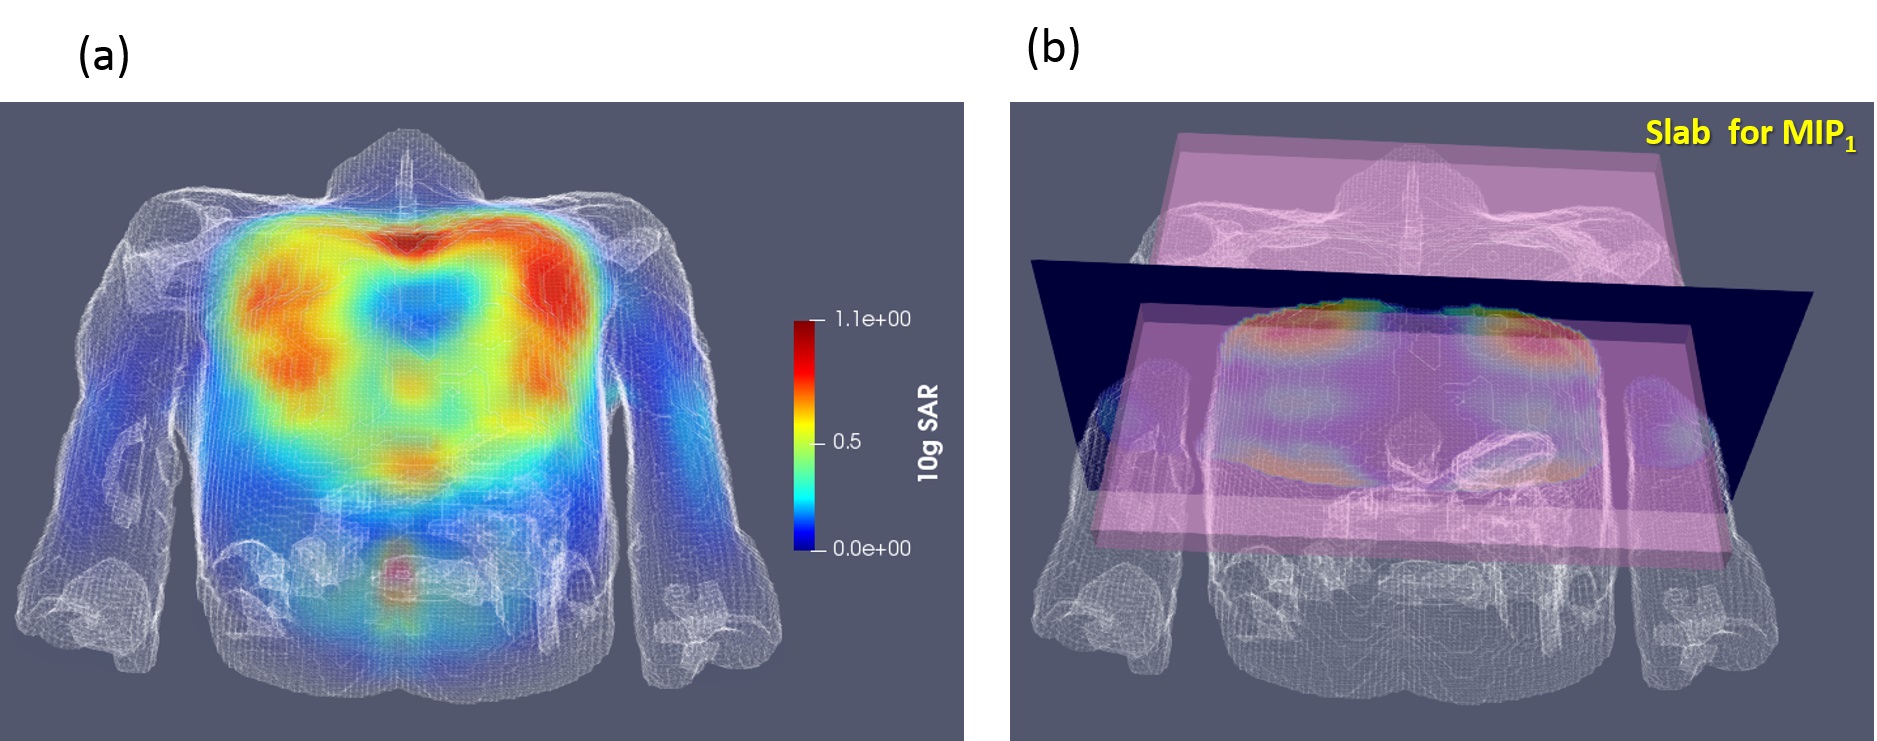
Figure 2
Volume rendered SAR 3D map for centered array position and default ( “all zero”) phase vector. (b) Coronal slabs, which were used to evaluate MIP1 SAR.
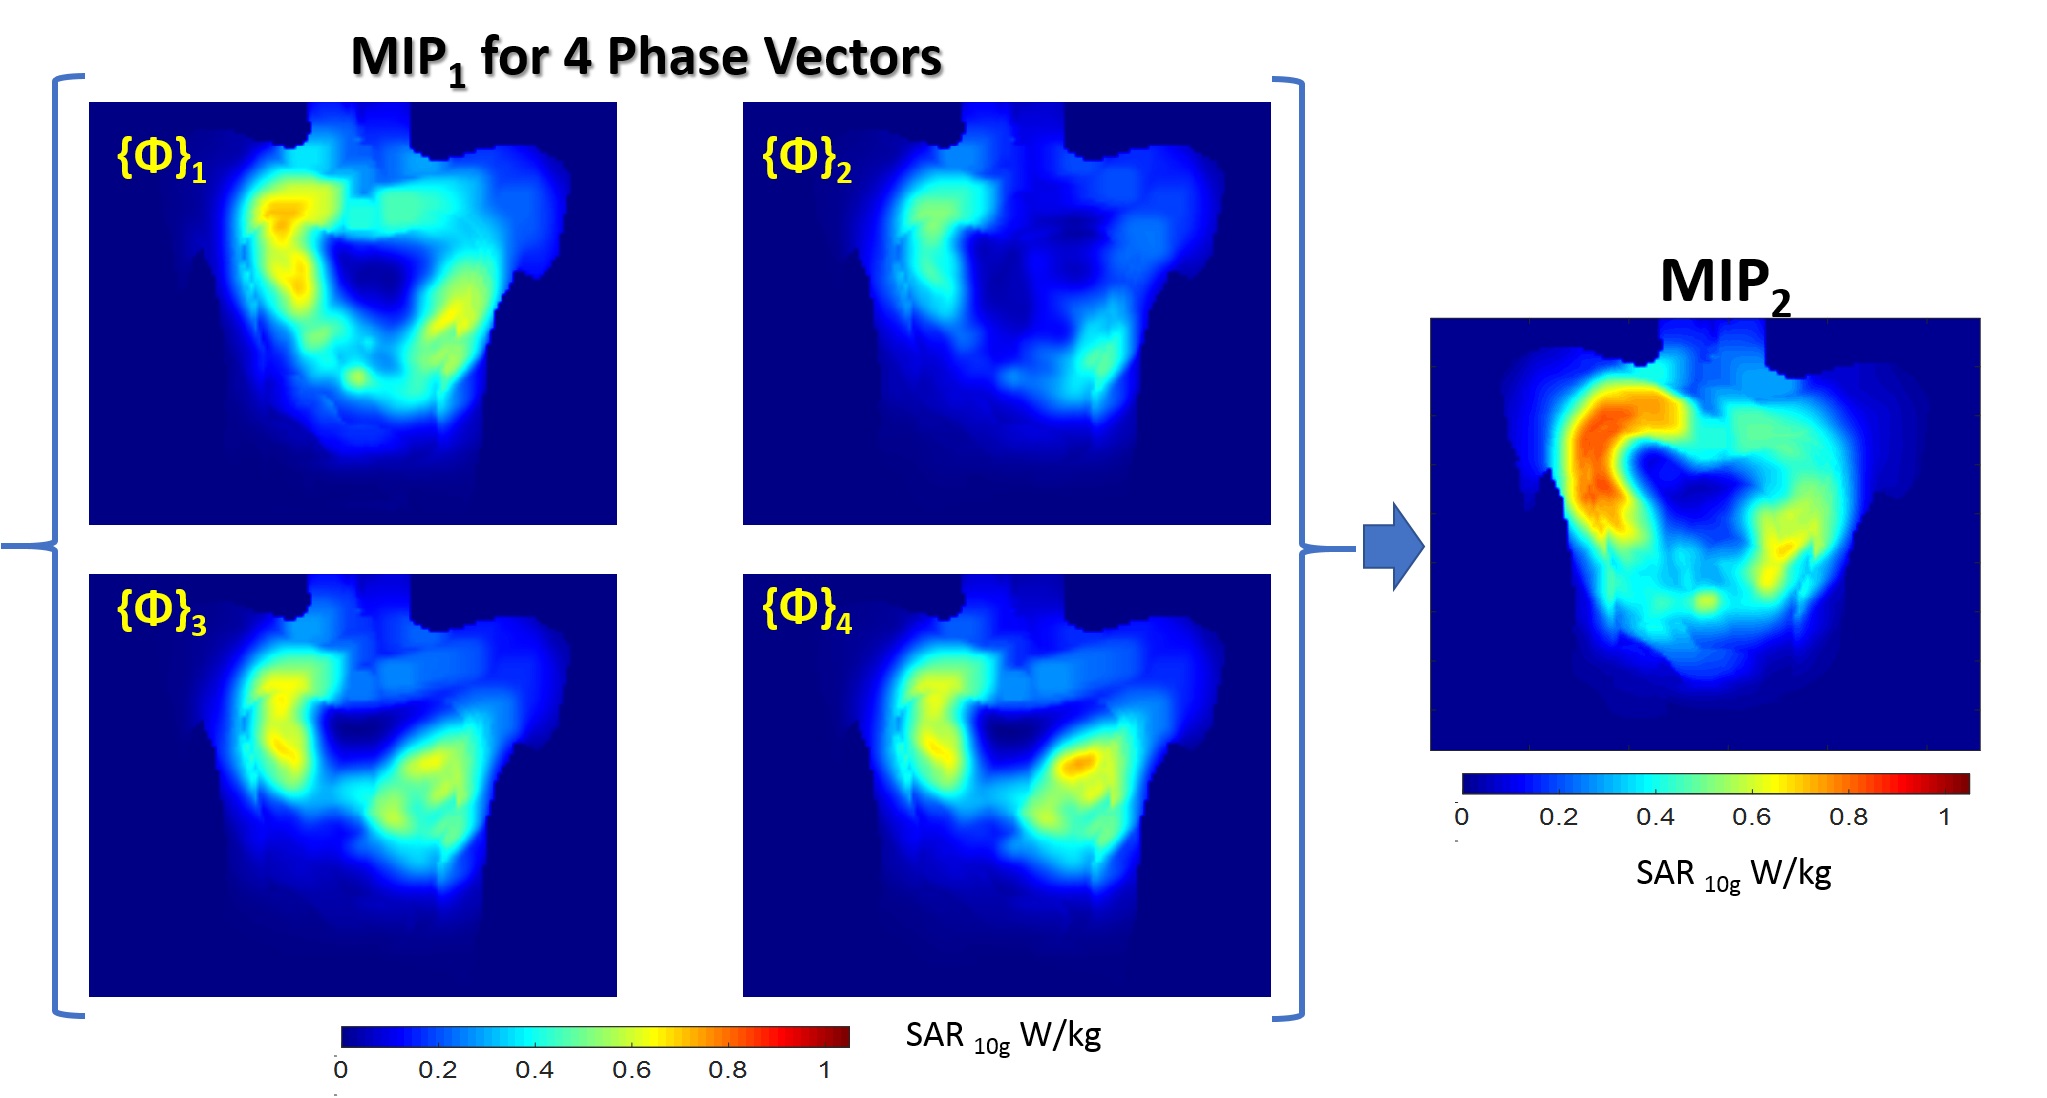
Figure 3
MIP1 SAR maps for each of 4 phase vector pre-computed for B1+ shimming of the array

Figure 4
Variation of MIP2 SAR maps for different positions of the array anterior part computed for Duke model. 3 examples of shifted maps with the largest observed SAR variation are shown. The values are normalized to the maximum of MIP2 SAR computed for the reference position “No shift” position. The maximal increase of SAR on 20% is observed in all considered shift cases.
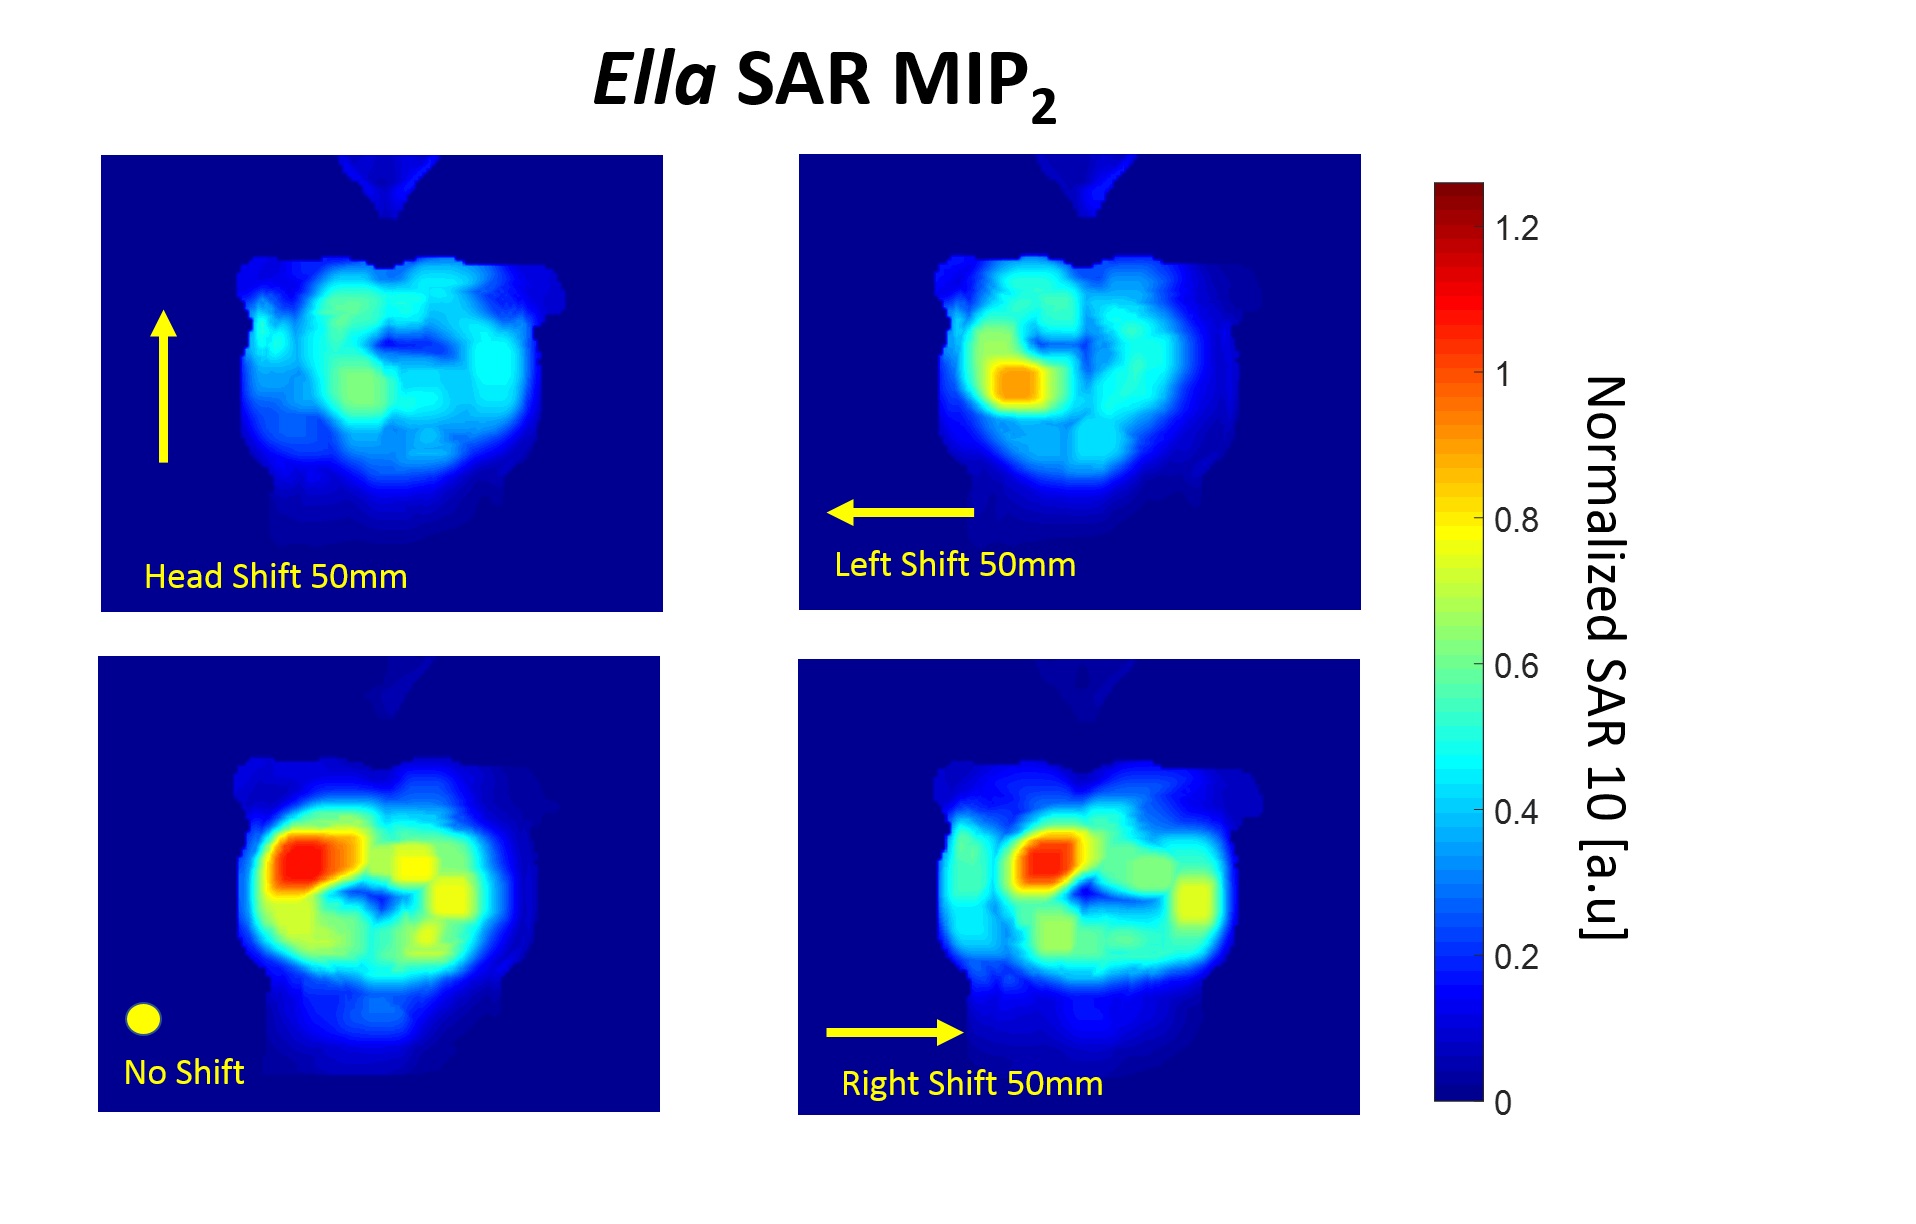
Figure 5
Variation of MIP2 SAR maps for different positions of the array anterior part computed for Ella model. 3 examples of shifted maps with the largest observed SAR variation are shown. With smaller thorax dimensions in comparison to Duke model .no increase of SAR is observed for shifted array position.