4159
Whole Body PET/MRI Biodistribution of F-18 fluorobenzylamide doxorubicin in an Intra-arterial Procedure1Radiology and Biomedical Imaging, University of California, San Francisco, San Francisco, CA, United States
Synopsis
Recent studies have shown effective use of intravascular filtration devices to remove chemotherapy drugs; however, accurate quantification of the drug’s distribution on the device, within the targeted organ, and systemically, is necessary. We synthesized 18F analog of doxorubicin, fluorobenzylamide doxorubicin ([18F]FB-Dox), which was administered via an intra-arterial catheter, without a filter, and imaged under PET/MRI in vivo. [18F]FB-Dox showed a measurable decrease in the liver, and an increase in the bladder, kidney, and gall bladder over a 90-minute period after injection. This demonstrates a viable way to assess and track the baseline biodistribution of an intra-arterial chemotherapy procedure.
Introduction
Doxorubicin is a chemotherapeutic agent employed in transarterial chemoembolization (TACE) for non-resectable hepatocellular carcinoma (HCC), and is highly effective, with a linear dose-response curve. However, it has a lifetime dose-limit due to its systemic toxicities. One developing application is to use chemotherapy drugs in an intra-arterial chemotherapy (IAC) procedure1–4. These drugs can then be selectively removed by deploying an endovascular device downstream of the targeted organ, thus limiting off-target drug toxicities. Such an intravascular device that utilizes a specialized membrane to bind a target drug that has shown to be effective at sequestering doxorubicin in in vivo experiments5,6. Placing a doxorubicin filter in the liver's draining veins has shown to reduce the amount taken up by systemic organs, but its high binding affinity has made it hard to quantify the amount bound to the membrane. In preliminary studies, we have shown that a radio analog, F-18 fluorobenzylamide doxorubicin ([18F]FB-Dox) acts in a similar fashion to native doxorubicin and can be a viable tracer to assess its biochemical properties for the development of an in vivo systemic distribution quantification model. We performed a PET/MRI experiment to assess and image the baseline tracer biodistribution in an IAC-type procedure without a filter, as a control for future filtration experiments.Methods
In Vivo Experiment: The study protocol was approved by the university’s Institutional Animal Care and Use Committee. A 5 French catheter was placed into the common hepatic artery of a single swine (37.0 kg, female), using a 30 × 30 cm2 flat panel C-arm X-ray system guidance (Cios Alpha, Siemens Healthineers, Munich, Germany). The tip of the catheter was positioned in the common hepatic artery, just distal to the hepatic artery bifurcation, as for an IAC procedure. A formulation of 4.136 mCi of [18F]FB-Dox (half-life 109 minutes) within 10 mL of 2 mg/ml doxorubicin was prepared for injection.Image Acquisition: We used a 3.0T PET/MRI (SIGNA, GE Healthcare, Waukesha, WI), with a 16-channel upper and lower anterior array coil (UAA/LAA) and a 14-channel posterior array coil (CMA) for simultaneous acquisition of PET and MRI data. The [18F]FB-Dox was injected over a 30-second period, and then a simultaneous 10-minute time-of-flight (TOF) dynamic PET/ MRI image data was acquired over the liver. The MRI sequences included a 3D, breath-held fast spoiled gradient echo (FSPGR) sequence (LAVA Flex) with an axial scan plane, a single-shot fast spin echo (SSFSE) with an axial scan plane, and a coronal SSFSE sequence with fat saturation. Next, a 20-minute static time-of-flight (TOF) PET/MRI was acquired over the whole body, using five beds that were four minutes each (total 20 minutes per task) to encompass the entire pig. The beds were positioned roughly over the head, upper chest, lower chest, upper abdomen, lower abdomen/legs. We repeated the whole-body PET task three times, to allow us to scan up to 90 minutes post-injection.
Data Analysis: The attenuated corrected images were converted to standardized uptake values (SUV). An ROI was drawn manually on a single 2D image (slice thickness 0.9-1.0 mm), copied over to each corresponding time point to maintain a constant area, and the sum of the SUV values was measured using Horos.
Results
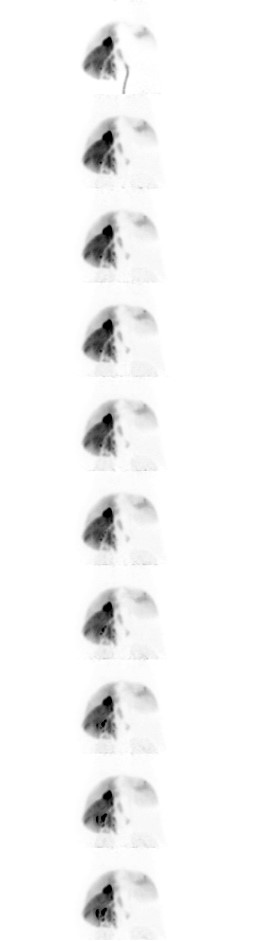
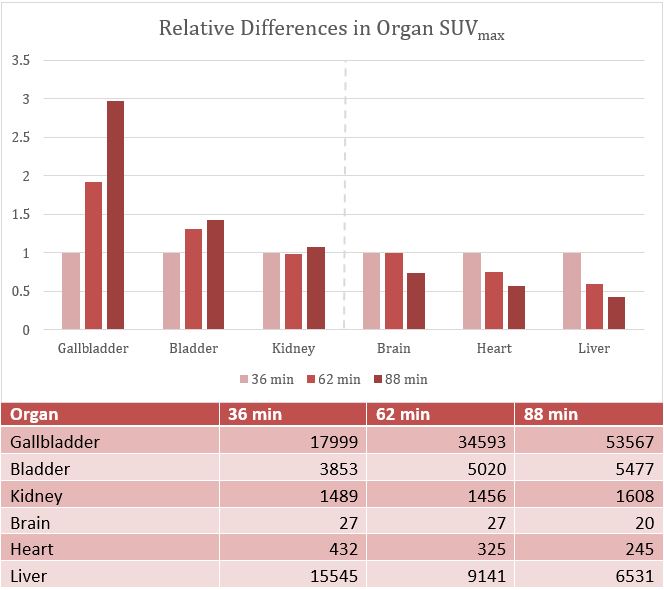
PET/MR overlay shows a decrease in [18F]FB-Dox over time (Fig. 1). Dynamic PET imaging over the first 10 minutes post injection shows fast coverage across the liver, primarily in the right hepatic lobe (Fig. 2). Baseline biodistribution of [18F]FB-Dox is primarily located in the liver (primary target), gallbladder (primary excretion route), bladder (secondary excretion route). The amount of radioactive doxorubicin decreased by 58% and 44% in the liver and heart respectively and increased by 297% and 142% in the gallbladder and bladder respectively (Fig. 3).Discussion
This PET/MR image acquisition demonstrates the biodistribution of [18F]FB-Dox over time during an IAC procedure, as a proxy for native doxorubicin. The increase in the right hepatic lobe during the first 10 minutes is most likely due to the injection catheter angled towards the right hepatic artery. The static PET/MR sequences shows the amount of [18F]FB-Dox increasing primarily in the gall bladder as it is filtered through the liver, as well as in the bladder as it is filtered from the blood stream. Given the known effects of cardiac toxicity, the negative trend in the heart is most likely due to the body’s own filtration system, since there is still a significant amount deposited in the heart compared to the brain.[18F]FB-Dox is a viable tracer to be able to visualize biodistribution of native doxorubicin and will allow us to assess the relative changes throughout the body with the addition of endovascular filtration devices.
Acknowledgements
The authors gratefully acknowledge Vahid Ravanfar, BS, RT for PET-MR scanning. Funding support included R01 CA194533.References
1. Patel AS, Saeed M, Yee EJ, et al. Development and Validation of Endovascular Chemotherapy Filter Device for Removing High-Dose Doxorubicin: Preclinical Study. J Med Device. 2014;8(4):0410081-0410088. doi:10.1115/1.4027444
2. Mabray MC, Lillaney P, Sze CH, et al. In Vitro Capture of Small Ferrous Particles with a Magnetic Filtration Device Designed for Intravascular Use with Intraarterial Chemotherapy: Proof-of-Concept Study. J Vasc Interv Radiol. 2016;27(3):426-432.e1. doi:10.1016/j.jvir.2015.09.014
3. Kondapavulur S, Cote AM, Neumann KD, et al. Optimization of an endovascular magnetic filter for maximized capture of magnetic nanoparticles. Biomed Microdevices. 2016;18(6). doi:10.1007/s10544-016-0135-2
4. Jordan CD, Han M, Kondapavulur S, et al. Quantification of 89 Zr-Iron oxide nanoparticle biodistribution using PET-MR and ultrashort TE sequences. J Magn Reson Imaging. 2018;48(6):1717-1720. doi:10.1002/jmri.26193
5. Oh HJ, Aboian MS, Yi MYJ, et al. 3D Printed Absorber for Capturing Chemotherapy Drugs before They Spread through the Body. ACS Cent Sci. 2019;5(3):419-427. doi:10.1021/acscentsci.8b00700
6. Yee C, McCoy D, Yu J, et al. Endovascular Ion Exchange Chemofiltration Device Reduces Off-Target Doxorubicin Exposure in a Hepatic Intra-arterial Chemotherapy Model. Radiol Imaging Cancer. 2019;1(1):e190009. doi:10.1148/rycan.2019190009
Figures