4156
On the Carbon Footprint of ISMRM's Annual Meeting: Analysis and Implications1TUM, Munich, Germany
Synopsis
Climate change is one of the defining issues of our time. Weather patterns are shifting and sea levels are rising. The most abundant greenhouse gas, accounting for about two-thirds of total greenhouse gas emissions, is carbon dioxide (CO2). CO2 is largely the product of burning fossil fuel and therefore the traveling towards the conference venue is expected to be a main contributor to the carbon footprint of the annual ISMRM meeting. This work estimates the C02 emissions of the past ISMRM meetings and tries to give data driven recommendation for future selection of ISMRM conference locations.
Purpose
Greenhouse gas emissions have increased greatly since the start of the Industrial Revolution. This leads to an increase of the earth’s temperature with unforeseen consequences for the climate and mankind.The International Society for Magnetic Resonance in Medicine (ISMRM) has introduced the annual meeting sustainability initiative to reduce the carbon footprint of its employees and all attendees of the annual meetings and workshops.
Focusing on the annual meetings, the pollution caused by traveling is expected to be a main contributor to the carbon footprint of the annual meeting.
However, up to now it is unclear how the selection of the conference venue influences the overall environmental pollution.
This work estimates the total carbon dioxide emission based on the traveling distance of the first author of each abstract to the venue and gives recommendations on how to improve the selection of the event location for future ISMRM conferences. The data was taken from publicly available information.
Methods
To estimate the CO2 pollution generated by people traveling to past ISMRM annual meetings, data from ISMRM’s archive at http://archive.ismrm. org were extracted. For all abstracts of the years 2010 to 2019 (with exception of 2011) the affiliation and subsequently the location of the first authors were extracted. The bee-line between each first author location and the conference was calculated using a parabolic model of the earth. The distance was doubled under the assumption that people would also travel back home. It was assumed that people for a distance larger than 300 miles travel by plane. To calculate a forecast for the travel miles for the upcoming meeting 2020 in Sydney, the first author locations from 2019 are used and their distances to Sydney are calculated.To calculate the amount of generated CO2 a mean emission of 0.34 kg per traveled mile was assumed (1, 2). The obtained amount of CO2 is called ’actually produced’ CO2 . However, the greenhouse effect of the CO2 polluted at such altitudes is in on average twice as strong as on sea level (3). Therefore, also the ’effective’ CO2 amount was calculated. To evaluate environmentally optimal and suboptimal conference locations, the locations of the first authors that traveled to 2019’s annual meeting in Montreal were used and the distance to some randomly selected cities were calculated.
Results
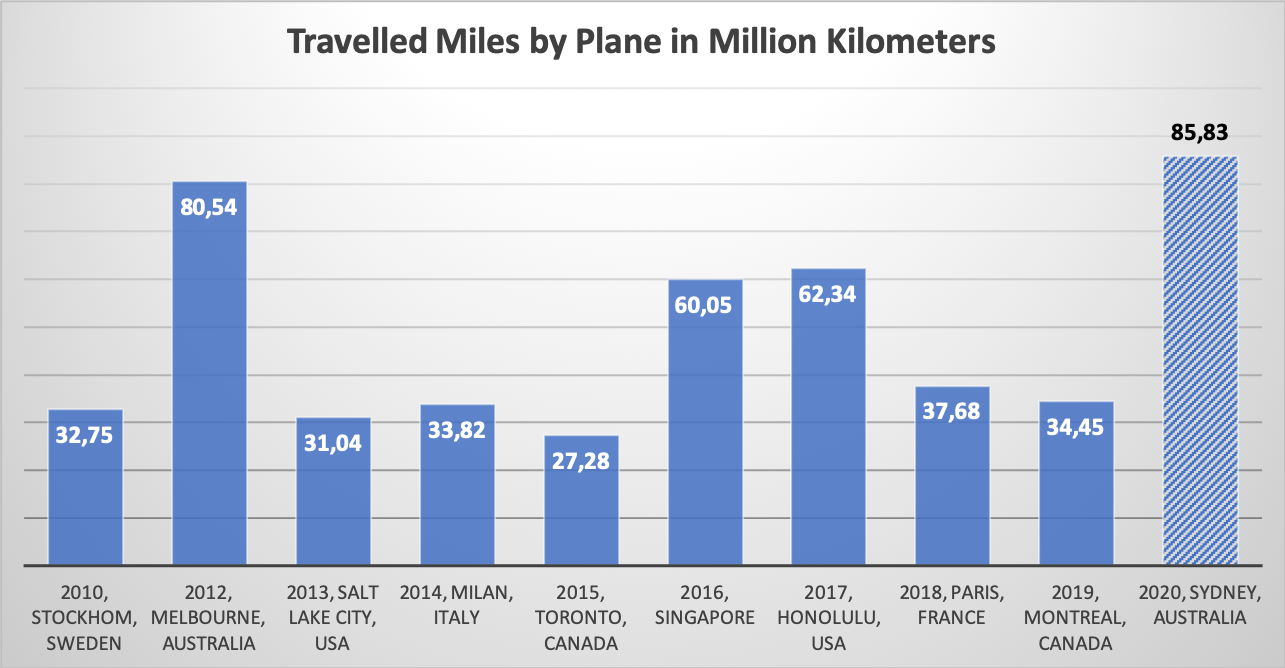
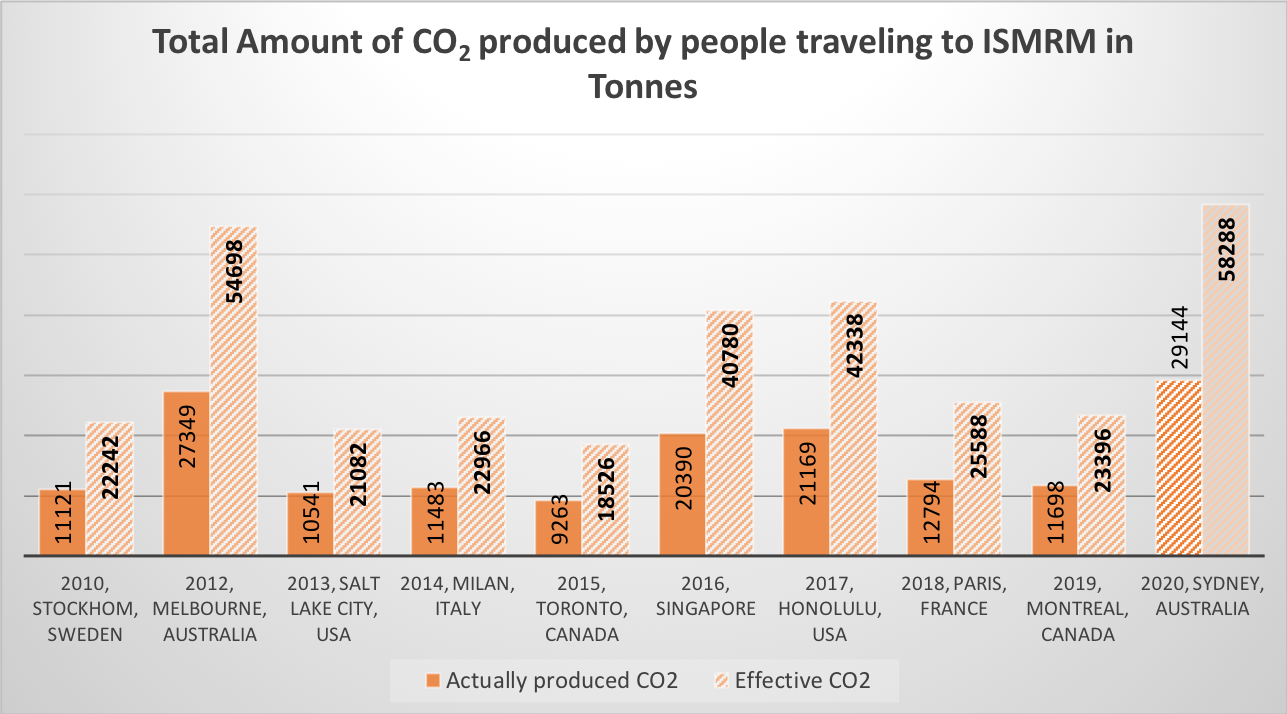
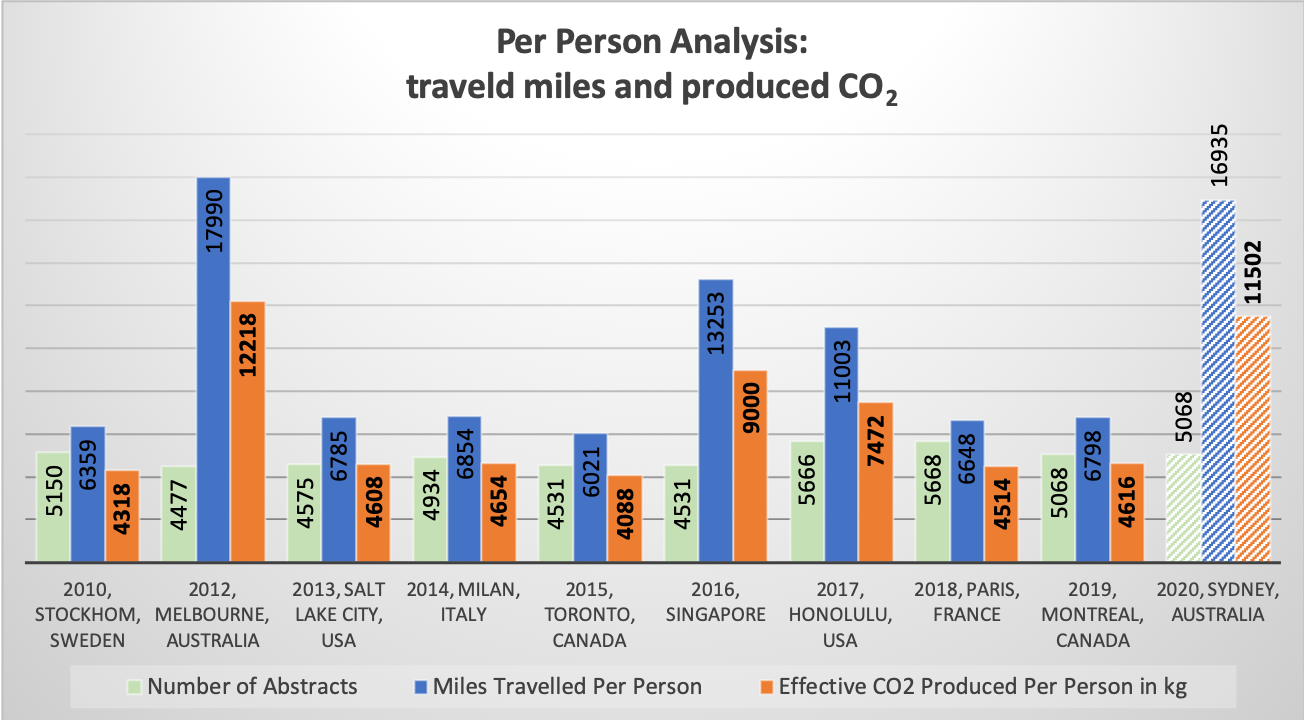
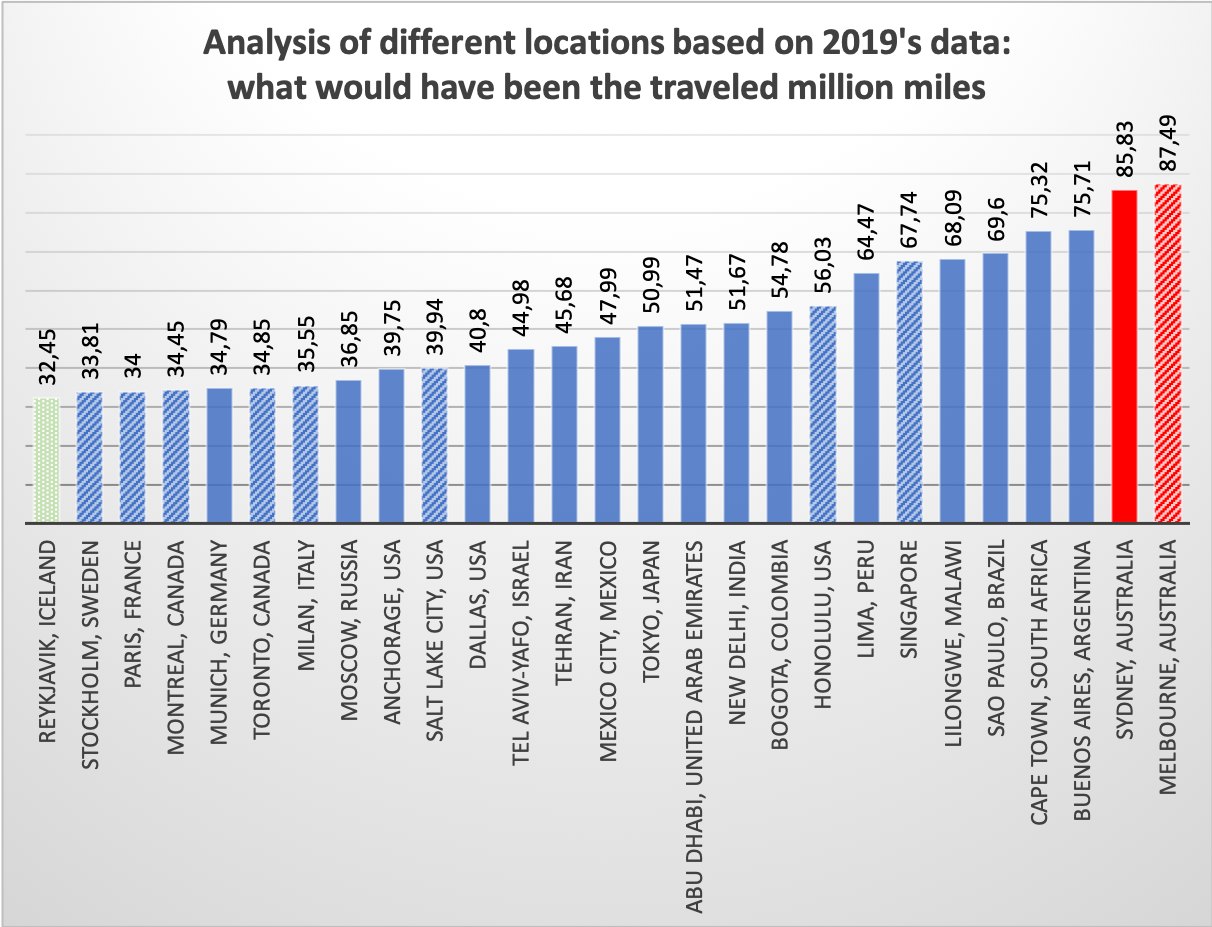
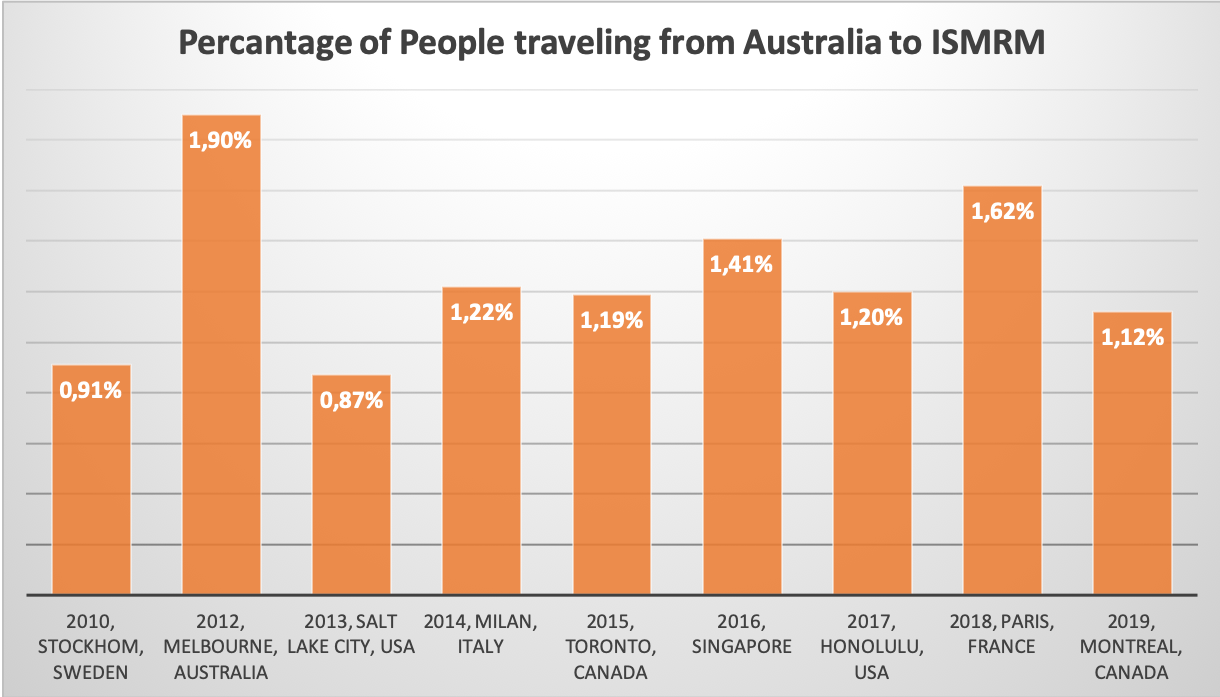
In the past years first authors have collectively traveled between 27.28 and 80.54 million miles per year for ISMRM as depicted in Figure 1. This led to an effective CO2 pollution of between 18,526 and 54,698 tonnes as shown in Figure 2. From the total amount of traveled miles and produced CO2 it is already apparent that locations in Europe and North America lead to the smallest amount of greenhouse gas emissions. This becomes even more apparent in a per person analysis as shown in Figure 3. The selection of past ISMRM annual meetings generally led to a low number of total traveled miles as shown in Figure 4. However, Melbourne is a significant exception with a large increase in miles and consequently CO2 pollution. Destinations such as Honolulu and Singapore also led to a significant increase in total traveled miles compared to destinations in Europe or North America. An Analysis of first authors traveling from Australia to the ISMRM annual meetings shows a range of 0.87 to 1.9% for the past years as shown in Figure 5.Discussion & Conclusion
The carbon offset suggested by the ISMRM committee (https://www.ismrm.org/20m/sustainability/) is a first step towards reducing the carbon footprint of the ISMRM society. However, a significant amount of CO2 could already be avoided by selecting the location of ISMRM’s annual meeting by minimizing the total amount of miles traveled by the attendees. As our analysis showed, that could lead to a reduction of CO2 pollution by around 40,000 tonnes. Furthermore, considering that only around 1-2% people are traveling from Australia to ISMRM each year, the number of meetings in Australia seems disproportionately large. As climate change is a considerable issue that ISMRM as a society should possibly discuss, one thing to consider is whether or not a 'fair' distribution of conference locations is more important than the possible CO2 pollution.Acknowledgements
I would like to acknowledge my Mentors Jakob Meineke and Maximilian N. Diefenbach.References
[1] T. S. I. Michael Barnard, Chief Strategist. (2017) How much co2 do planes produce? https://www.quora.com/How-much-CO2- do-planes-produce.
[2] Quarks. (2019) Wie viel co2 setzt du frei? https://www.quarks.de/umwelt/klimawandel/co2- rechner-fuer-auto-flugzeug-und-co/.
[3] C. Azar and D. J. A. Johansson, “Valuing the non-co2 climate impacts of aviation,” Climatic Change, vol. 111, no. 3, pp. 559–579, Apr 2012. [Online]. Available: https://doi.org/10. 1007/s10584-011-0168-8
Figures