4142
Tool for Image-guided Intracerebral Hemorrhage Evacuation: Automatic Segmentation of Clot, Edema, and Normal Brain Tissue1Medical Physics, University of Wisconsin - Madison, Madison, WI, United States, 2Radiology, University of Wisconsin - Madison, Madison, WI, United States, 3Neurological Surgery, University of Wisconsin - Madison, Madison, WI, United States, 4Biomedical Engineering, University of Wisconsin - Madison, Madison, WI, United States
Synopsis
Improved image guidance is needed for neurosurgeons to reduce the residual remaining clot levels during minimally invasive evacuation of intracerebral hemorrhage (ICH) while not causing rebleeds. Neurosurgeons would benefit from a means to periodically render the clot volume against surrounding normal tissue during mechanical evacuation or pharmaceutical-based clot-busting. Using convolutional neural networks (CNN), we created machine learning models to automatically segment the constituent clot and edema induced by ICH cases using T2-weighted MR images. The CCN’s output results were found to be in agreement with manual segmentations of the same ICH cases.
Introduction
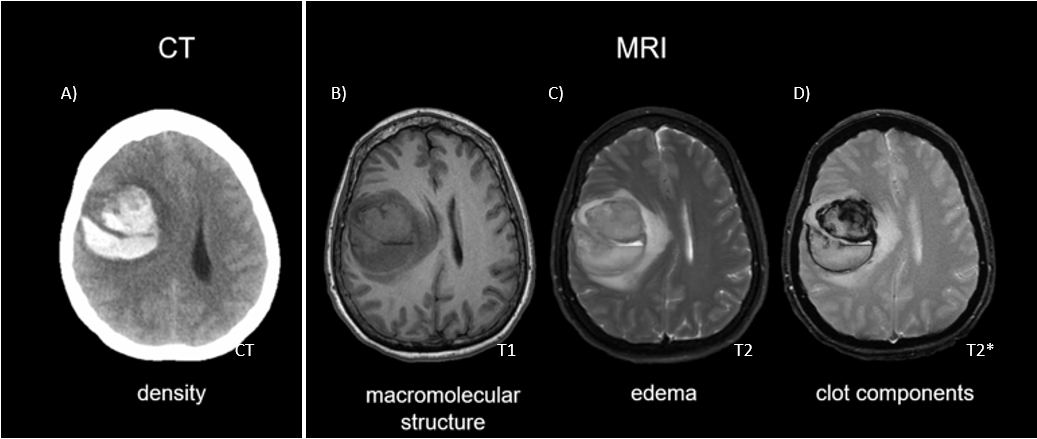
The value of diagnostic MRI in intracerebral hemorrhage (ICH) has centered on characterizing and aging brain clots. The recently concluded NIH MISTIE Phase III Trial in minimally invasive ICH evacuation demonstrated patients whose clot volume was evacuated to less than 15 ml had increased independence, though no net reduction in morbidity was demonstrated over the entire 500 patient cohort [1]. To meet the 15 ml goal, neurosurgeons need improved image guidance to spatially direct therapies under consideration ranging from soft suction over one surgical session to slowly administering clot busters to lyse the 30-80 ml clots over 1-5 days [2]. Current CT visualization of clots (Fig. 1A) does not permit sufficiently aggressive evacuation to reduce the interior clot volume below the recommended 15 ml limit due to concerns that unknowingly interfering with the edge of the clot will cause a rebleed. Neurosurgeons would benefit from the capability to 3D render the clot and surrounding edema automatically repeatedly as the clot morphology changes during the evacuation process. As a precursor to visualization during MR-guided evacuation [4], we developed a Machine Learning approach using MR ICH images (Fig 1, top B-D) to automatically segment the clot and surrounding edema from normal brain.Methods
Data Processing:A HIPAA compliant retrospective study included a set of 2D FSE T2-W brain image over a 24 cmFOV were utilized from 8 ICH patients previously hospitalized at our institution. Images were acquired on GE Healthcare 1.5T (256 x 192 x 5 mm, TE/TR = 72/4300) and 3T (384 x 384 x 4mm, TE/TR = 106/9800) scanners within four days of hospitalization. After being intensity-adjusted via z-score normalization, they were split into 1185 axial image slices. Those with visible clot or edema were manually segmented by an imaging scientist and ROI’s were verified by a neuroradiologist fellow. This process resulted in 185 images with visible clot and 218 with visible edema.
Network Architecture:
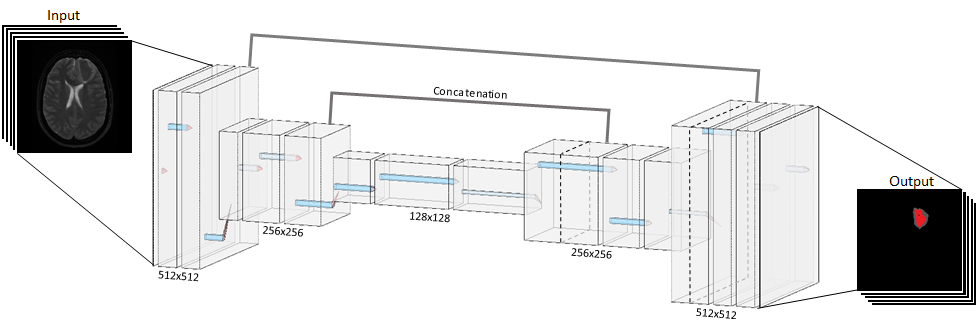
We utilized a Convolutional Neural Network (CNN) with a UNet convolution-deconvolution architecture (Fig 2) with periodic batch normalization. The loss function, 1 minus the Dice coefficient, attempted to maximize the overlap between the network’s segmentations and the manual segmentations. The full 512x512 pixel images were encoded and then decoded into a single binary mask of the same dimensions.
Training and Evaluation:
Grouping each image with its two corresponding segmentations, the data was randomly split, with 90% of the data categorized into a training dataset, and the remaining 10% used for validation.Two CNNs of the same architecture were trained over 100 epochs, with one network trained on the clot segmentations and the other on the edema segmentations. The models ultimately converged to a validation loss of 0.13 and 0.28 respectively on the clot and edema segmentations. Together, the outputs of these models show the focal area of ICH clot while edema demonstrates surrounding tissue under stress.
Results
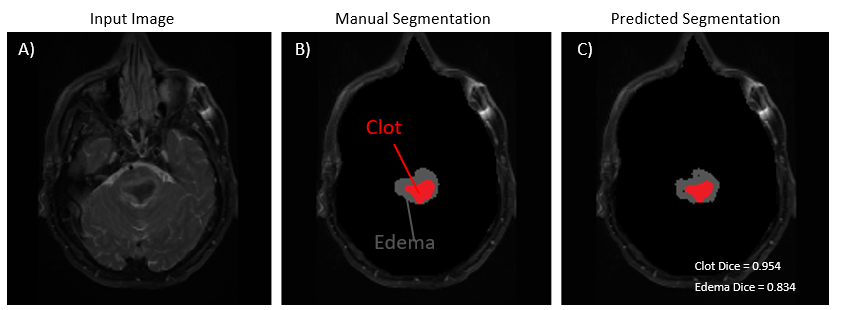
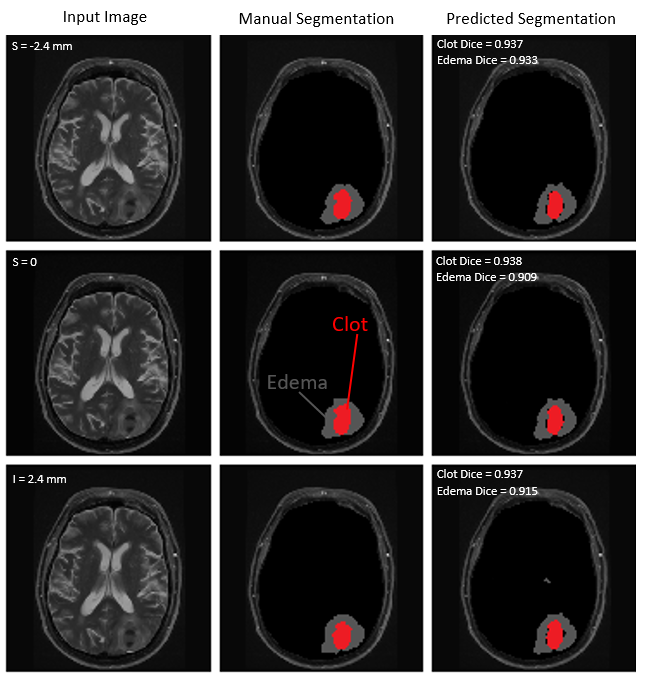
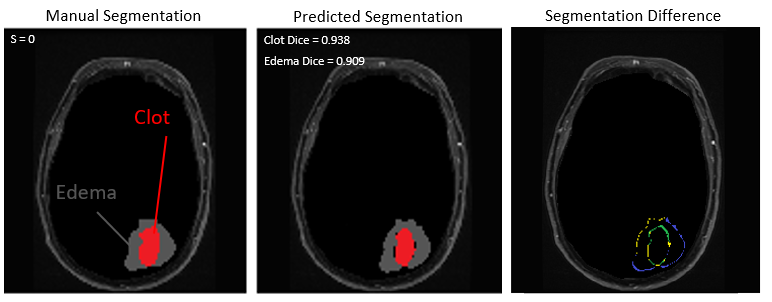
The Dice coefficients of the correspondence between the manually and automatically segmented regions over all of the validation data was 0.87 and 0.72 respectively for the clot and edema components. A representative segmentation shows strong agreement between the original input image (Fig. 3A), the manual segmentation (Fig. 3B) and the automatic segmentation (Fig. 3C). Figure 4 follows a similar format, instead showing a series of 3 adjacent slices to show how a 3D visualization could be generated from the automatic segmentation. The disparity between manual and automatic segmentation is visualized in Figure 5, which shows color coded over- and under- segmentation performed by the model, relative to manual operations, as well as the overlap between both models.Discussion
Though this model had strong performance on this dataset, the structural brain distortion created by ICH makes automatic segmentation of clot components face other challenges than in many clinical segmentation tasks. This study excluded intraventricular hemorrhages and diffuse hemorrhages that were not suitable for surgery. Further ML design challenges remain in using imaging within hours of hemorrhage onset, as the clot appearance changes over the first few hours as the clot de-oxygenates and T2 decreases dramatically. This concern is mitigated as most surgeons treat clots larger than 25 ml and require allowing the clot to stabilize for 24 hours before treatment.A series of consecutive segmented slices would provide 3D clot visualization. To minimize rebleeds, automatically segmenting and visualizing the clot would be valuable as neurosurgeons plan device approaches and the extent of evacuation warranted in each region of the clot as they aim to get below the 15ml residual clot guideline. The edema segmentation provides redundancy when making treatment decisions near the dangerous edge of the clot. Coupling this with existing Hololens technology [3] could provide a valuable tool for neurosurgeons in guided operations on such hemorrhages.
Conclusion
The ICH Segmentation Network provides fast and accurate segmentation of an ICH’s clotted blood and surrounding edema on a per-slice basis. This allows for convenient viewing of these cases in a multi-level format (Fig 4). Implementation with other image processing software will lead to real-time 3D imaging of an ICH patient’s brain to assist surgeons in minimally invasive operations to evacuate the clot.Acknowledgements
We acknowledge GE Healthcare and the University of Wisconsin - Madison ML4MI Program for research support.References
[1] Hanley DF, Thompson RE, Rosenblum M, Yenokyan G, Lane K, McBee N, Mayo SW, Bistran-HallAJ, Gandhi D, Mould WA, Ullman N, Ali H, Carhuapoma JR, Kase CS, Lees KR, Dawson J, Wilson A, Betz JF,Sugar EA, Hao Y, Avadhani R, Caron JL, Harrigan MR, Carlson AP, Bulters D, LeDoux D, Huang J, Cobb C,Gupta G, Kitagawa R, Chicoine MR, Patel H, Dodd R, Camarata PJ, Wolfe S, Stadnik A, Money PL, MitchellP, Sarabia R, Harnof S, Barzo P, Unterberg A, Teitelbaum JS, Wang W, Anderson CS, Mendelow AD,Gregson B, Janis S, Vespa P, Ziai W, Zuccarello M, Awad IA, Investigators MI. Efficacy and safety ofminimally invasive surgery with thrombolysis in intracerebral haemorrhage evacuation (MISTIE III): arandomised, controlled, open-label, blinded endpoint phase 3 trial. Lancet. 2019. Epub 2019/02/12. doi:10.1016/S0140-6736(19)30195-3. PubMed PMID: 30739747.Melander A, Olsson J, Lindberg G, Ciaria MV, Ariano M,Strom R, Gibney J, Weiss U, Turner B, O'Gorman P, Watts G, Powrie J, Crook M, Shaw K, Cummings M.35th Annual Meeting of the European Association for the Study of Diabetes : Brussels, Belgium, 28September-2 October 1999. Diabetologia. 1999;42(Suppl 1):A1-A330. Epub 1999/08/01. doi:10.1007/BF03375458. PubMed PMID: 27770183.
[2] Mould WA, Carhuapoma JR, Muschelli J, Lane K, Morgan TC, McBee NA, Bistran-Hall AJ, UllmanNL, Vespa P, Martin NA, Awad I, Zuccarello M, Hanley DF, Investigators M. Minimally invasive surgeryplus recombinant tissue-type plasminogen activator for intracerebral hemorrhage evacuation decreasesperihematomal edema. Stroke. 2013;44(3):627-34. doi: 10.1161/STROKEAHA.111.000411. PubMedPMID: 23391763; PMCID: 4124642.
[3] Moskwa R, Olsen M, Ahmad A, Block W, editors. Feasibility and Demonstration of Controlled,Comprehensive Delivery of Clot-busting Drugs for MR Image-Guided Intracerebral Clot Evacuation.International Society of Magnetic Resonance in Medicine; 2019; Montreal.
[4] Incekara F, Smits M, Dirven C, Vincent A. Clinical Feasibility of a Wearable Mixed-Reality Device in Neurosurgery. World Neurosurg. 2018 Oct;118:e422-e427. doi: 10.1016/j.wneu.2018.06.208 Epub 2018 Jul 3.
[5] LeNail, (2019). NN-SVG: Publication-Ready Neural Network Architecture Schematics.Journal of Open Source Software, 4(33), 747
Figures