4137
Temperature-induced chemical shift in single-shot echo-planar imaging1Department of Physics, Soochow University, Taipei, Taiwan, 2Department of Radiology, Brigham and Women's Hospital, Harvard Medical School, Boston, MA, United States, 3Biomedical Instrument Institute, School of Biomedical Engineering, Shanghai Jiao Tong University, Shanghai, China, 4Shanghai Shende Medical Technology Co., Ltd, Shanghai, China
Synopsis
The proton resonance frequency (PRF) shift, whereby the Larmor frequency varies with temperature, is the effect that enables most currently-employed MR thermometry methods. The present work aimed to demonstrate that such temperature-related frequency changes can also cause non-negligible spatial distortions in single-shot EPI. In addition to demonstrating the effect, a solution is also proposed here. Phantom experiments are presented that demonstrate the problem and its solution.
Introduction
Most current MR thermometry methods are based on the proton resonance frequency (PRF) shift1, whereby the Larmor frequency of water-based signals changes as temperature varies. The fact that frequency offsets can lead to image distortion is now new, as exemplified by well-known effects such as the chemical shift between water and fat signals as well as susceptibility-related image distortion2-3. Temperature-related frequency changes, on the other hand, are typically implicitly believed to be too subtle to cause any appreciable spatial shifts, which may be true with most imaging sequences but single-shot EPI4. For example, with an EPI echo-spacing of 1 ms the sampling bandwidth along ky would be 1 kHz; as such, a 20℃ change, which corresponds to a frequency shift of about 26 Hz at 3T, would cause a spatial shift roughly 2.6% of the FOV in size. The effect is shown here in phantom experiments, and an iterative warping algorithm is proposed to correct it.Methods
Focused ultrasound (FUS) heating experiments were performed in a tissue-mimicking phantom (Insightec). The transducer and phantom were placed in the bore of a GE 3.0T Signa system. Imaging was performed with a single-shot EPI sequence, TR = 1000 ms, effective TE = 53.9 ms, matrix size = 128x128 and echo spacing = 744 µs. The FUS energy delivery was performed using a single-element transducer, frequency = 1.5 MHz, physical radius = 50 mm, curvature radius = 100ms and acoustic power = 39 W.A pre-heating time frame was used as a phase reference as part of the PRF reconstruction. In a first step, temperature maps were reconstructed while correcting for the effect of background phase gradients, in a manner similar to Ref.3. Based on this initial estimate of relative temperature, the chemical shift Δy along y, in pixels, was obtained as: Δy = (Ny × 1.28 Hz/℃ × ΔT)/BWy, where ΔT is the temperature change, BWy (= 1/echo spacing) is the sampling bandwidth along ky, and Ny is the number of pixels along y. BWy/Ny represents the bandwidth per pixel. Using the ‘known’ error Δy, the image could be warped to undo the effect of the shift, using an algorithm originally developed for gradient linearity correction. As a result, new images were obtained that led to new maps ΔT(x,y) that could be employed through the equation above to obtain better-corrected images. This process could be repeated indefinitely, in the present work the process appeared to converge after 3 iterations, in the sense that Δy(x,y) remained mostly constant from one iteration to the next from this point onward.
Results
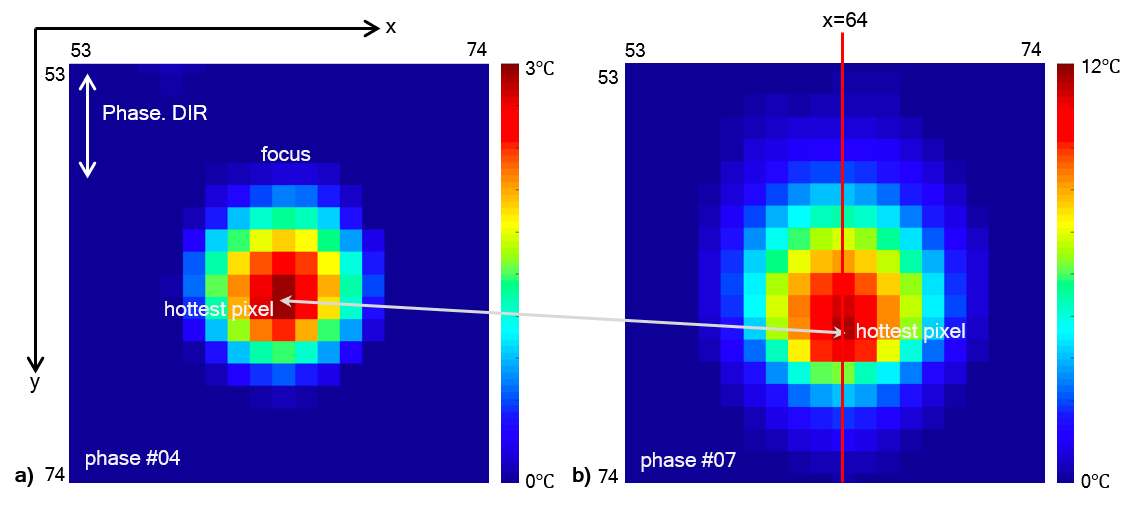
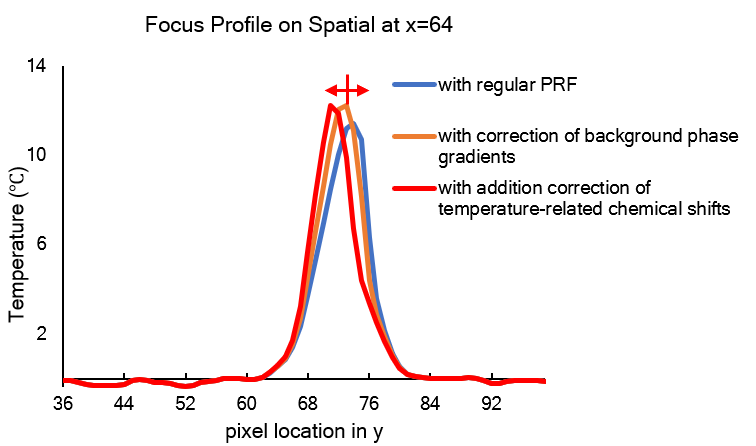
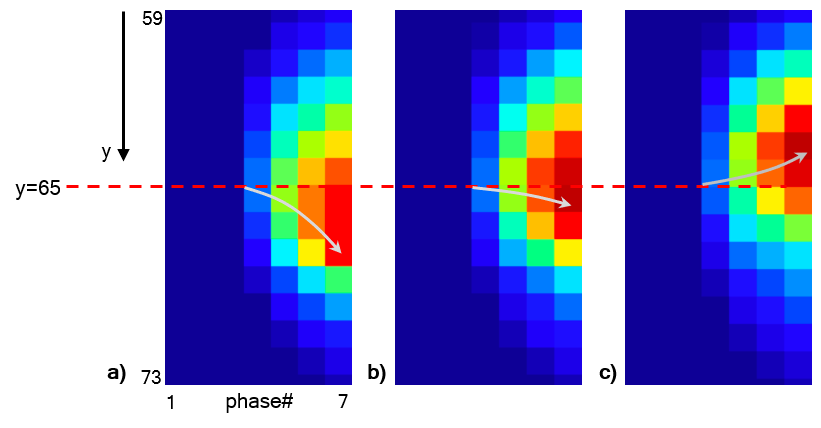
Fig. 1 shows an ROI around the focus at the moment of maximum heating (Fig. 1b, about 12℃) and at some prior time point when the temperature elevation was more modest (Fig. 1a, about 3℃). The location of the hottest pixel along y was clearly different in these two cases, see the gray line, and it was the temperature change itself that was responsible for the shift. The 1D locations indicated with a red line in Fig. 1b are analyzed in more detail in Fig. 2 and Fig. 3. In Fig. 2, the y profile at the time of maximum heating (about 12℃) is compared for three reconstruction scenarios: regular PRF, after background-gradient correction, and after further chemical shift correction. In Fig. 3, an M-mode display captures the time evolution of this 1D profile as heating occurs. When no (Fig. 3a) or partial (Fig. 3b) correction is applied, the y location of maximum heating drifts downward as heating progresses. In contrast, in Fig. 3c, the chemical shift relationship between heating and ΔT and Δy is accounted for, and the y location of maximum heating remains mostly constant with time.Discussion and Conclusion
Because of the relatively low sampling bandwidth achieved by single-shot EPI in the ky direction, frequency-offsets associated with the PRF effect can lead to substantial spatial shifts. Phantom results were presented that depicted this effect, and an iterative correction method was proposed to correct it. The size of the shift depends on the echo spacing of the EPI sequence, which in turn depends primarily on gradient performance and spatial resolution along x.Acknowledgements
This work was supported by 2015 and 2017 Key Project of Shanghai Science and Technology Commission (No. 15441900700, 17441906400), National Key Research and Development Program of Ministry of Science and Technology (No.2017YFC0108900), National Natural Science Foundation of China (No.81727806, 11774231), and in part by NIH grants P41EB015898 and R03EB025546.References
1. Rieke V, Butts Pauly K. MR thermometry. Journal of Magnetic Resonance Imaging: An Official Journal of the International Society for Magnetic Resonance in Medicine. 2008 Feb;27(2):376-90.
2. Sprinkhuizen SM, Konings MK, van der Bom MJ, Viergever MA, Bakker CJ, Bartels LW. Temperature-induced tissue susceptibility changes lead to significant temperature errors in PRFS-based MR thermometry during thermal interventions. Magnetic resonance in medicine. 2010 Nov;64(5):1360-72.
3. Mei CS, Chu R, Hoge WS, Panych LP, Madore B. Accurate field mapping in the presence of B0 inhomogeneities, applied to MR thermometry. Magnetic resonance in medicine. 2015 Jun;73(6):2142-51.
4. Dadakova T, Gellermann J, Voigt O, Korvink JG, Pavlina JM, Henning J, Bock M. Fast PRF-based MR thermometry using double-echo EPI: in vivo comparison in a clinical hyperthermia setting. Magnetic Resonance Materials in Physics, Biology and Medicine. 2015 Aug 1;28(4):305-14
Figures