4133
Real-Time Temperature Monitoring during MR Imaging Guided Photothermal Therapy1Institute of Science and Technology for Brain-Inspired Intelligence, Fudan University, Shanghai, China, 2School of Chemistry and Molecular Engineering, East China Normal University, Shanghai, China, 3Human Phenome Institute, Fudan University, Shanghai, China
Synopsis
It is a challenge that accurate monitoring the spatial distribution of photothermal transducing agents (PTAs), meanwhile, real-time mapping temperature in photothermal therapy. Here, we propose an effective strategy that integrates T1 and MR temperature imaging for tracking nanoPTAs and real-time temperature monitoring in vivo. The synthesized nanoPTAs equip with favorable T1 performance and marginal susceptibility guaranteeing the accuracy of temperature mapping. The time resolution is 20 seconds, and the detection accuracy of temperature change is as low as 0.1K, which contributes to promoting the clinical application of photothermal therapy.
Introduction
Photothermal therapy (PTT) that employs photothermal transducing agents (PTAs) to convert absorbed light energy into heat for eradicating tumor is an effective therapeutic method1-3. As the damage to peritumoral normal tissue including disrupting cell components, changing membrane permeability, and even denaturing tissue structural proteins are inevitable during conventional PTT procedure that rapidly increase the temperature along the tumor and normal tissue4,5. Evaluating the delivery efficiency and spatial distribution of nanoPTAs, followed by the remote mapping and accurate monitoring of local temperature is essential for PTT optimization, i.e. maximizing thermal ablation of the tumor and minimizing damage to the healthy tissue.In the current study we integrated T1 weighted imaging (T1WI) and magnetic resonance temperature imaging (MRIT) to guide PTT on the mice model using nanoPTAs doped with Gd3+. The time resolution of the temperature mapping was 19 seconds and the detection accuracy of temperature change was approximately as low as 0.1℃, which were of great significance to precisely guide PTT and promote the clinical application.
Methods
The nanoPTAs doped with Gd3+ were synthesized and the performance of the synthesized nanoPTAs were firstly examined on the agarose gel phantom. The relationship between temperature and phase angle were evaluated using the proton resonance frequency shift (PRFS) thermometry6,7.In vivo MR imaging was conducted on three groups of mice: the intratumor injection group, the intravenous injection group and the control group that non-injection of PTAs. T1WI was scanned for locating the PTAs and MRTI were performed for monitoring temperature change during PTT when each mouse was lighted for 5 minutes by 808-nm laser. The experiment groups were conducted another same procedure after one week.
Results and Discussion
The doping of Gd3+ ions shortens T1 and is convenient for tracking nanoPTAs. The T1 performance of the agarose gel phantom is shown in Figure1A, B and the longitudinal relaxation rate is approximately 1.2 mM-1 s-1. As the local phase is vulnerable to strong susceptibility, we investigated the magnetism of the nanoPTAs. The results demonstrate the nanoPTAs are equipped with the exceedingly weak susceptibility (approximately 1.04*10-6 emu g-1 Oe-1), indicating they have marginal magnetism and cause hardly interference to local phase. Therefore, the nanoPTAs doped with Gd3+ are suitable for temperature mapping using PRFS thermometry and linear relationship between the phase angle and temperature was observed in Figure1C.We also tested the performance of iron-based nanoPTAs and demonstrated that iron-based nanomaterials (including Fe3O4) were not suitable for monitoring temperature. Because iron has a great influence on local phase and sharp phase fluctuations during MR scanning. In Figure1D, the linear relationship between the phase angle and temperature is destroyed due to influence of iron.
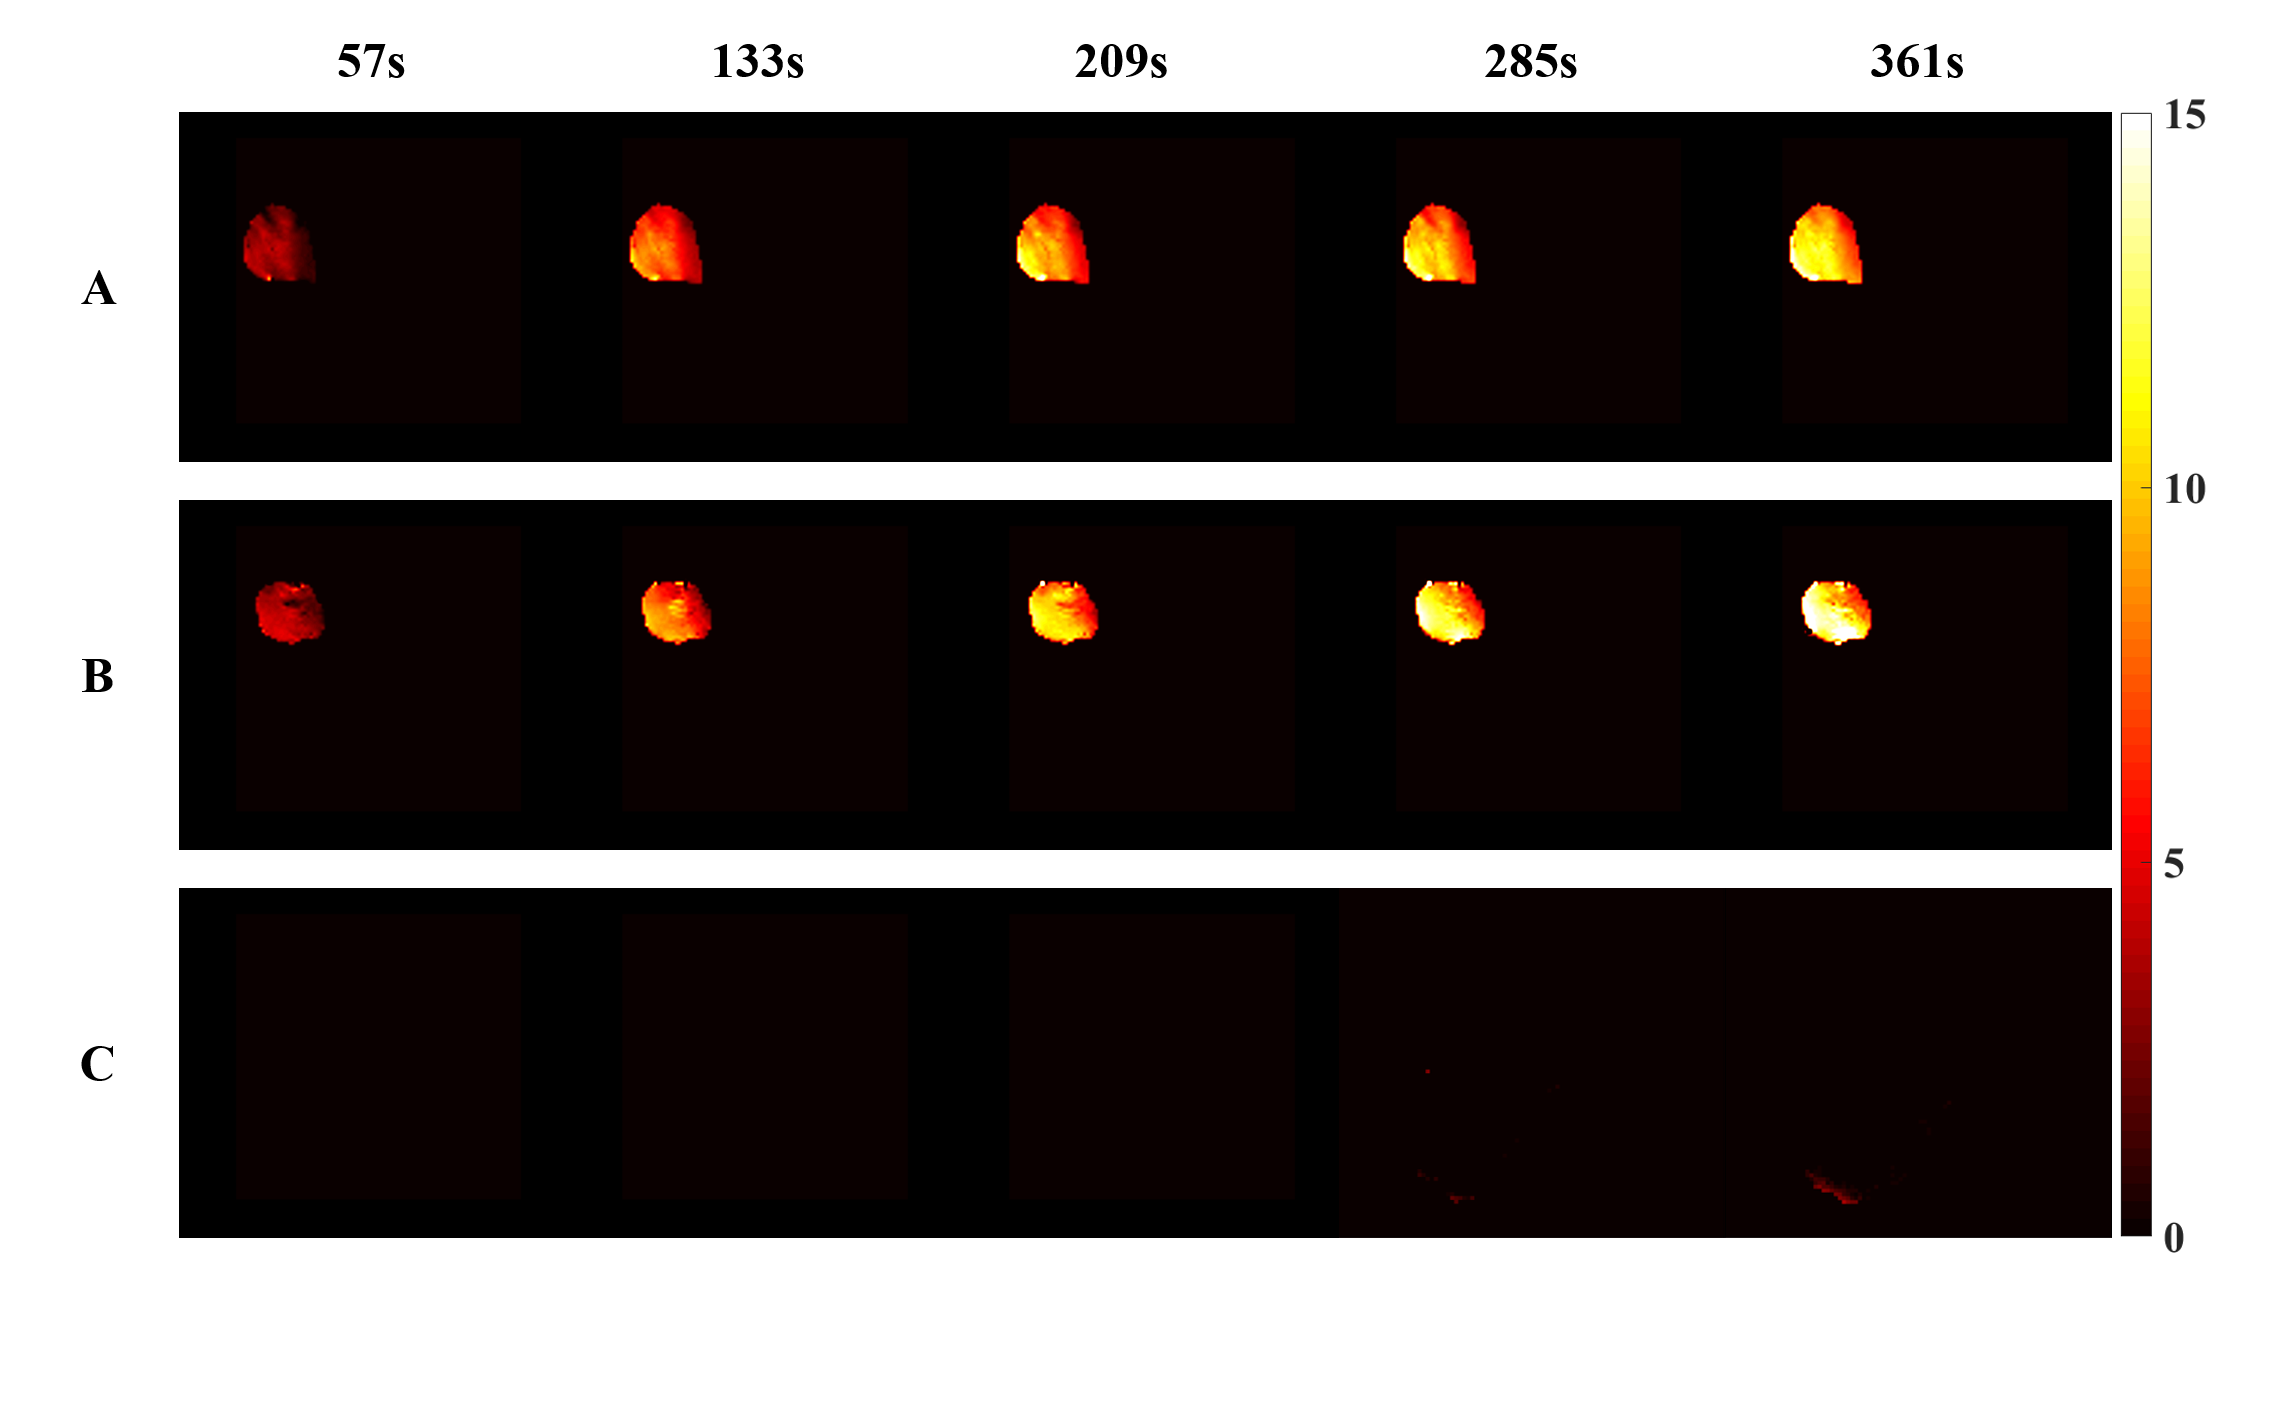
Location of nanoPTAs was targeted on T1WI in both intratumor injection group and intravenous group as shown in Figure2. Temperature mapping during PTT was obtained in virtue of the result on the agarose gel phantom, Figure3A, B. The max temperature change could reach 12℃ satisfied the effective temperature of thermal therapy. Simultaneously, the temperature mapping time resolution was 19 seconds and the detection accuracy were around 0.1℃. Compared with the control group, precious few temperature changes were observed as shown in Figure3C, indicating that the temperature mapping could assist in the guidance of PTT.
Conclusion
In conclusion, we proposed an innovative method that integrated T1WI and MRTI for efficiently evaluating the spatial location of nanoPTAs, and accurately monitoring the real-time temperature change in vivo during PTT. The method could reveal the spatial temperature change with high accuracy, and further ensure the effective ablation of the tumor with minimal damage to peritumoral normal tissue, which further promoted the clinical application of PTT, such as interventional PTT surgery.Acknowledgements
This work was supported by Shanghai Municipal Science and Technology Major Project (No.2017SHZDZX01), Shanghai Municipal Science and Technology Major Project (No.2018SHZDZX01) and ZJLab, Shanghai Natural Science Foundation (No. 17ZR1401600) and the National Natural Science Foundation of China (No. 81971583).References
1.Liu Y, Bhattarai P, Dai Z, Chen X. Photothermal therapy and photoacoustic imaging via nanotheranostics in fighting cancer. Chemical Society Reviews 2019;48(7):2053-2108.
2.Chen Q, Hu Q, Dukhovlinova E, et al. Photothermal Therapy Promotes Tumor Infiltration and Antitumor Activity of CAR T Cells. Advanced Materials 2019;31(23).
3.Robinson JT, Tabakman SM, Liang Y, et al. Ultrasmall Reduced Graphene Oxide with High Near-Infrared Absorbance for Photothermal Therapy. Journal of the American Chemical Society 2011;133(17):6825-6831.
4.Gabano E, Colangelo D, Ghezzi AR, Osella D. The influence of temperature on antiproliferative effects, cellular uptake and DNA platination of the clinically employed Pt(II)-drugs. Journal of Inorganic Biochemistry 2008;102(4):629-635.
5.Storm FK, Harrison WH, Elliott RS, Morton DL. NORMAL TISSUE AND SOLID TUMOR EFFECTS OF HYPERTHERMIA IN ANIMAL-MODELS AND CLINICAL-TRIALS. Cancer Research 1979;39(6):2245-2251.
6.Quesson B, de Zwart JA, Moonen CTW. Magnetic resonance temperature imaging for guidance of thermotherapy. Journal of Magnetic Resonance Imaging 2000;12(4):525-533.
7.Depoorter J, Dewagter C, Dedeene Y, Thomsen C, Stahlberg F, Achten E. NONINVASIVE MRT THERMOMETRY WITH THE PROTON-RESONANCE FREQUENCY (PRF) METHOD - IN-VIVO RESULTS IN HUMAN MUSCLE. Magnetic Resonance in Medicine 1995;33(1):74-81.
Figures