4132
Thermometry of Fat-Water-mixed Tissues based on Synthesized Temperature Dependence of T2's of Methylene and Methyl in conjunction with PRF of water1Department of Human and Information Sciences, School of Information Science and Technology, Tokai University, Hiratsuka, Japan, 2Department of Radiology, School of Medicine, Tokai University, Isehara, Japan
Synopsis
An practical MR thermometry technique for fat-water mixed tissues was proposed. Fatty tissue temperature was quantified by T2 synthesized from T2’s of methylene chain and terminal methyl obtained by chemical shift suppression of water and surrounding fatty acid components. While the aqueous tissue temperature was estimated by PRF shift of water proton. Those maps were then integrated into one based on the fat and water contents in each voxel. The resultant in vitro images demonstrated the usefulness of the technique.
INTRODUCTION
In thermal therapy of tumor in breast or abdominal organs, noninvasive MR thermometry for fat tissues is useful for protecting surrounding normal tissues and maximizing therapeutic effect. As fat tissue has no temperature dependence in proton resonance frequency, various techniques have been studied to use relaxation times like T1 and T21-5. For accurate temperature measurement, it is preferable to consider the difference of temperature dependence of T1 and T2 of different chemical shift components2. Use of T1 of methylene chain (-CH2-) and terminal methyl (-CH3) followed by multiple DIXON technique seemed to be feasible, but separation of these components were only successful in homogeneous phantoms3. In addition, rapid T1 measurements using variable flip angle (VFA) technique was sensitive to B1 inhomogeneity1, 3. Instead, chemical shift selective suppression (CHESS) of water signal and the minor fat proton components around the water band is relatively more robust than the DIXON type separation. Moreover, T2 measurement with CPMG of different TE’s is also more tolerant against than the VFA T1 measurements. Therefore, in this study, a thermometry technique using temperature coefficient of synthesized T2, named T2,syn, of the two major fat proton components, methylene chain (-CH2-) and terminal methyl (-CH3), was examined for fat using CHESS-prepared CPMG sequence. The technique was then combined with the PRF-based thermometry for aqueous tissue.METHODS
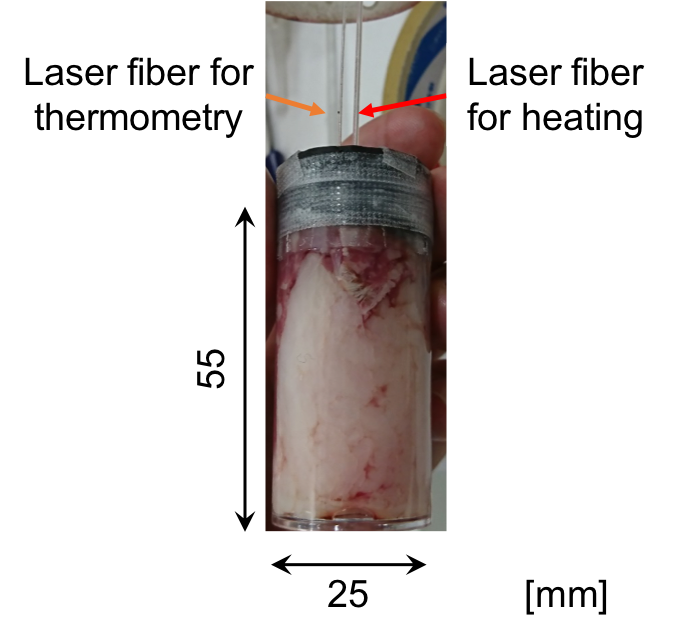
Fat has nine chemical shift components according to the composition of the hydrogen sites. The primary components are stemmed from -CH2- and -CH3. Assuming that the contribution from the other chemical shift components are negligible, a “synthesized” temperature calibration of the primary components was derived based on our previous MRS observation results at 9.4T using five different bovine fat samples in vitro2. Temperature imaging experiments were performed on bovine fat samples in vitro under laser heating as shown in Fig. 1. The laser power was set to 0.5-1 W and the duration was 198 s. Value of T2,syn, which is the synthesized values of T2 of mixed -CH2- and -CH3 signals were obtained after using CHESS pulses to suppress water and other chemical shift components of fatty acids. The bandwidth for the CHESS was 2000Hz (±2.5ppm), while the central frequency was on water peak at the room temperature (25oC). The flip angle (FA) was 90o. The imaging conditions of FSE with CPMG were as follows; TR, 3000-4000 ms; TE, 8.1, 113.4, 216.7, 324.0, 429.3, 534.6, 639.9, 745.2 ms; ETL, 8-13; FOV, 30 x 30 mm; acquisition matrix, 64×64. T2,syn value at each voxel was estimated by a nonlinear LMS. The T2,syn value were then converted to temperature based on the calibration. As for water temperature, CHESS-based fat suppression followed by a standard SPGR sequence was used so as to obtain PRF shift. The bandwidth and FA for CHESS was identical as above, while the central frequency was set at -CH2- peak. The imaging conditions were TR, 50ms; TE, 2.71ms; FA, 10o with identical settings for FOV and acquisition matrix as above. After T2,syn-based fat temperature and PRF-based water temperature maps were obtained, those maps were added with weights determined from signal intensity fraction of water or methylene and methyl protons against the total intensity.RESULTS AND DISCUSSION
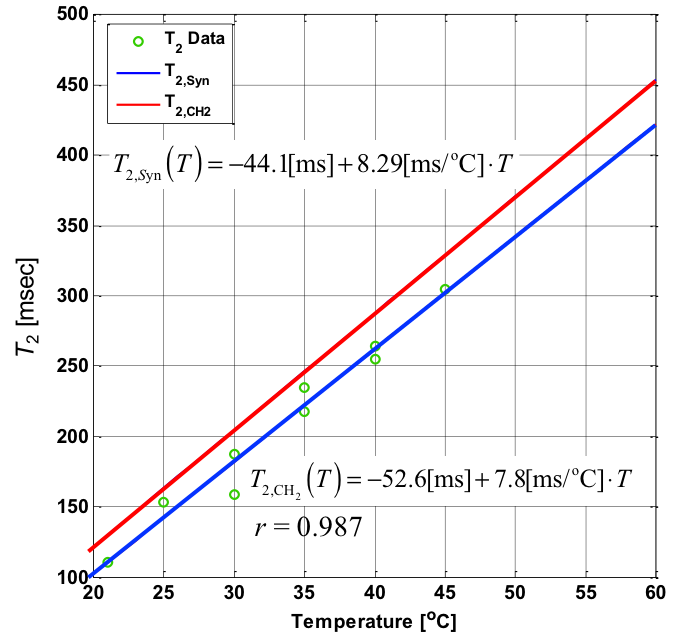
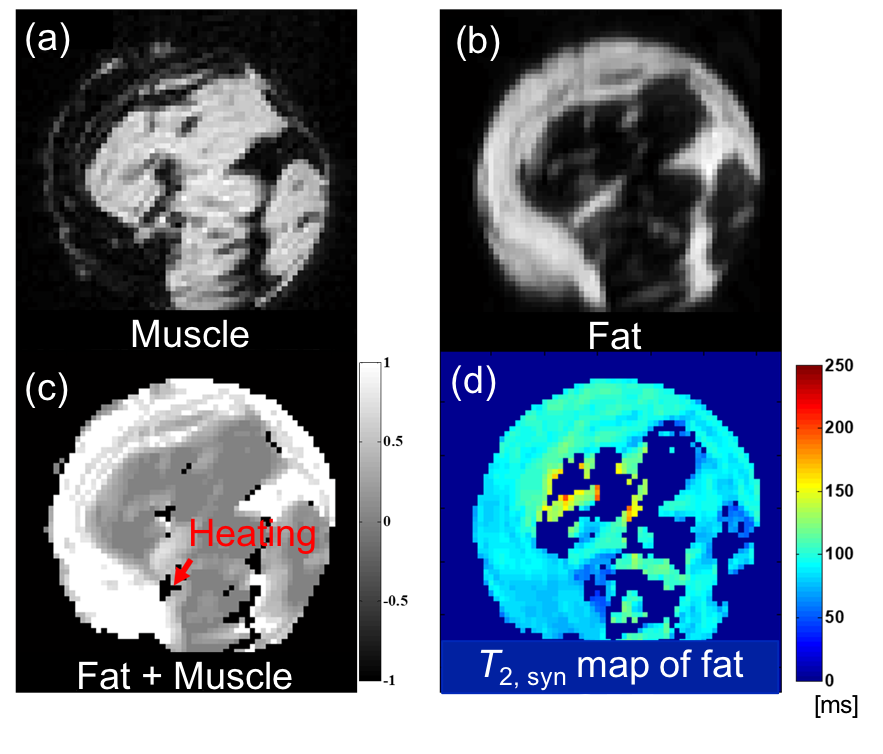
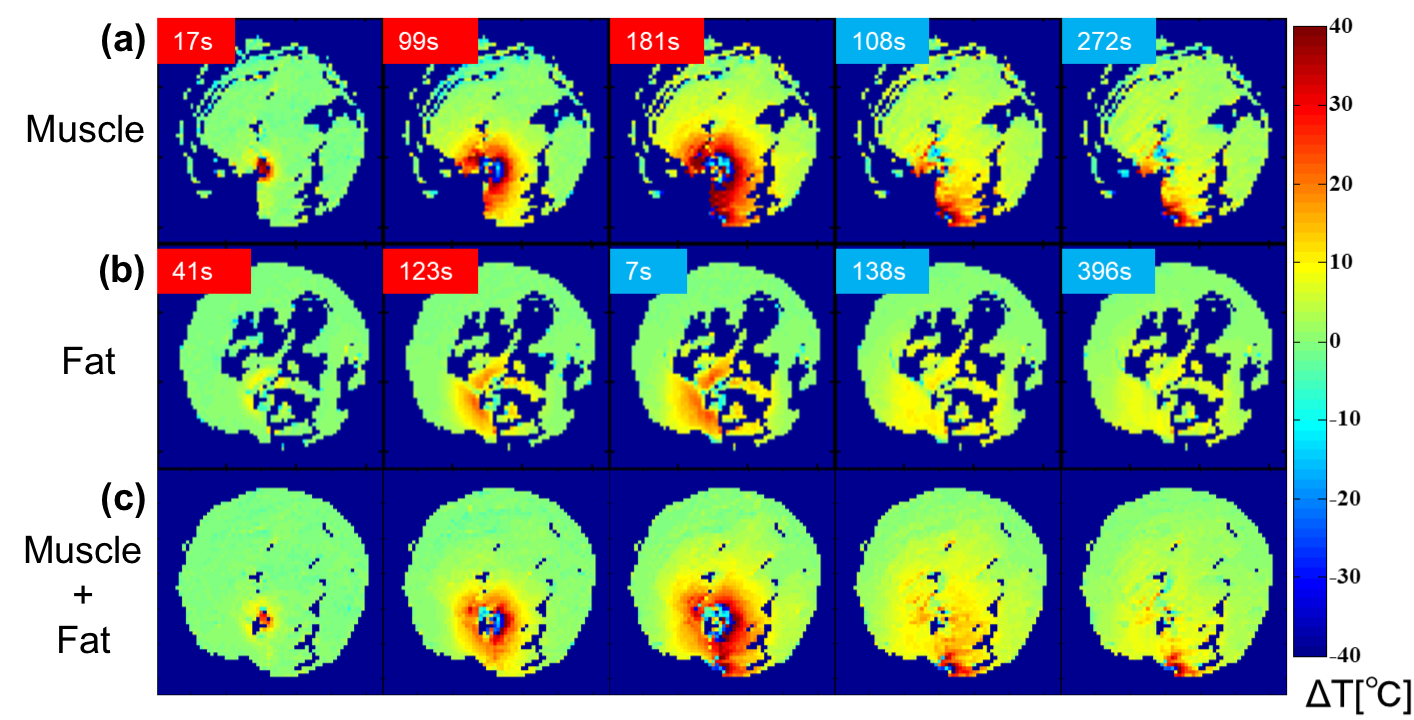
Based on the temperature changes of T2’s of -CH2- and CH3 signals, the temperature coefficient of T2,syn was determined to be 8.3 ms/oC (3.2% at 37 oC) as shown in Fig. 2. The CHESS suppressed the small proton signals of chemical shift components of fatty acid around water effectively leaving the -CH2- and CH3 signals. Based on this temperature coefficient of T2,syn, temperature elevation in fat tissue was mapped as shown in Fig. 3. The resultant temperature images clearly and quantitatively showed the laser induced temperature change in heating and cooling processes in the sample. Figure 4 shows the fat-suppressed (a), water-suppressed (b) and non-suppressed (c) images of the sample. The heating fiber location is on the boundary of bulk fat and muscle as depicted in (c) . The maps in Fig. 5 obtained by PRF for water in voxels and that by T2,syn for fat were successfully captured the temperature change in both contents. The final, integrated map visualize the temperature distribution smoothly around the tissue boundary. Compared with the previously reported results, the present temperature maps considers the effect from the different chemical shift components of fat.CONCLUSION
Use of the synthesized temperature property of T2,syn of -CH2- and -CH3 with CHESS-prepared CPMG is effective to image fat tissue temperature. In conjunction with the PRF of water obtained by fat suppression, the proposed technique successfully visualize the temperature distribution in the fat-water mixed tissue regions. Imaging conditions including ETL and TE settings should be optimized for making this technique sufficient in clinical setting at 3T scanner.Acknowledgements
The authors thank Mr. Kenichiro Kurihara for his effort in experiments and software developments while he was a postgraduate student in our laboratory.References
(1) Nick T et. al. Hybrid proton resonance frequency/T1 technique for simultaneous temperature monitoring in adipose and aqueous tissues. Magn Reson Med, 2013;69:62-70.
(2) Kuroda K et. al. Temperature dependence of relaxation times in proton components of fatty acids. Magn Reson Med Sci, 2011;10(3):177-183.
(3) Kuroda K et al. Feasibility of noninvasive temperature imaging of fat based on magnetic resonance relaxation times of lipid proton components. Therm Med, 2012; 28(4):87-96.
(4) Baron P et al. In vivo T2 -based MR thermometry in adipose tissue layers for high-intensity focused ultrasound near-field monitoring. Magn Reson Med. 2014;72(4):1057-64.
(5) Parmala M et. al. Temperature Measurement inHuman Fat With T2 Imaging J Magn Reson Imaging, 2016;43(5):1171-1178.
Figures