4130
A k-space reconstruction method to increase the accuracy of PRF thermometry measurements1Biomedical Instrument Institute, School of Biomedical Engineering, Shanghai Jiao Tong University, Shanghai, China, 2Department of Radiology, Brigham and Women's Hospital, Harvard Medical School, Boston, MA, United States, 3Department of Physics, Soochow University, Taipei, Taiwan
Synopsis
It has been shown that spatial gradients in the background phase of an image can cause artifacts/errors in MRI temperature measurement. In the present work, a reconstruction method called 'k-space energy spectrum analysis' (KESA), originally developed in the context of partial-Fourier imaging, is adapted and tested here for its ability to correct for this particular problem. Compared to the previously-published image-based method already available for this purpose, the present k-space based method proved considerably more robust in the presence of high levels of noise, as tested with phantom data.
Introduction
There are many reasons why the phase of an MR image may vary spatially. Most notably, susceptibility effects can cause sharp phase variations, especially near air-tissue and/or tissue-bone interfaces. It was demonstrated that spatial gradients in background phase can cause errors in MR proton resonance frequency (PRF) thermometry1-3. We are testing here a reconstruction method called 'k-space energy spectrum analysis' (KESA)4, originally developed in the context of partial-Fourier imaging, in its ability to correct for this particular type of problem. A prior method does exist for this purpose3; it includes evaluating the phase gradients directly in image space. The present work compares the proposed k-space method to the prior image-based method, in terms of robustness to random noise.Methods
Focused ultrasound (FUS) heating experiments were performed in a tissue-mimicking gel phantom placed inside the head coil of a GE Signa 3.0T scanner. The parameters for MR imaging were: spoiled gradient echo sequence, TR/TE = 17/10 ms, FOV = 192×192 mm2, matrix size = 128×128, BW = ±5.81kHz. The parameters for FUS heating were: single-element transducer (physical radius = 50 mm, curvature radius = 100 mm), frequency = 1.5 MHz, transducer and phantom in a container filled with de-gassed water, 78 W of acoustic power delivered over 20 s.Susceptibility-induced variations in signal frequency and image phase were emulated by de-adjusting the shim settings. More specifically, experiments were performed using one of two scenarios: with optimized or with de-adjusted shim settings. Experiments were otherwise identical and a cooling period of 10 min was introduced in-between consecutive experiments. Data acquired with properly-adjusted shim settings were considered the reference, and the goal was to correct for temperature errors caused by phase gradients in the data acquired with de-adjusted shim settings.
Through the Fourier shift theorem, linear phase gradients in image space cause a shift in k-space, referred to here as Δk, which can be thought of as an error in TE, referred to as ΔTE. Both methods considered here, whether KESA or the one in Ref.3, are capable of generating an echo shift map, Δk(x,y). In KESA, this Δk map is generated by detecting the intensity drop that occurs at each given point (x,y) as pixels along the kx axis progressively get replaced by zeros. In contrast, in the method from Ref.3, a field map is measured and k-space shifts are calculated from Δk = γ×TE×▽B0×FOV, where γ is the gyromagnetic ratio for hydrogen (42.576MHz/T), TE is the nominal echo time, ▽B0 is the gradient of the field map, and FOV is the size of field of view. With either method, the TE error map, ΔTE(x,y), can be obtained from Δk as: ΔTE = Δk/BW, where BW is the full acquisition bandwidth. When performing PRF processing at a given (x,y) location, the 'true' TE value, TEtrue(x,y) = TE + ΔTE(x,y), is used in place of the nominal TE value to obtain the corrected temperature measurement.
To test robustness to noise, eight different levels of Gaussian white noise were added to the original k-space data. Data obtained with de-adjusted shim settings were combined with further noise, reconstructed with either method, and compared to reference data obtained with properly-adjusted shim settings. Methods were compared for their ability to correct for background phase variations, as a function of noise level. More specifically, the variance of temperature measurements in a non-heated (i.e., ΔT = 0) area was used as metric to evaluate noise levels in these results.
Results
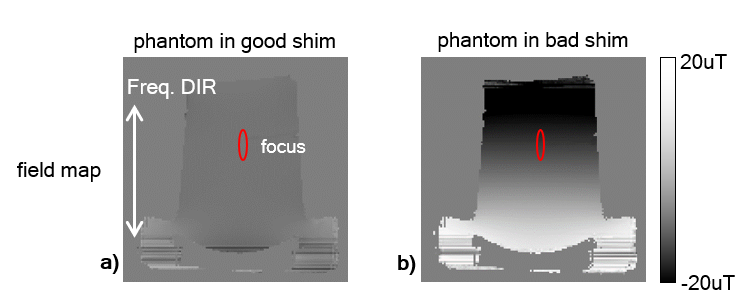
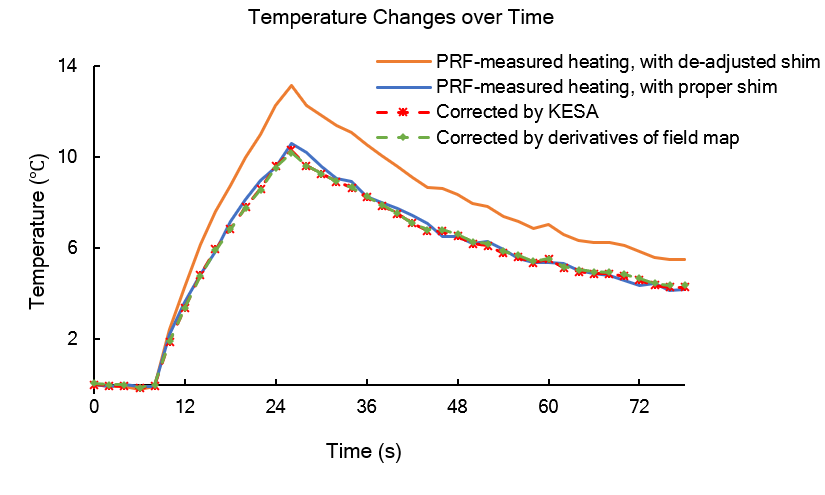
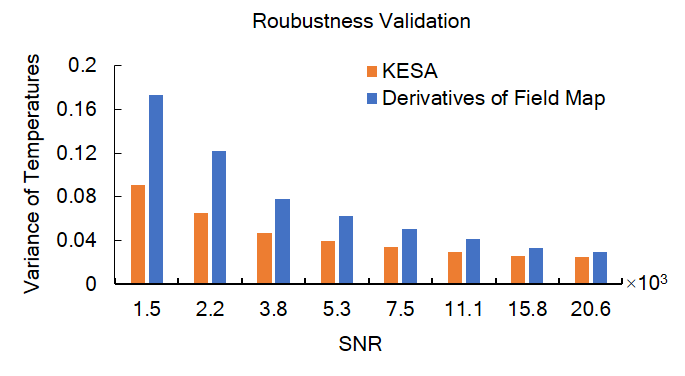
Fig. 1 shows images obtained with proper (Fig. 1a) and de-adjusted (Fig. 1b) shim settings. The location of the focus of the FUS transducer is highlighted with a red oval, although no heating is present in Fig. 1. The temperature evolution for the hottest pixel at focus is shown in Fig. 2. The reference result, obtained by regular PRF thermometry from properly-shimmed data, is shown using a blue line. In the presence of background phase variations, regular PRF led to temperature heating errors at the point of maximum heating as large as 30% in this case, see orange line. Both KESA and the method from Ref.3, applied to data obtained with de-adjusted shim settings, proved capable of correcting temperature errors, providing results that mostly matched the reference data, see green and red dashed lines compared to the blue full line.Fig. 3 reveals the advantage of the present KESA approach over the prior method from Ref.3. In high-SNR situations, as seen Fig. 2, the two methods are nearly equivalent. However, as SNR is decreased, the k-space approach proposed here proves more resilient and provides a smaller noise-related variance in temperature measurements.
Discussion and Conclusion
Both the present k-space method based on KESA and the prior image-based method from Ref.3 can correct for PRF temperature measurement errors caused by background phase variations. However, the k-space based method proposed here proves more resilient to noise, as tested here in lower-SNR situations.Acknowledgements
This work was supported by 2015 and 2017 Key Project of Shanghai Science and Technology Commission (No. 15441900700, 17441906400), National Key Research and Development Program of Ministry of Science and Technology (No.2017YFC0108900), National Natural Science Foundation of China (No.81727806, 11774231), and in part by NIH grants P41EB015898 and R03EB025546.References
1. Sprinkhuizen SM. The influence of background gradients in multi gradient-echo MR thermometry. In Proceeding of the 17th Annual Meeting of ISMRM, Honolulu, Hawaii, USA, 2009. Abstract 4406.
2. Sprinkhuizen SM, Konings MK, van der Bom MJ, Viergever MA, Bakker CJ, Bartels LW. Temperature-induced tissue susceptibility changes lead to significant temperature errors in PRFS-based MR thermometry during thermal interventions. Mag Reson Med 2010; 64; 1360-1372.
3. Mei C-S, Chu R, Hoge WS, Panych LP, Madore B. Accurate field mapping in the presence of B0 inhomogeneities, applied to MR thermometry. Magn Reson Med 2015; 73(6):2142-51.
4. Chen N-K, Oshio K, Panych LP. Application of k-space energy spectrum analysis to susceptibility field map and distortion correction in gradient-echo EPI. Neuroimage. 2006 Jun 1; 31(2):609-22.
Figures