4126
MR thermometry based on PRF using echo planar time-resolved imaging (EPTI)1Department of Engineering Physics, Tsinghua University, Beijing, China, 2Orthopedic Department, Aerospace Center Hospital, Beijing, China, 3Athinoula A. Martinos Center for Biomedical Imaging, Massachusetts General Hospital, Charlestown, MA, United States, 4Harvard-MIT Health Sciences and Technology, Massachusetts Institute of Technology, Cambridge, MA, United States, 5Department of Electrical Engineering and Computer Science, Massachusetts Institute of Technology, Cambridge, MA, United States, 6Department of Biomedical Engineering, School of Medicine, Tsinghua University, Beijing, China
Synopsis
Proton resonance frequency (PRF) of water protons is widely utilized in MR thermometry. EPI sequence is often used to speed up the imaging rate, but suffers from geometric distortion and blurring. Here we proposed a rapid temperature mapping method through the EPTI sequence. EPTI sequence is a new multi-shot EPI technique capable of rapidly obtaining distortion-free images. Via this method, greater speed is achieved for monitoring temperature, which makes real-time temperature mapping possible.
Introduction
Temperature monitoring plays a pivotal role in thermal therapy processes. Magnetic resonance imaging-guided microwave ablation is a safe and effective approach to tumor thermal treatment. Echo planar imaging (EPI) is a popular technique to improve acquisition speed, whereas it only produces low-resolution and blurry images as a result of T2 decay and B0 inhomogeneity.Echo planar time-resolved imaging (EPTI) is a multi-shot EPI technology. By acquiring multi echoes at each acquisition stage, both image quality and acquisition speed can be ensured simultaneously1. In this study, we introduced an EPTI-based MR thermometry method using the information of proton resonance frequency shift (PRFS)to acquire a temperature distortion-free maps at high speed which provides a potential temperature monitoring approach for tumor hyperthermia applications.
Method
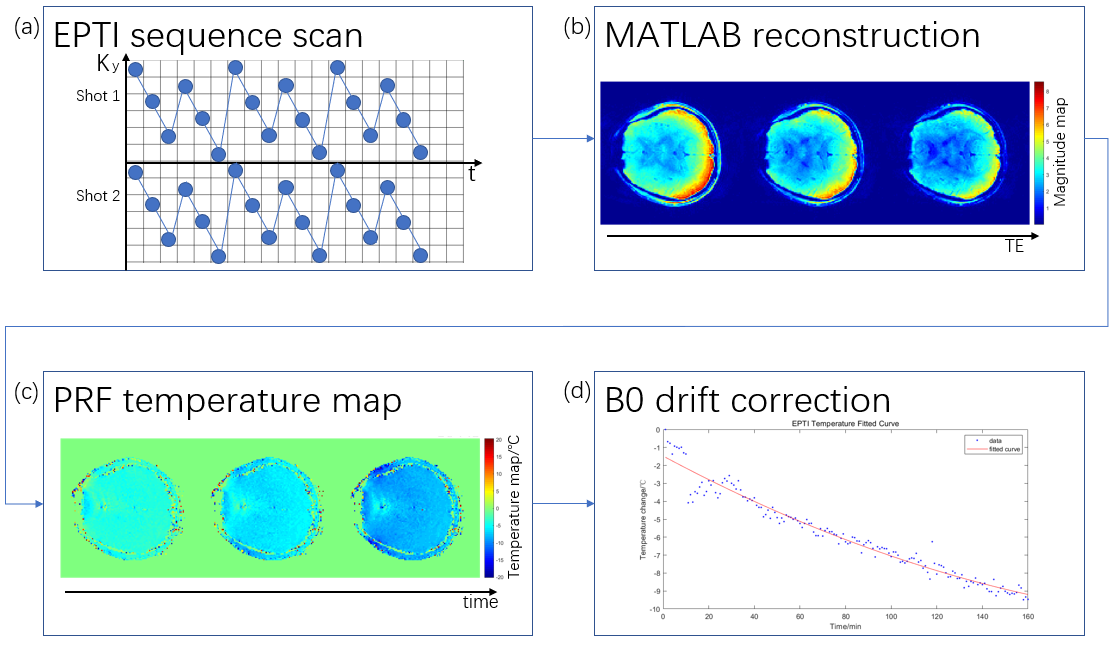
An agar phantom and an in vivo human brain scan experiment were performed to validate the feasibility of temperature measurement using the EPTI sequence. Figure 1 illustrates the experiment steps. Both experiments were performed on a Siemens Prisma 3T scanner with a 32-channel head coil (Siemens Healthineers, Erlangen, Germany).An agar phantom was heated by a microwave oven up to 40℃ and subsequently underwent a 14-minute scan consisting of two 7-minute acquisition periods (a short calibration was performed before each acquisition period) during the natural cooling process. A time series of data was acquired using the following parameters: 96×96×14 matrix size and 2×2×4 mm3 resolution. 48 echoes were acquired in total with TEs ranging from 7.6 msec to 38.1 msec. Data were also acquired using conventional dual-echo GRE (gradient echo) sequence (10 msec and 20 msec TEs) for temperature measurements as comparison. The scanning protocols of the dual-echo GRE scan were consistent with the EPTI scan. As the GRE sequence has proved its capability of PRF thermometry2, corresponding GRE measurements can be used to verify the reliability of EPTI thermometry. The temperature-time curves were fitted by an exponential function (Newton's law of cooling3) to evaluate the temperature measurements.
In order to acquire in vivo human brain measurements, one healthy volunteer was scanned for 5 minutes using the EPTI sequence with the following parameters: 120×120×10 matrix size, 2×2×3 mm3 resolution. 42 echoes with diverse TEs were acquired, ranging from 13.5 msec to 40.6 msec. Standard deviation and errors were calculated to evaluate the applicability of this approach.
Due to minimal movement of the agar phantom and human brain during the scans, a single reference image (i.e. the first obtained frame) was sufficient to obtain temperature mappings free of motion artifacts.
Signals acquired from different echoes in a single EPTI acquisition were used to jointly calculate a mean temperature change. Moreover, in order to correct for the measurement error caused by B0 drift in the human scan, a lower-order polynomial model was introduced to fit the B0 drift.
Result and Discussion
Phantom experiment
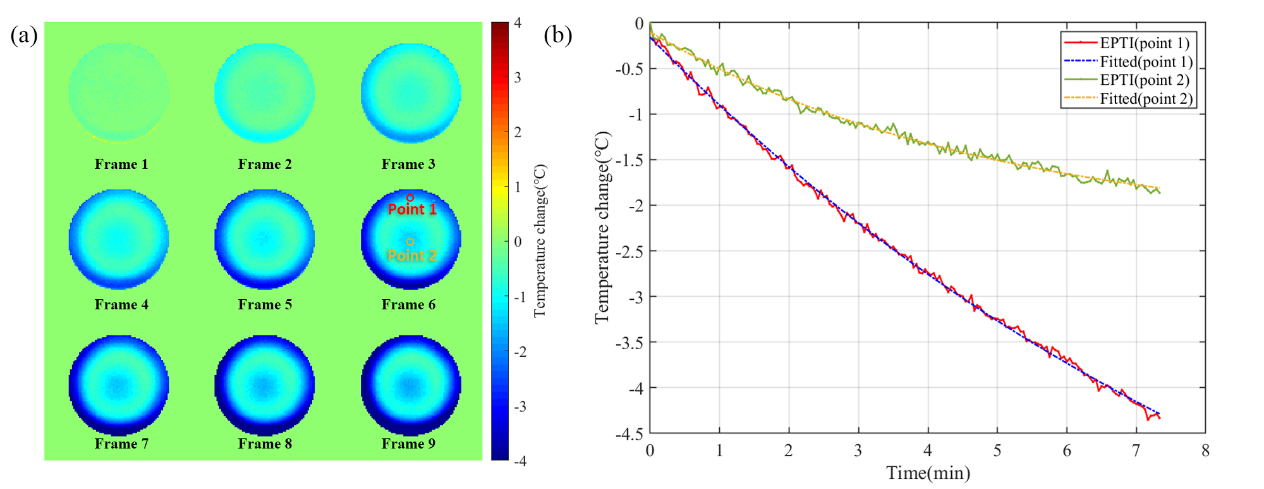
Figure 2 shows the temperature measurement results of the phantom cooling process based on EPTI imaging. According to Newton’s law of cooling3, the temperature-time curve can be fitted as the following exponential form:$$T(t)=Ae^{-kt}+C$$The EPTI measurements fit well with the cooling equation, which prove the feasibility of EPTI thermometry.
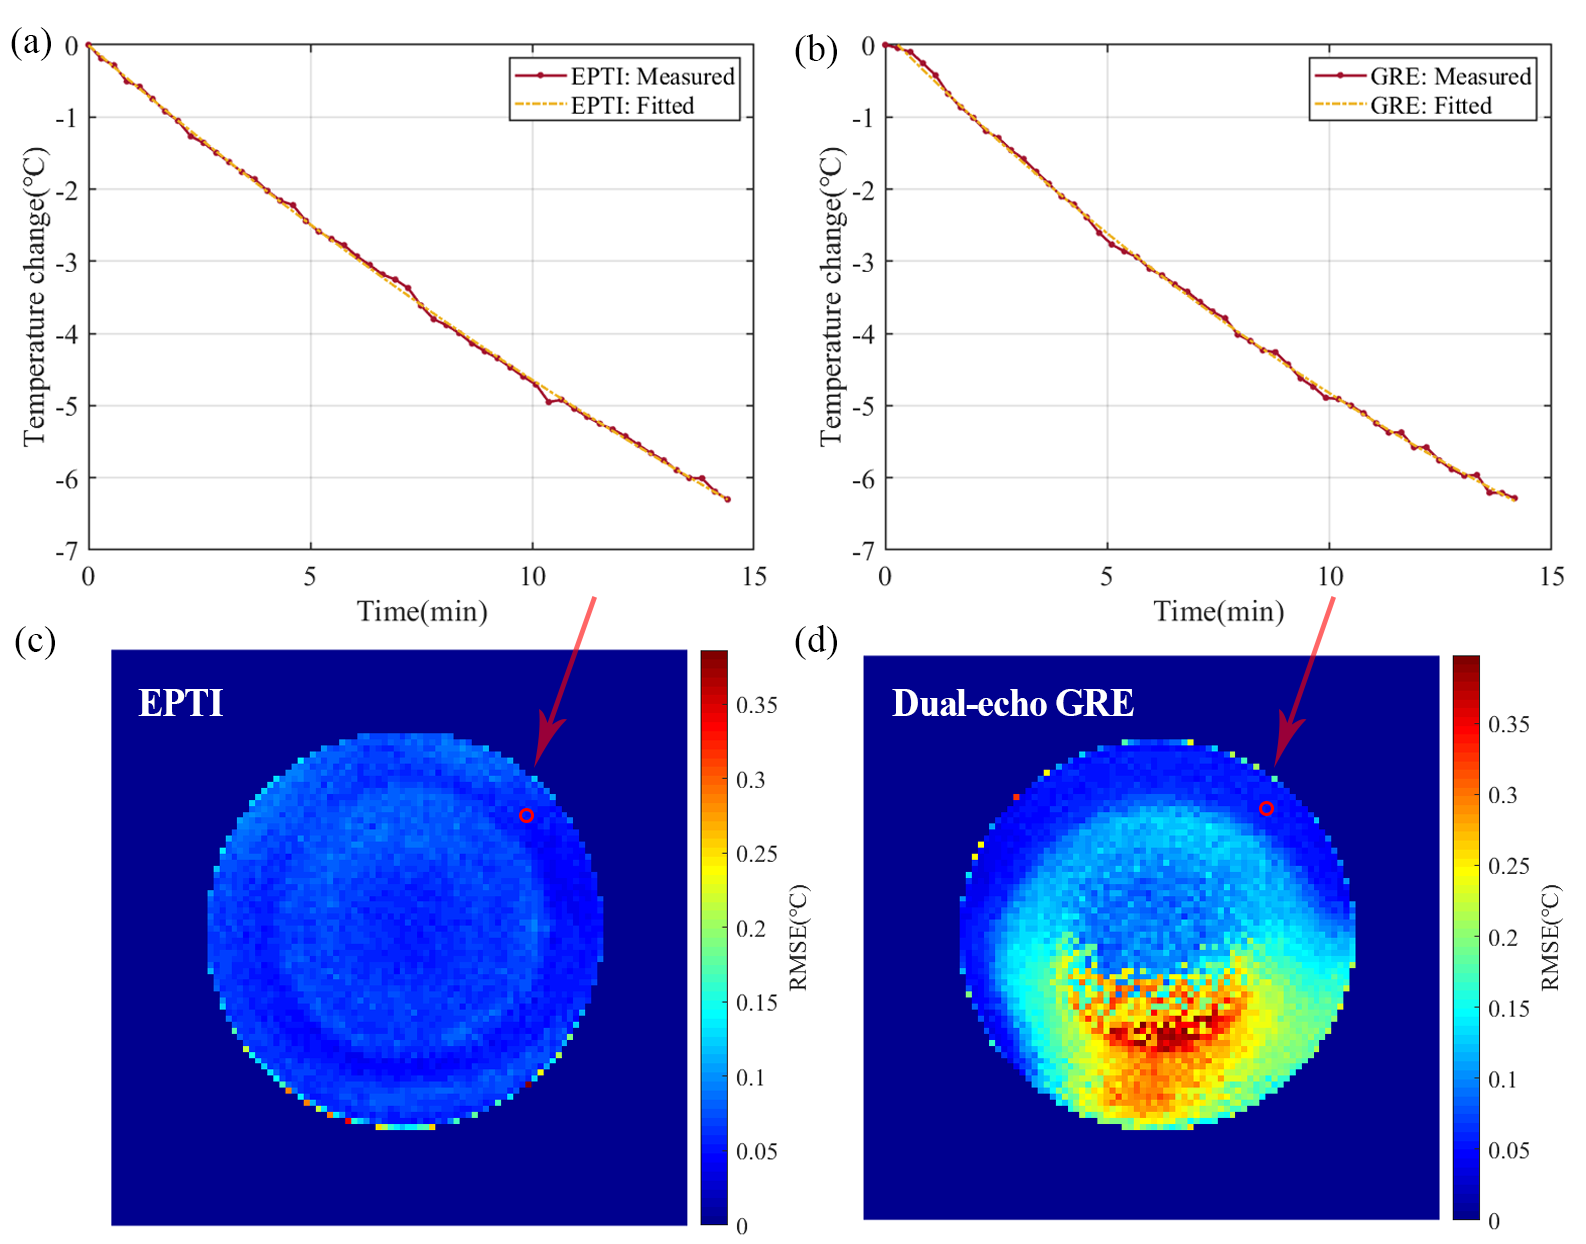
Figure 3 compares the performance of the EPTI sequence with dual-echo GRE sequence. In order to make fair comparisons, the EPTI measurements were subsampled to correspond with the GRE measurements. The averaged value of the RMSE distribution map for EPTI is 0.0250℃, while the dual-echo GRE is 0.0529℃. The EPTI-based MR thermometry performed similarly with GRE-based thermometry on measuring accuracy, but substantially reduced RMSE by utilizing the multi-echo data within shorter acquisition time.
In vivo Experiment
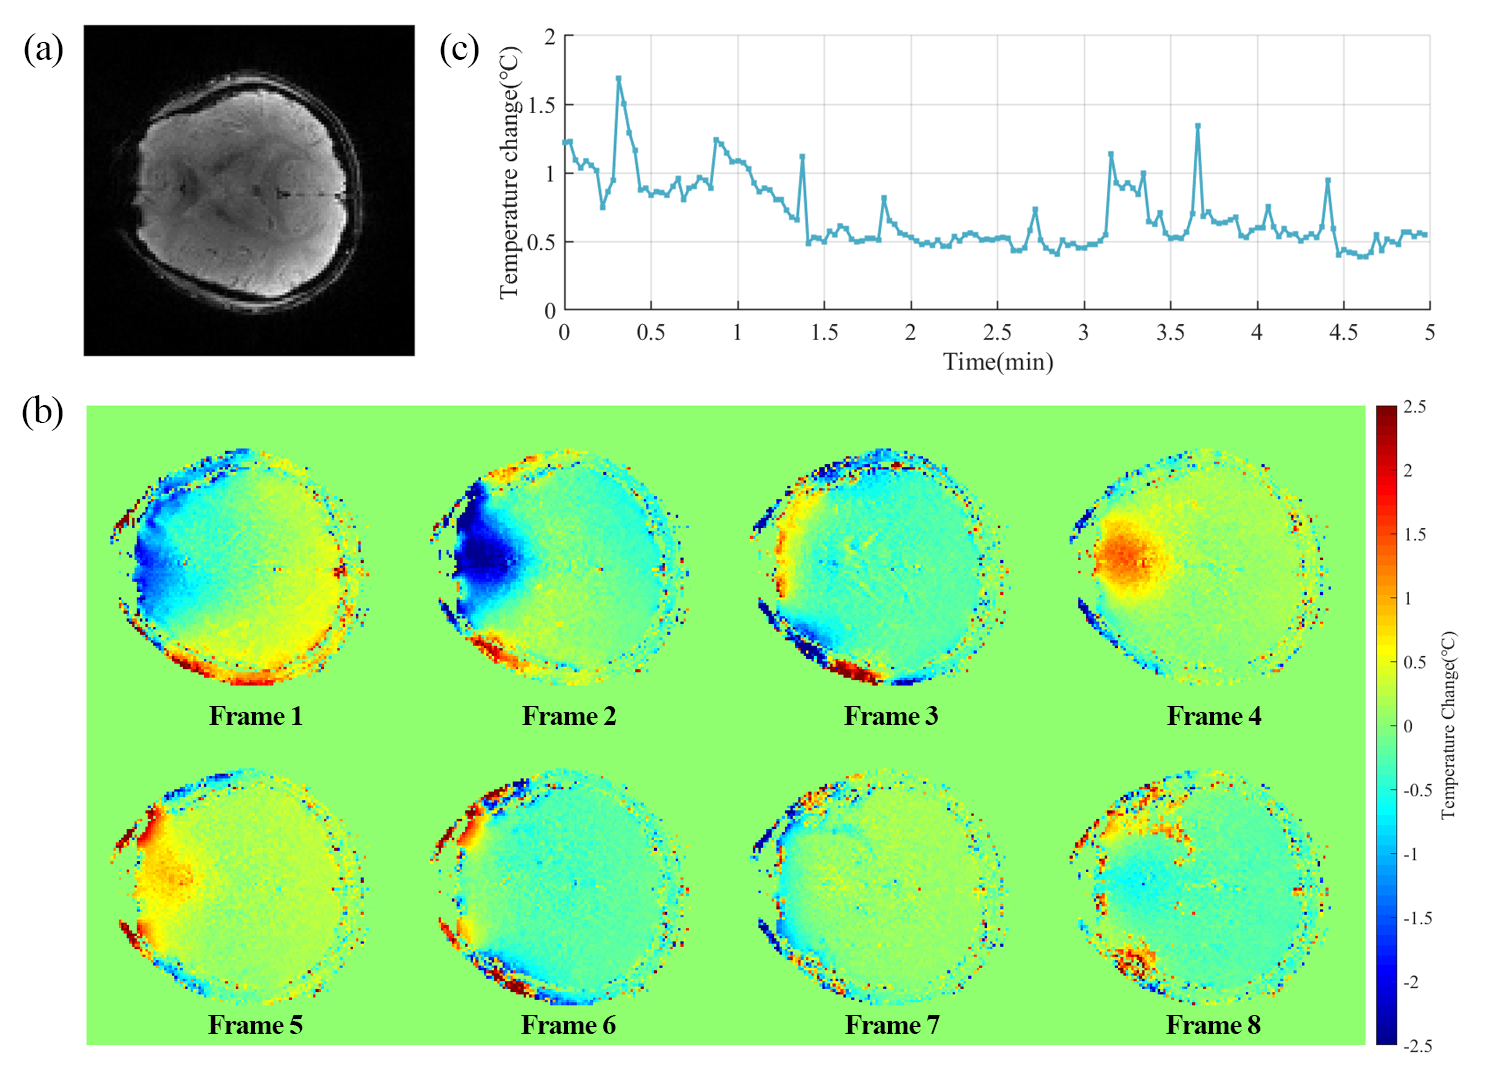
Figure 4 shows the in vivo performances of EPTI thermometry. A second-order polynomial model was introduced to fit the B0 drift effects during the acquisition process. Figure 4(c) shows the standard deviation (STD) of the temperature distribution of the whole brain at different time points. The averaged STD value through whole acquisition time is ~0.69℃, while the mean absolute value error is ~0.48℃ (assuming that brain temperature keeps constant).
Conclusion
This work demonstrates the great potential of the EPTI sequence in MR thermometry due to its higher temporal resolution and multi-echo acquisition. The temporal resolution increases to 2.5s per dynamic as fast as the EPI sequence, while the GRE sequence needs 17s for an image. Moreover, temperature maps are free of distortion and blurring, which frequently occurs in the EPI sequence. Future work will be focused on examining the accuracy of EPTI thermometry with precise temperature measuring tools.Acknowledgements
This work was supported by NSF research grants: 61571257.References
1. Wang, Fuyixue, et al. "Echo planar time‐resolved imaging (EPTI)." Magnetic resonance in medicine 81.6 (2019): 3599-3615.
2. Rieke, Viola, and Kim Butts Pauly. "MR thermometry." Journal of Magnetic Resonance Imaging: An Official Journal of the International Society for Magnetic Resonance in Medicine 27.2 (2008): 376-390.
3. Winterton, R. H. S. "Newton's law of cooling." Contemporary Physics 40.3 (1999): 205-212. Magnetic Resonance in Medicine 27.2 (2008): 376-390.
Figures