4125
Effects of mild hyperthermia and pulsed high intensity focused ultrasound in a mouse models of Pancreatic Ductal Adenocarcinoma1Radiology, University of Washington, Seattle, WA, United States, 2Applied Physics Laboratory, University of Washington, Seattle, WA, United States, 3Division of Gastroenterology, University of Washington, Seattle, WA, United States, 4Medicine, Stanford University, Stanford, CA, United States
Synopsis
Pancreatic cancer is expected to become the second leading cause of the cancer related deaths in the USA by 2020. The ineffectiveness of conventional chemotherapeutics in Pancreatic Ductal Adenocarcinoma (PDA) is thought to be largely due to the extensive stromal desmoplasia which inadvertently increases the interstitial fluid pressure. High intensity focused ultrasound (HIFU) sonication was performed with temperature monitored by MRI. The aim of this study was to develop a target treatment of pulsed HIFU treatment combined with mild hyperthermia on PDA and to monitor the response to the therapy using multi-parametric MRI as a non-invasive biomarker.
Introduction
Pancreatic cancer is expected to become the second leading cause of the cancer-related deaths in the USA by 2020 [1]. The most common and deadly form of pancreatic cancer is pancreatic ductal adenocarcinoma (PDA). The 5-year overall survival rate is less than 8%, with average life expectancy after the diagnosis with metastatic disease being 3-6 months. Although surgery offers the only potential for cure, yet the median survival after resection is still only 13-20 months. The ineffectiveness of conventional chemotherapeutics in PDA is thought to be largely due to the extensive stromal desmoplasia which increases the interstitial fluid pressure [2]. The measurement of any MR parameters in isolation may undermine the dynamic nature of the tumor microenvironment. Multi-parametric magnetic resonance imaging (mp-MRI) enables the evaluation of multiple parameters to give a more representative picture of the tumor microenvironment. We previously demonstrated that mild hyperthermia was very effective in treating PDA in the KPC mice [3] and also recently validated that pulsed HIFU could deplete stroma in PDA [4]. Here, we hypothesize that the combined treatment of pHIFU and mild hyperthermia will provide better treatment outcomes.Materials and methods
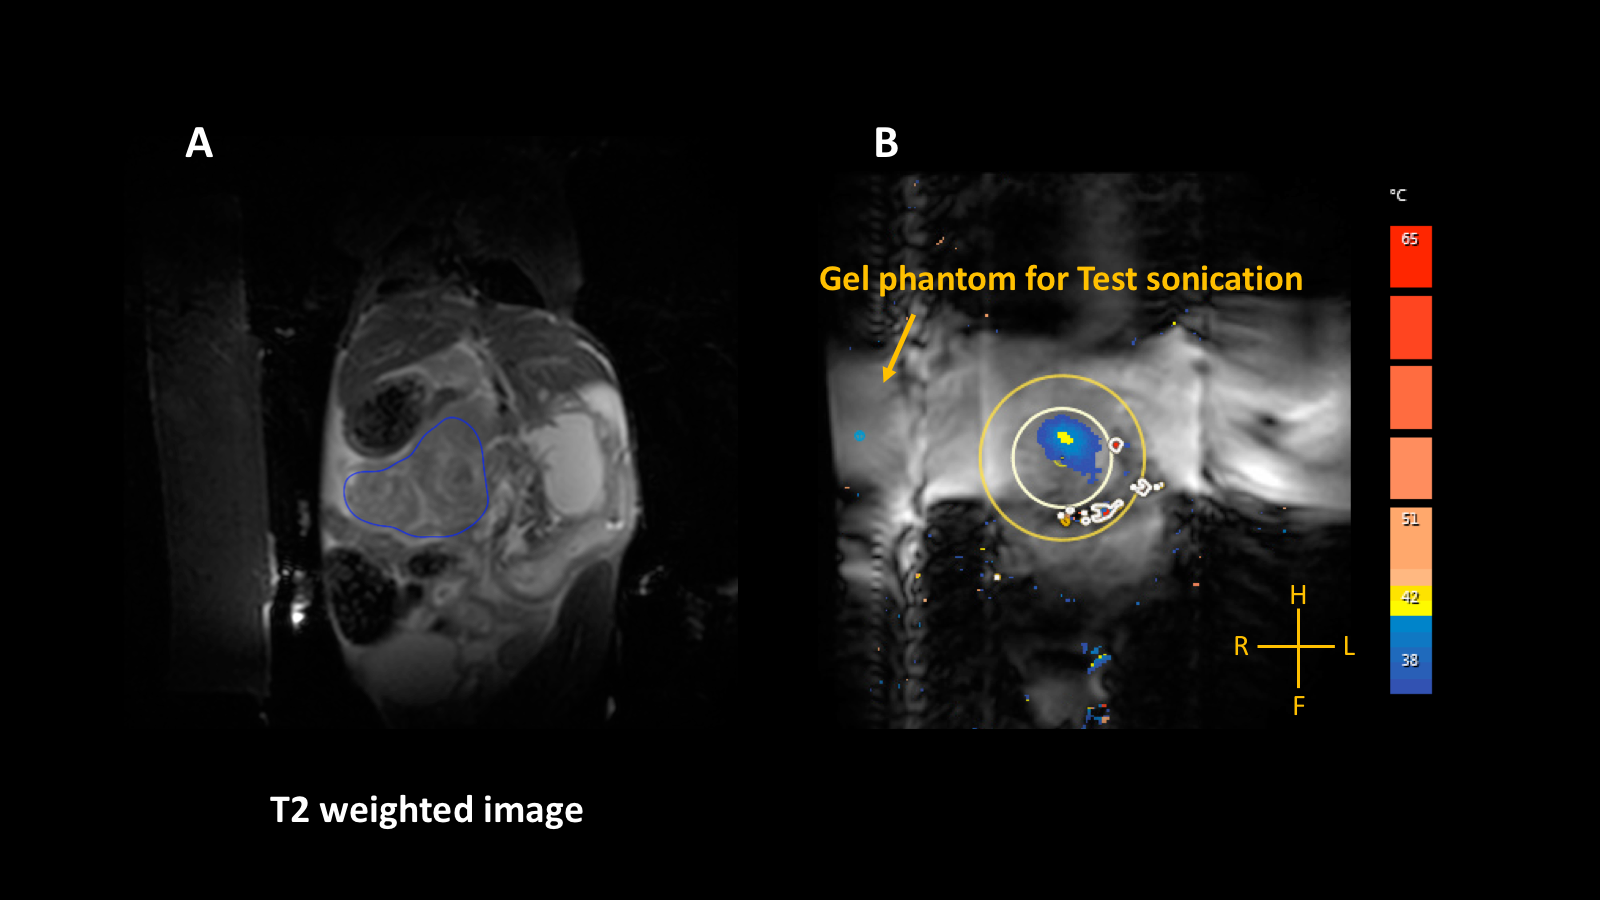
All experimental procedures were approved by the Institutional Animal Care and Use Committee (IACUC) of the University of Washington. An orthotopic (n=9), and genetic murine model, KrasLSL-G12D/+, Trp53LSL-R172H/+, Cre (KPC; n=3) of PDA were employed for this study. Once under anesthesia, a survey scan performed followed by a susceptibility sensitive scan (TR/TE = 4.6/3.0; FA = 7o; FOV = 60 x 60 x 15 mm3; voxel size = 0.94 x 0.94 x 2.0 mm3, slices = 15; acquisition time = 21 sec) to check for the presence of air bubbles in the ultrasound beam path. HIFU treatment was planned on a T2 weighted image (Figure 1A) set acquired with a turbo spin echo [TR/TE: 2690/75 ms; FA: 90o; FOV: 100 x 61x 33 mm3, slices: 20]. T2 weighted images were acquired with the following parameters (TR/TE = 3000/ 20 to 170 ms, with 10 ms spacing, FA = 90o). Magnetization transfer (MT) images were acquired using the following parameters (TR/TE = 73/3.9 ms; FOV: 100 x 59 x 26 mm3). Temperature of the treatment site was monitored via continuous 2D fast field echo planar imaging pulse sequence (TR/TE = 60/9.2 ms; FA = 12o; voxel size = 0.6 x 0.6 x4 mm3, FOV = 70 x 70x 4 mm3). All raw MR images were processed using Horos, an open-source software to measure the mean values of the different tumors. T2 maps: Maps were generated T2 weighted images. MTR maps: The magnetization transfer ratio (MTR) was calculated using the following ratio: (SI0 - SIs/SI0), where SI0 represents the tissue signal intensity without saturation pulse applied while SIs represents the tissue signal intensity with a saturation pulse. Diffusion maps: Diffusion weighted MR signal decay was analyzed using mono-exponential model: Sb/S0 = exp.(−b∙ADC). Where Sb is the MRI signal intensity with diffusion weighting b, S0 is the non-diffusion-weighted signal intensity and ADC is the apparent diffusion coefficient. In addition to mono-exponential model, a bi-exponential model was used to estimate intra voxel incoherent motion (IVIM) related parameters of perfusion fraction (or pseudo-diffusion). An ellipsoid treatment volume was placed in a phantom gel and a low-power test sonication (continuous wave ultrasound, frequency 1.2 MHz, acoustic power = 10W; duration 16 sec) was performed prior to the treatment. The pulsing protocol was used with the following parameters: at each spot: a series of pulses of 25 ms duration were delivered at a pulse repetition frequency of 3 Hz, and acoustic power = 22 W (Figure 1 B).Results and Discussion
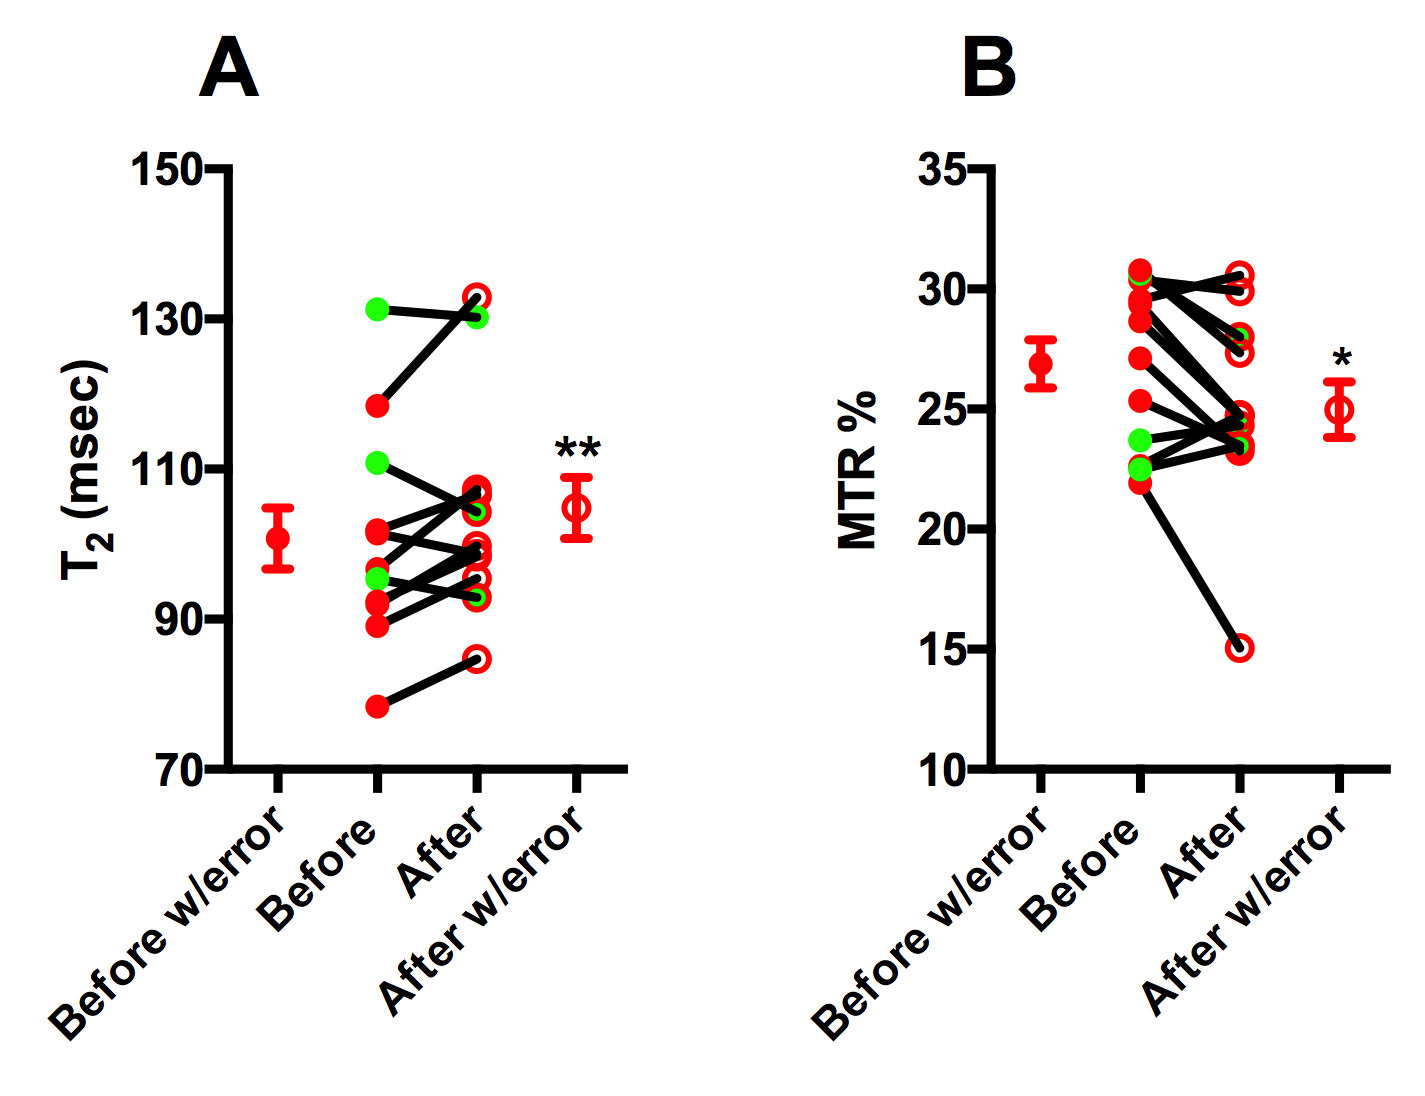
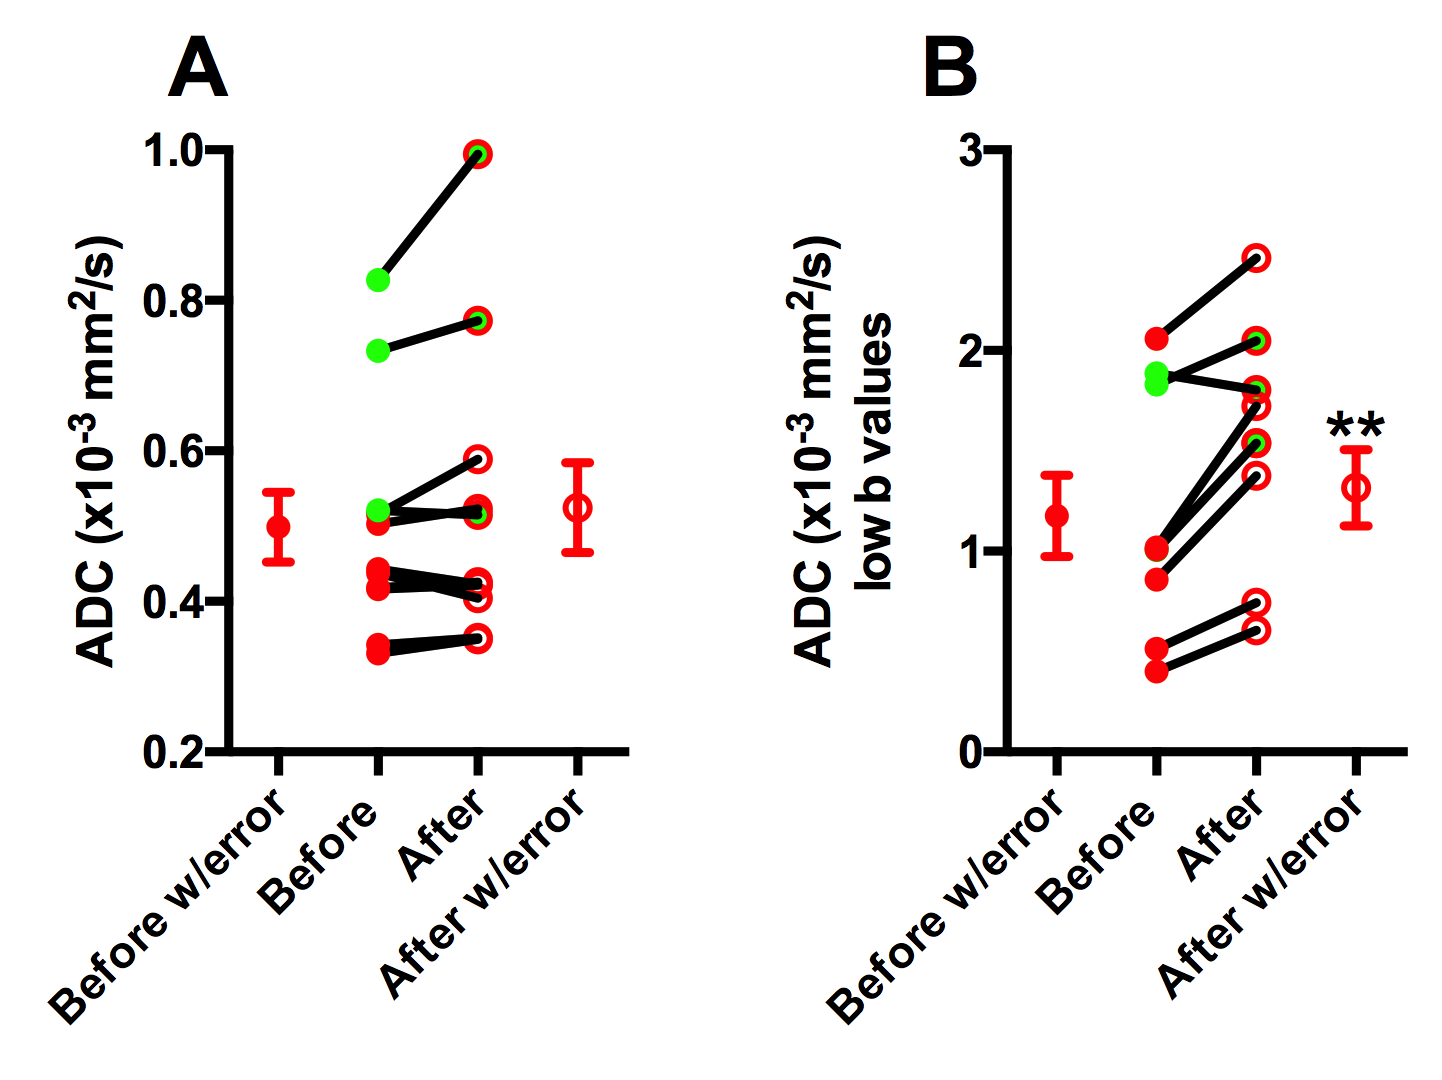
Average T2 values increased (before; 100.8 ± 14.08 ms vs after; 104.8 ± 14.10 ms; Figure 2A) and average MTR decreased significantly after treatment (before; 26.88 ± 3.47 % vs after; 24.97 ± 4.01 %; Figure 2B). Finally, based on intravoxel incoherent motion (IVIM) model, pseudo-diffusion or perfusion component (using low-b value) significant differences were noted after HIFU treatment (before; 1.18 ± 0.61 mm2/s vs after; 1.54 ± 0.59 mm2/s) as shown in Figure 3. ADC is a combined measure of thermally driven molecular movement of water i.e. diffusion and microcirculation of blood in capillaries i.e. perfusion. Pancreatic ductal adenocarcinomas (PDAs) have a robust fibroinflammatory stroma and a dense extracellular matrix that accumulates water molecules in a poorly mobile, gel-fluid phase. These features result in high interstitial fluid pressure (IFP) that collapses tumor vasculature and impedes therapeutic drug delivery. Mild hyperthermia has been shown to increase tumor blood flow [5] and increase tumor vascular permeability [6]. An increase in T2 and a decrease in MTR (%) may suggest partial disruption of tumor stroma that could lead to a decrease in IFP. Furthermore, an increase in ADC (low-b values) suggests improvement in tumor perfusion. These observations and measurements could be further explored and validated with comparisons to histological measurements for a more nuanced understanding of the cellular change.Acknowledgements
This work is supported by NIH R01CA188654 and NIH R01CA154451. We would like to thank Yasser Nazari for his assistance with the experiments.References
1. Siegel, R.L., K.D. Miller, and A. Jemal, Cancer statistics, 2019. CA Cancer J Clin, 2019. 69(1).
2. DuFort, C.C., et al., Interstitial Pressure in Pancreatic Ductal Adenocarcinoma Is Dominated by a Gel-Fluid Phase. Biophys J, 2016. 110(9).
3. Farr, N., et al., Hyperthermia-enhanced targeted drug delivery using magnetic resonance-guided focussed ultrasound: a pre-clinical study in a genetic model of pancreatic cancer. Int J Hyperthermia, 2018. 34(3).
4. Maloney, E., et al., Non-Invasive Monitoring of Stromal Biophysics with Targeted Depletion of Hyaluronan in Pancreatic Ductal Adenocarcinoma. Cancers (Basel), 2019. 11(6).
5. Song, C.W., et al., Implications of increased tumor blood flow and oxygenation caused by mild temperature hyperthermia in tumor treatment. Int J Hyperthermia, 2005. 21(8).
6. Kirui, D.K., et al., Transient mild hyperthermia induces E-selectin mediated localization of mesoporous silicon vectors in solid tumors. PLoS One, 2014. 9(2).
Figures