4123
Brain Volumetric Changes following MR Guided Focused Ultrasound Treatment for Parkinson’s Disease1University of Maryland School of Medicine, Baltimore, MD, United States, 2Diagnostic Radiology and Nuclear Medicine, University of Maryland School of Medicine, Baltimore, MD, United States, 3Neurosurgery, University of Maryland School of Medicine, Baltimore, MD, United States, 4Neurology, University of Maryland School of Medicine, Baltimore, MD, United States
Synopsis
MR Guided Focused Ultrasound (MRgFUS) is a novel technique used to noninvasively lesion the brain for treatment of Parkinson’s Disease (PD). In this study 12 PD patients with asymmetric motor symptoms underwent MRgFUS pallidotomy and cortical thicknesses and subcortical volumes were measured pre and post treatment. Subcortical gray matter volume increases were observed 24 hours post treatment with bilateral decreases in basal ganglia gray matter volume 3-6 months post treatment. Cortical thicknesses decreases were observed in the frontal and temporal cortices of right-sided treated patients 3-6 months post treatment. These regions may play a role in the management of dyskinesias.
Introduction
MR Guided Focused Ultrasound (MRgFUS) is a novel technique used to noninvasively lesion the brain in diseases such as Essential Tremor, Parkinson’s Disease (PD), and Neuropathic Pain1-3. While this technique has been used effectively in early clinical trials, the resulting changes on the human brain anatomy and structure following treatment are poorly understood. Understanding the specific structural changes following MRgFUS treatment are important clinically when assessing treatment options and targeting therapy.Methods
Twelve PD patients with asymmetric motor symptoms and without cognitive impairment underwent unilateral MRgFUS pallidotomy. Imaging and clinical testing was performed before treatment, 24hr post treatment, and up to six months post treatment. Our hypothesis was that MRgFUS induced lesions result in changes to brain anatomy and structure, and therefore may be attributed for the alleviation of symptoms. Cortical thickness and subcortical volume measurements were estimated using the FreeSurfer image analysis suite along with the longitudinal pipeline4,5. Both volumetric changes and cortical thickness changes were assessed at two post treatment time points compared to the pre treatment MRI. Paired t-tests were used to compare the pre and post treatment volumes and cortical thicknesses.Results
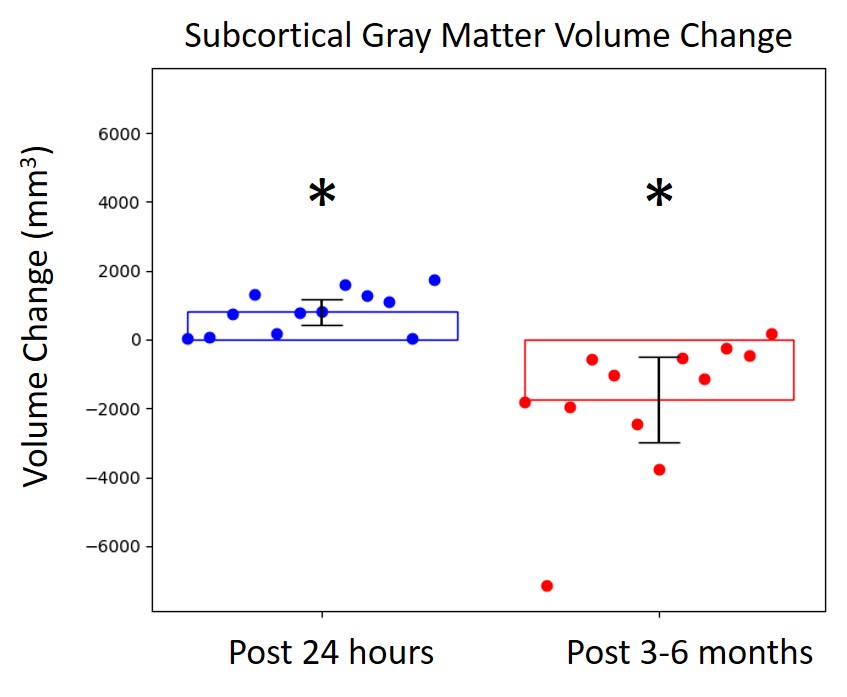
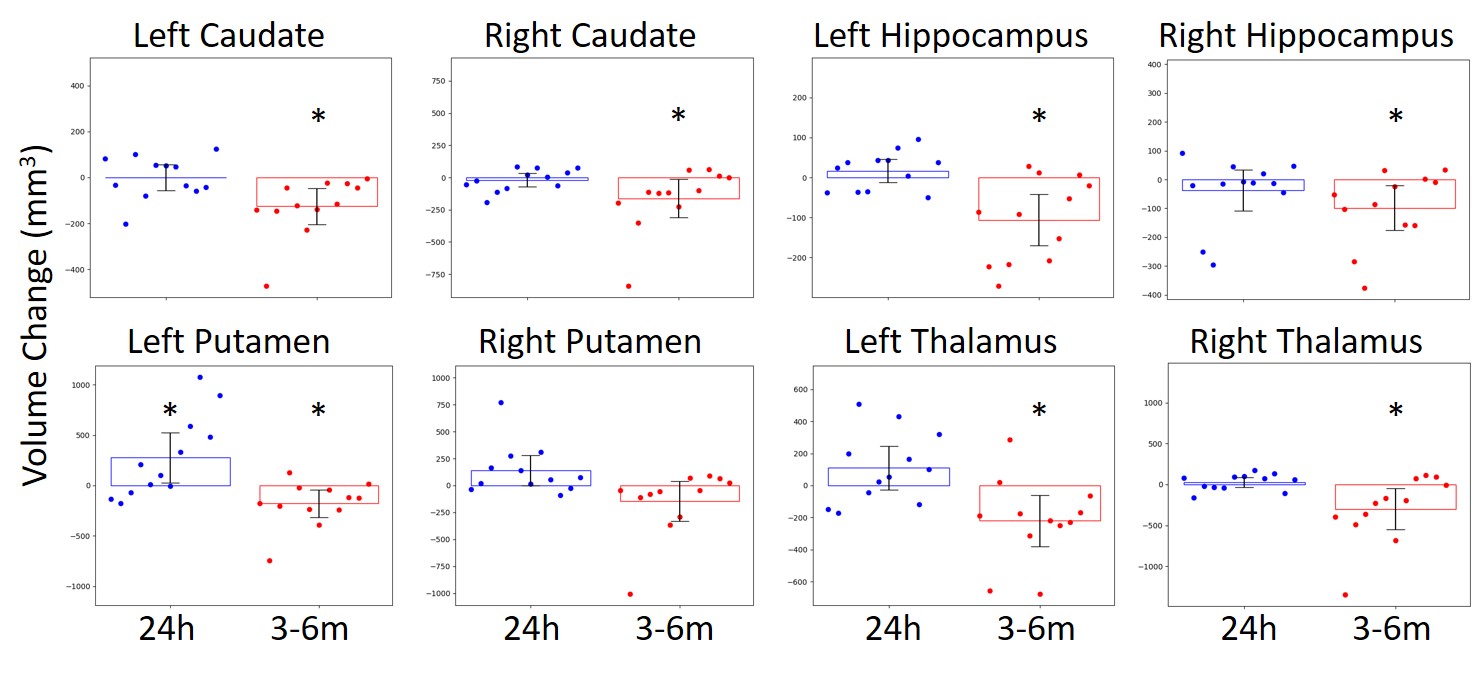
Demographics of the patients used in the MRgFUS study are listed in Table 1. Structural analyses of the subcortical regions revealed increases in overall gray matter volume at 24 hours post treatment followed by decreases in overall gray matter volume 3-6 months post treatment (Figure 1). Bilateral decreases in gray matter volume of the caudate, putamen, hippocampus, and thalamus 3-6 months post treatment were observed (Figure 2). Structural analyses of cortical thickness revealed decreases in contralateral frontal and temporal cortices 3-6 months post treatment in the patient group that received right-side treatment (Figure 3). Cortical changes were restricted to a smaller extent when all patients were included.Discussion
Our preliminary results suggest MRgFUS treatment affects cortical and subcortical gray matter structures. The overall subcortical gray matter volume increases 24 hours post treatment may be attributed to edema following ablation. However, this trend was not observed in each individual region examined. The subcortical volume decreases and cortical thickness decreases at 3-6 months post treatment may be explained by nervous system atrophy that has developed following treatment. The affected cortical regions involve the primary motor cortex, executive function, and default-mode network, while the affected subcortical regions involve the basal ganglia circuitry. All of these regions may play a role in the management of dyskinesias. The volume decreases may be related to atrophy via damaged fiber tracts or other remodeling processes that may be triggered by the ablation.Conclusion
MRgFUS treatment has been shown to be effective in treating a variety of neurological diseases, and research of the associated bioeffects from MRgFUS has broad implications for use in clinical medicine. Results on this small sample patients indicate changes in gray matter volumes following ablation. This needs to be substantiated in a larger population. Future work should also examine changes in white matter tract integrity as well functional connectivity to correlate clinically with the changes observed in these patients.Acknowledgements
The authors acknowledge, with appreciation, the University of Maryland School of Medicine Center for Innovative Biomedical Resources (CIBR) and the Center for Translational Research in Imaging at Maryland (CTRIM).References
1. Elias WJ, Huss D, Voss T et al. A pilot study of focused ultrasound thalamotomy for essential tremor. N Engl J Med 2013;369:640-648.
2. Jeanmonod D, Werner B, Morel A, Michels L, Zadicario E, Schiff G, Martin E. Transcranial magnetic resonance imaging-guided focused ultrasound: noninvasive central lateral thalamotomy for chronic neuropathic pain. Neurosurg Focus 2012;32:E1.
3. Monteith S, Sheehan J, Medel R, Wintermark M, Eames M, Snell J, Kassell NF, Elias WJ. Potential intracranial applications of magnetic resonance-guided focused ultrasound surgery. J Neurosurg 2013;118:215-221.
4. FreeSurfer 2013. FreeSurfer Software Suite. http://surfer.nmr.mgh.harvard.edu/
5. Reuter, M., Schmansky, N.J., Rosas, H.D., Fischl, B. 2012. Within-Subject Template Estimation for Unbiased Longitudinal Image Analysis. Neuroimage 61 (4), 1402-1418
Figures