4118
Evaluate thrombolysis effect of focused ultrasound in different thrombus ages by MRI
Yu-Ting Jiang1, Po-Hung Hsu2, Hao-Li Liu3, Chih-Kuang Yeh1, and Hsu-Hsia Peng1
1Department of Biomedical Engineering and Environmental Sciences, National Tsing Hua University, Hsinchu, Taiwan, 2Center for Advanced Molecular Imaging and Translation, Chang Gung Memorial Hospital, Taoyuan, Taiwan, 3Department of Electrical Engineering, Chang-gung University, Taoyuan, Taiwan
1Department of Biomedical Engineering and Environmental Sciences, National Tsing Hua University, Hsinchu, Taiwan, 2Center for Advanced Molecular Imaging and Translation, Chang Gung Memorial Hospital, Taoyuan, Taiwan, 3Department of Electrical Engineering, Chang-gung University, Taoyuan, Taiwan
Synopsis
We aimed to evaluate the thrombolysis effect with variant focused ultrasound (FUS) and microbubbles (MB) conditions in different thrombus ages by MRI. Compared to one-week thrombi, 2-days thrombi presented longer T1 and similar T2, while the total iron content increased with thrombus ages. However, with identical thrombolysis conditions, there is no significant difference of weight loss between two different thrombi ages groups. In conclusion, to characterize the T1 and T2 relaxation times of thrombi with different ages can be helpful for evaluation of the thrombolysis effect with variant UK and FUS conditions in different thrombi ages.
Introduction
The thrombolysis effect of r-tPA was augmented in combination with microbubbles (MB) presented focused ultrasound (FUS) treatment, whereas the incidence of intracerebral hemorrhage was not increased.1 Urokinase (UK) is the most commonly used drug for the treatment of acute pulmonary embolism.2 Previous study reported that MRI can characterize thrombus by T1 mapping.3 On the other hand, the amount of fibrin was reported to influence the efficacy of thrombolysis therapy.4 Because the effect of pharmacological thrombolysis, mechanical thrombolysis, or a combination of these may depend on the anticoagulation of thrombus with variant ages and characteristics,5,6 it is important to evaluate the maturity of thrombus for predicating the effect of thrombolysis. In this study, we aimed to evaluate the thrombolysis effect with variant FUS conditions in different thrombus ages by MRI.Methods
The blood was mixed with 0.3-mol CaCl2 and 20 U thrombin. The blood samples were kept at 37°C in a water bath for one hour and stored in 4°C for two days and one week to form thrombi with different ages. The experimental setup of static and flowing phantoms were shown in Figure 1. In static phantom experiments, the T1WI, T2WI, T1 and T2 maps were acquired in a 7-Tesla MR scanner (ClinScan, Bruker).MRI images used the gradient recalled echo (GRE) and spin echo (SE) sequence for T1-mapping and T2-mapping images. The T1-mapping and T2-mapping images were acquired with a repetition time (TR) and echo time (TE) of 40 ms/1.5 ms and 2,000 ms/7.4 ms, respectively. In flowing phantom experiments, FUS pulses were transmitted to thrombi with an 1-MHz single-element transducer (RK300, FUS Instruments, pulse repetitive frequency=100 Hz, duty cycle=0.1%, acoustic pressure=1 MPa) for 10 min. in the presence of infusion (1 mL/min) of 0.1% MBs (lipid shell with C3F8, mean diameters=1.25 μm, concentration = (4.36±0.32) ×1010 droplets/mL, Trust Bio-sonics inc). Six different treatment conditions were designed: control group without performed thrombolysis (CON), with 3000 or 6000 IU of UK (UK3000, UK6000), FUS+MB, FUS+MB+UK3000, and FUS+MB+UK6000 groups. The weight loss was calculated by$$[(W0-W1 )/W0]×100 %$$ where w0 and w1 indicated the thrombus weight before and after thrombolysis, respectively.The total iron content of different thrombus ages were measure by a spectrophotometer with color intensity of the formed chromagen at 570 nm. The Kruskal–Wallis one-way analysis of variance (ANOVA) was used to test for significant differences in different treatment groups. P<0.05 was considered as significant.Results
The T1WI and T2WI images of 2-days and one-week thrombi were shown in Figure 2a. The signal ratio between thrombi and phantom of 2-days thrombi were higher than that of one-week in T1WI (Figure 2b) and similar to one-week thrombi in T2WI. In Figure 3, compared to one-week group, the 2-days group presented longer T1 (1107.1 ± 116.4 ms vs. 1331.6 ± 60.7 ms, P<0.05) and similar T2 (91.6 ± 10.2 ms vs. 99.9 ± 12.1 ms). The T1 trended to decrease with thrombi ages while the total iron content increased with thrombus ages. In Figure 4, FUS+MB+UK3000 and FUS+MB+UK6000 groups demonstrated significantly increased weight loss than UK3000 (17.3 ± 4.1 % vs. 12.8 ± 3.3 %, P<0.05) or UK6000 (25.4 ± 5.6 % vs. 17.5 ± 6.4 %, P<0.05). FUS+MB+UK6000 groups demonstrated significantly increased weight loss than FUS+MB+UK3000 (25.4 ± 5.6 % vs. 17.3 ± 4.1 %, P<0.05).With identical thrombolysis conditions, there is no significant difference of weight loss between two different thrombus ages groups.Discussion & Conclusion
In this study, 2-days and one-week thrombi presented different T1 and similar T2 relaxation time in vitro phantom study. The MB-presented FUS transmission can reinforce the effect of UK thrombolysis. The fibrin composition of the thrombus can change over time in an in vivo pig model by histologic analysis.7 “Fresh” thrombi have higher proportion of platelets, while “older” thrombi have rich fibrin. The changes in T1 and T2 relaxation times in rabbit venous thrombi was reported to be dependent on the different oxygenation states of hemoglobin and hemosiderin deposition.6 In this study, the T1 decreased with thrombi ages might be attributed to the increased total iron content with thrombi ages. Because the amount of fibrin can influence the efficacy of thrombolysis therapy, 4 to characterize the thrombus age and composition is important for evaluating the effect of thrombolysis. Although the different T1 relaxation time shown in the two thrombi ages groups, the thrombolysis effects were similar. We speculated that the lack of fresh blood continuously flowing by the in vitro thrombi, the composites of thrombi may not change a lot from platelet-rich thrombi to fibrin-rich thrombi as presented in in vivo pig model.7 On the other hand, all thrombi were stored in 4°C for 2 days or 1 week before in vitro experiments, the low temperature might stop the transformation of thrombi and consequently resulted in similar thrombolysis effects in two different thrombi ages groups. In conclusion, we characterized the T1 and T2 relaxation times as well as the corresponding iron contents of thrombi with different thrombi ages in in vitro experiments. In the future, this information can be helpful for evaluation of the thrombolysis effect with variant UK and FUS conditions in different thrombi ages.Acknowledgements
Center for Advanced Molecular Imaging and Translation, Chang Gung Memorial Hospital, Taoyuan, TaiwanReferences
- LU, Yongkang, et al. Microbubble-mediated sonothrombolysis improves outcome after thrombotic microembolism-induced acute ischemic stroke. Stroke. 2016; 47(5): 1344-1353.
- SHI, Ying, et al. Urokinase Attenuates Pulmonary Thromboembolism in an Animal Model by Inhibition of Inflammatory Response. Journal of immunology research. 2018.
- SAHA, Prakash, et al. Magnetic resonance T1 relaxation time of venous thrombus is determined by iron processing and predicts susceptibility to lysis. Circulation.2013; 128 (7): 729-736.
- SILVAIN, Johanne, et al. Composition of coronary thrombus in acute myocardial infarction. Journal of the American College of Cardiology. 2011; 57(12): 1359-1367.
- CZAPLICKI, Christopher, et al. Can thrombus age guide thrombolytic therapy? Cardiovascular diagnosis and therapy. 2017, 7.Suppl 3: S186.
- KUROIWA, Yasuyoshi, et al. MR signal change in venous thrombus relates organizing process and thrombolytic response in rabbit. Magnetic resonance imaging. 2011; 29(7): 975-984.
- CORTI, Roberto, et al. In vivo noninvasive detection and age definition of arterial thrombus by MRI. Journal of the American College of Cardiology. 2002; 39(8): 1366-1373.
Figures

Figure
1. (a) The experimental setup of static thrombus phantom. The MRI imaging plane
was selected as a sagittal view. (b)
The experimental setup of a phantom with flowing MBs solutions in a 3-mm
diameter hollow chamber.
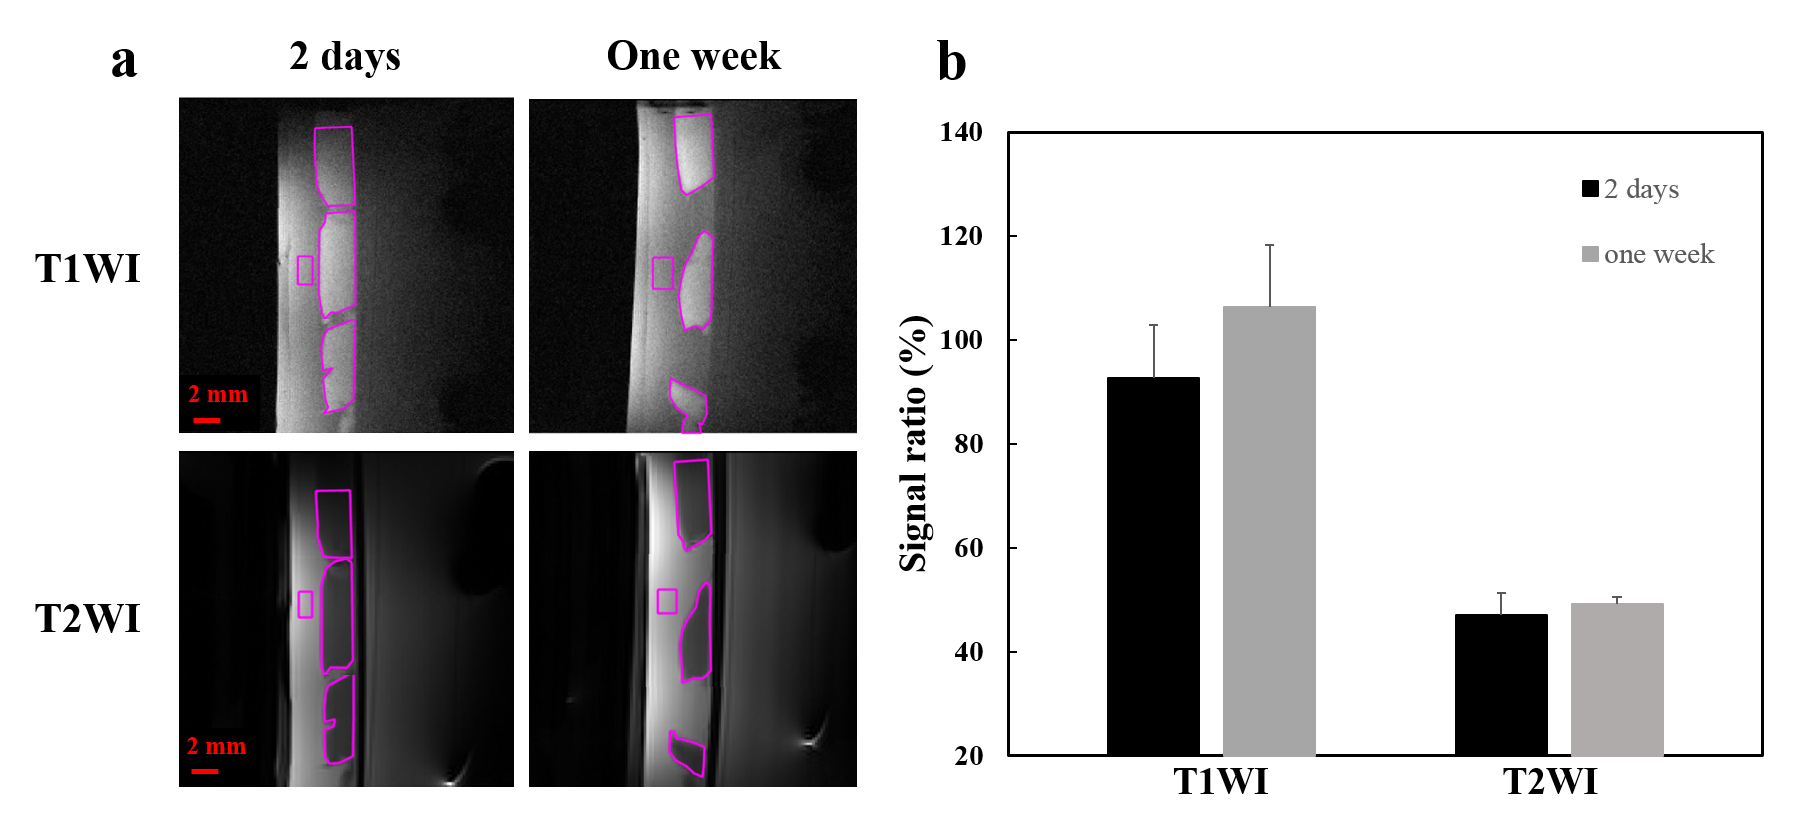
Figure
2. (a) The T1WI and T2WI images of thrombus ages of 2 days (left panel) and one
week (right panel) in static phantom experiments. (b) Calculated the signal
ratio by signal of thrombus divide by signal of saline in T1WI and T2WI.
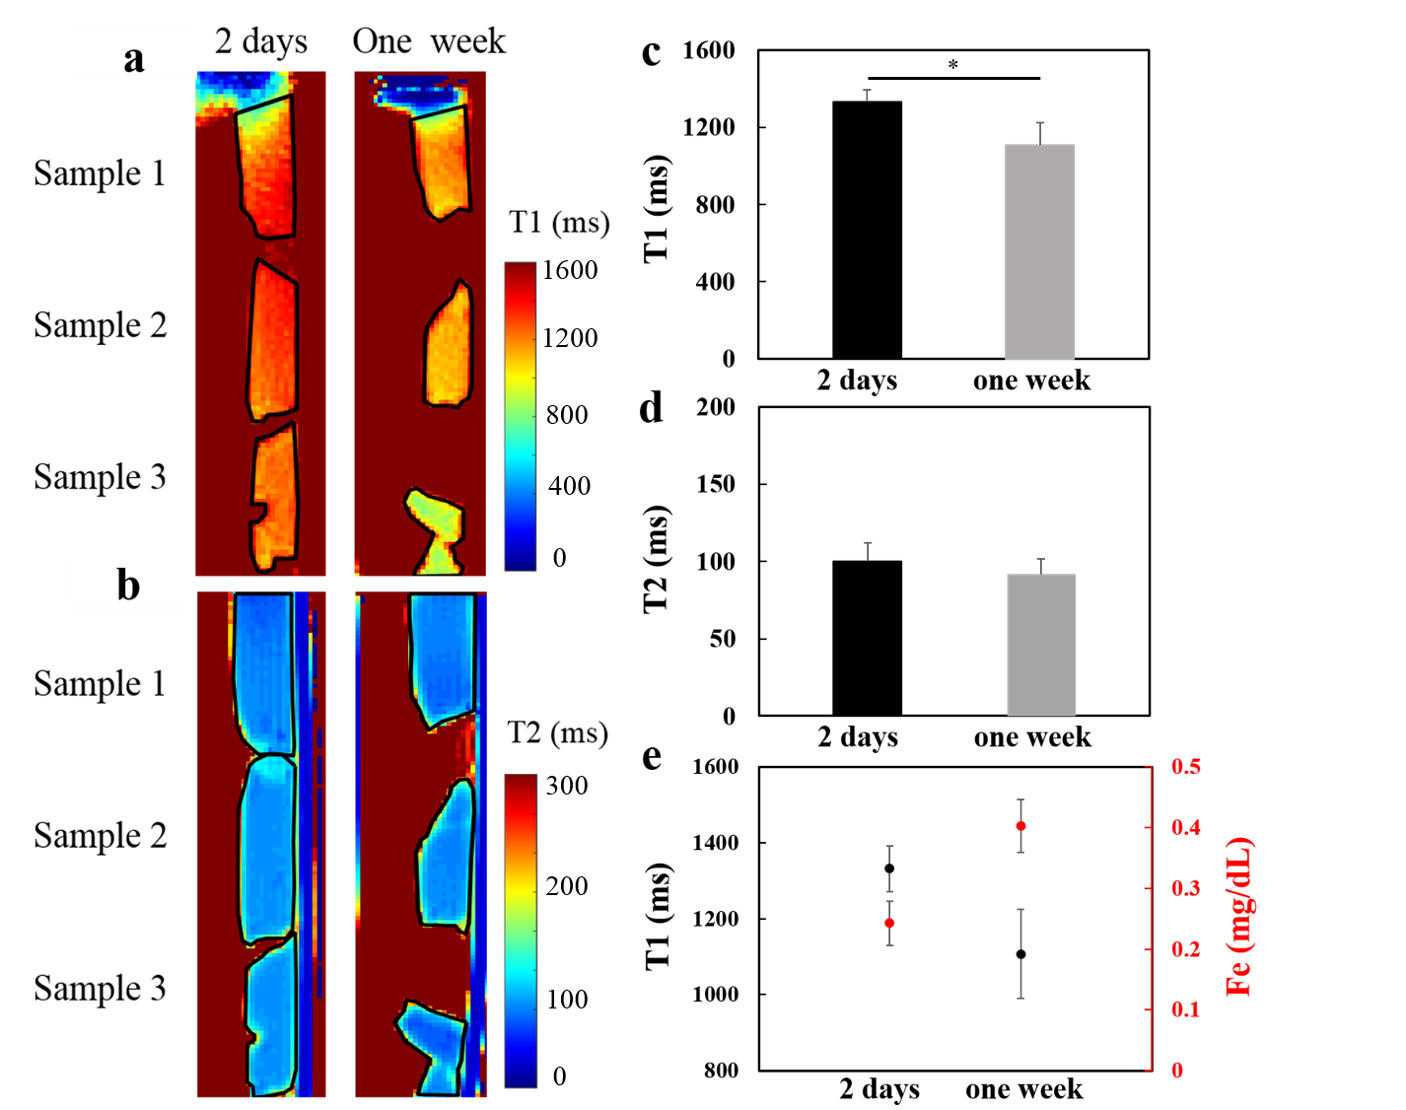
Figure
3. The T1 (a) and T2 (b) maps of of
2- days
(left panel) and one-week
(right
panel) thrombi
in static
phantom experiments. The quantitative T1 (c) and T2 (d) relaxation time of the
selected ROIs (dark lines) in two different thrombi
ages.
(e) The T1 relaxation time trended
to decrease with
ages of thrombi
while
the total iron content increased with thrombi
ages.
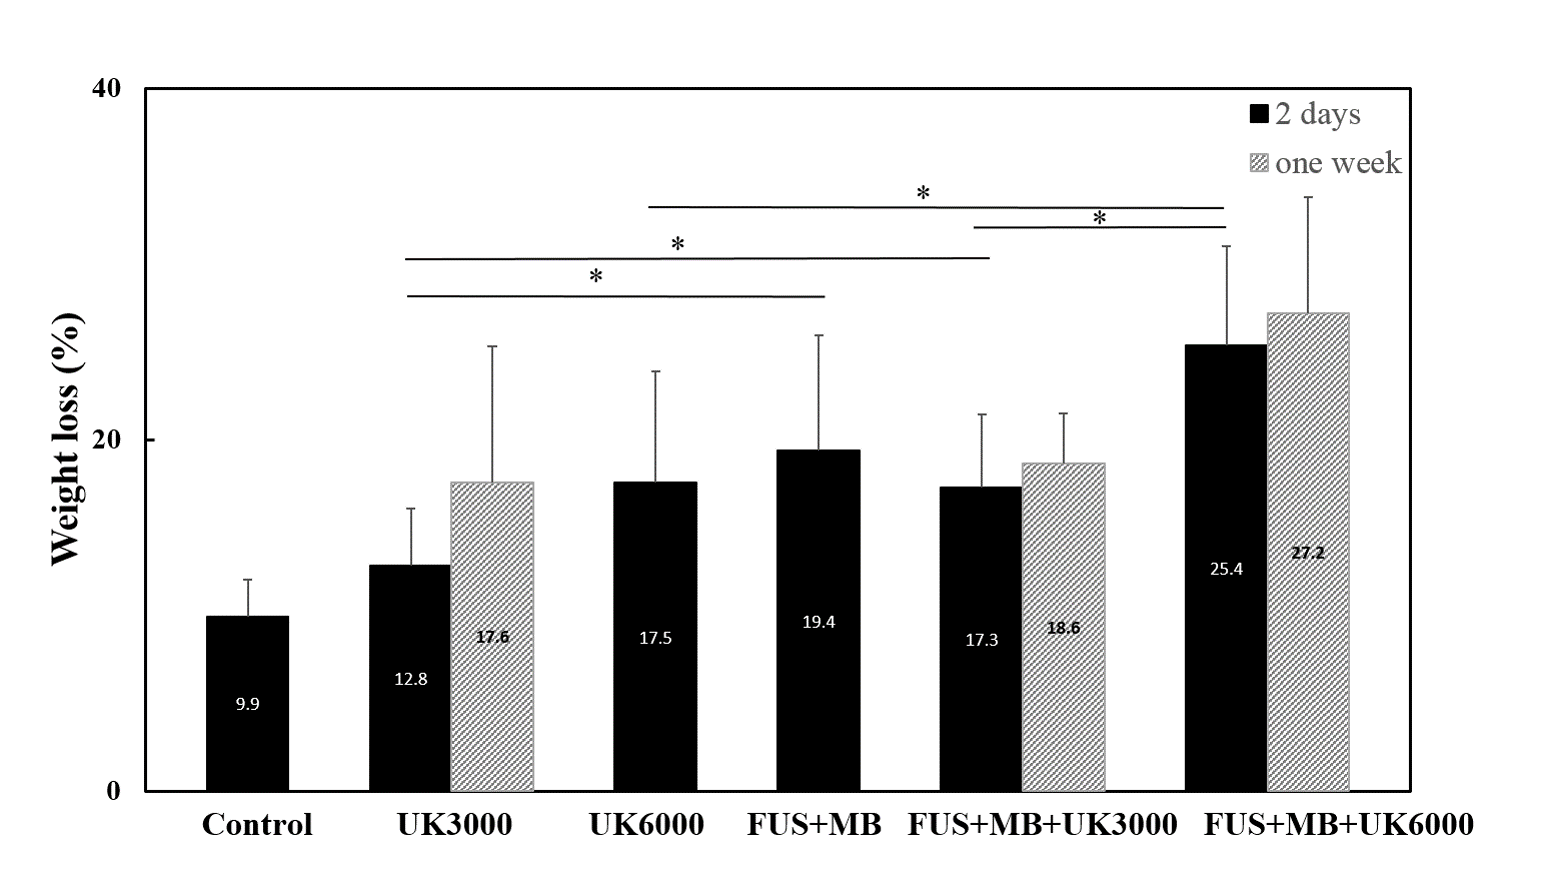
Figure
4.
The
weight
loss
(%) of different
thrombolysis
groups in thrombi ages of 2-days and one-week
in flowing phantom experiments. *P<0.05