4117
Monitoring of Focused Ultrasound Induced Stable Cavitation by Using Magnetic Resonance Imaging: In Vivo Experiments
Yu-Ting Jiang1, Cheng-Tao Ho1, Po-Hung Hsu2, Hao-Li Liu3, Chih-Kuang Yeh1, and Hsu-Hsia Peng1
1Department of Biomedical Engineering and Environmental Sciences, National Tsing Hua University, Hsinchu, Taiwan, 2Center for Advanced Molecular Imaging and Translation, Chang Gung Memorial Hospital, Taoyuan, Taiwan, 3Department of Electrical Engineering, Chang-gung University, Taoyuan, Taiwan
1Department of Biomedical Engineering and Environmental Sciences, National Tsing Hua University, Hsinchu, Taiwan, 2Center for Advanced Molecular Imaging and Translation, Chang Gung Memorial Hospital, Taoyuan, Taiwan, 3Department of Electrical Engineering, Chang-gung University, Taoyuan, Taiwan
Synopsis
We aimed to monitor the focused ultrasound (FUS)-induced stable cavitation (SC) by using single-shot turbo spin-echo based sequence in in vivo experiments. The FUS were transmitted to the cortex ~2‐mm beneath the superior sagittal sinus of rats with acoustic pressure=0.5 or 0.8 MPa. A cavitation index map was computed to highlight the occurrence of SC at focus. In conclusion, the simultaneous acquisitions of spin-echo based images during FUS transmission and the proposed CI map can immediately localize the position occurring SC. The relevant information can be feedbacked to FUS facility for improving the procedure of BBB opening.
Introduction
Gas-filled microbubbles (MBs) can be locally cavitated by focused ultrasound (FUS) to trigger stable cavitation (SC) and inertial cavitation (IC) and provide a reversible blood-brain barrier (BBB) opening.1,2 Because of the potential hemolysis caused by IC, 3 SC is a more preferable scheme to conduct BBB opening. To reduce the damage of non-targeting brain tissue and to improve the drug delivery efficiency, an imaging guidance is crucial to localize the targeting region. Although Gd-contrast agents were used for routine monitoring of BBB opening, it is difficult to be performed in intraoperative guidance of BBB opening.4,5 A half-Fourier acquisition single-shot turbo spin echo (HASTE) sequence was employed to monitor IC-induced signal changes in in vitro experiments.6 A gradient‐echo‐based sequence was proposed to localize the targeted FUS region with IC during FUS transmission in in vitro and in vivo experiments.7 Low temporal and spatial resolution might have diminished the efficacy of HASTE imaging. We provided higher temporal and spatial resolution for monitoring BBB opening. However, SC-induced signal changes of HASTE images have not been studied in in vivo experiments. We aimed to localize and monitor the FUS-induced SC by using HASTE sequence in in vivo experiments.Methods
Twenty-six normal adult male Sprague-Dawley rats (8 control rats, 18 experimental rats) were recruited in this study. In experimental rats, the cavitation effect was induced by transmitting FUS pulses with a MR compatible 1-MHz single-element transducer (RK300, FUS Instruments; pulse repetitive frequency=10 Hz, duty cycle=10) in the presence of 0.2 ml of 0.25% MBs (lipid shell with C3F8, mean diameters=1.25 μm, concentration=(4.36±0.32)×1010 droplets/mL, infusion rate=1 mL/min, Trust Bio-sonics).8 The FUS pulses were transmitted to the cortex ~2‐mm beneath the superior sagittal sinus with acoustic pressure=0.5 and 0.8 MPa (mechanical index=0.5 (SC) and 0.8 (IC)) for 60 s. We performed HASTE sequence in a 7-Tesla MR scanner (ClinScan, Bruker) with parameters of TR/TE=900/22 ms, voxel size=0.23x0.23x0.7 mm3, flip angle=90°, temporal resolution=0.9 s, measurements=378 (340.2s). Figure 1 displays the acquisitions of HASTE images during experimental process. As shown in Figure 2, the pixel-wise slope of signal intensity (SI) changes between t=35~55 s was computed as an SI slope map. A cavitation index (CI) map was composed by multiplying pixel-wise SI slope with a pixel-wise correlation coefficient calculated by a step function and the corresponding temporal SI changes. Four regions-of-interest (ROI) were manually selected on CI map at focus (ROI1), far field of focus (ROI2), ~4 mm off-focal plane (ROI3) and far field of off-focal plane (ROI4) for quantifying normalized SI.7 The Gd enhancement map was computed from T1WI with and without injection of Gd. The Evans blue (100mg/kg) was administered 15 min after the cease of FUS sonication. The leakage of Gd and dye were regarding as BBB opening.Results
In Figure 3, control rats presented no obvious signal changes on HASTE images, CI maps, and Gd enhancement maps and no leakage of Evens blue on the histology. As for experimental rats with transmission of 0.5 MPa FUS pulses, perceptible signals exhibited only in ROI1 on CI maps and Gd enhancement maps. The leakage of Evens blue cortex was also observable. With 0.8 MPa FUS transmission, more substantial signals were shown at focus on CI and Gd enhancement maps. Moreover, the signals could also be observed in ROI2. The large range of the leakage of Evens blue indicated the wide territory of BBB opening. The territory of enhanced signal on CI map was comparable with that on Gd enhancement map. In Figure 4, the time courses of normalized SI at each ROI indicated that the exposure of 0.8 MPa FUS generally induced more significant SI changes than 0.5 MPa in ROI1.Discussion & Conclusions
This study verified the feasibility of simultaneous acquisitions of HASTE images for localizing and monitoring the FUS-induced SC in in vivo experiments. Although the SI changes were not visually distinct on HASTE images, the computed CI map could highlight the occurrence with SC, which is helpful for localizing the sites of BBB opening. The SI changes upon FUS transmission could be attributed to two effects. First, the SC-induced flow disturbance led to intra-voxel dephasing. Second, FUS-induced vasoconstriction 9-11 would lead to the decreased blood volume in brain tissue. Compared to acoustic pressure of 0.5 MPa, these two effects were more violent in 0.8 MPa, consequently leading to more significant SI changes and more distinct leakage of Evens blue at targeting focal region. Moreover, high acoustic pressure pulses induced SI changes in both of focus and far field of focal plane, implying that IC would increase the permeability of BBB at non-targeting regions. The Gd enhancement map is routinely used to verify the sites of BBB opening after the cease of FUS transmission. However, in terms of motion, the subtraction may possibly lead to the deviation of localizing tissue with BBB opening. In conclusion, with the advantage of simultaneous acquisitions of HASTE images during FUS transmission, the proposed CI map can immediately provide the position and relevant information of cavitation effect and can be feedbacked to FUS facility for improving the procedure of BBB opening.Acknowledgements
Center for Advanced Molecular Imaging and Translation, Chang Gung Memorial Hospital, Taoyuan, TaiwanReferences
- Pouliopoulos AN, Bonaccorsi S, Choi JJ. Exploiting flow to control the in vitro spatiotemporal distribution of microbubble-seeded acoustic cavitation activity in ultrasound therapy. Physics in medicine and biology. 2014; 59(22):6941.
- Liu H-L, Fan C-H, Yeh C-K, et al. Combining microbubbles and ultrasound for drug delivery to brain tumors: current progress and overview. Theranostics. 2014; 4(4):432.
- Chen W-S, Brayman AA, Matula TJ, et al. The pulse length-dependence of inertial cavitation dose and hemolysis. Ultrasound in medicine & biology. 2003; 29(5):739-48.
- Hijnen, Nicole M., Aaldert Elevelt, and Holger Grüll. Stability and trapping of magnetic resonance imaging contrast agents during high-intensity focused ultrasound ablation therapy. Investigative radiology. 2013; 48(7): 517-524.
- Gulani V, Calamante F, Shellock FG, et al. Gadolinium deposition in the brain: summary of evidence and recommendations. The Lancet Neurology. 2017; 16(7): 564-570.
- Peng, H. H., Wu, C. H., Kang, S. T, et al. Real‐time monitoring of inertial cavitation effects of microbubbles by using MRI: In vitro experiments. Magnetic resonance in medicine. 2017; 77(1): 102-111.
- Wu, C. H., Liu, H. L., Ho, C. T., et al. Monitoring of acoustic cavitation in microbubble‐presented focused ultrasound exposure using gradient‐echo MRI. Journal of Magnetic Resonance Imaging. 2019.
- Fan C-H, Liu H-L, Ting C-Y, et al. Submicron-bubble-enhanced focused ultrasound for blood–brain barrier disruption and improved CNS drug delivery. PloS one. 2014;9(5):e96327.
- Fan C-H, Lin W-H, Ting C-Y, et al. Contrast-enhanced ultrasound imaging for the detection of focused ultrasound-induced blood-brain barrier opening. Theranostics. 2014;4(10):1014.
- Raymond SB, Skoch J, Hynynen K,et al. Multiphoton imaging of ultrasound/Optison mediated cerebrovascular effects in vivo. Journal of Cerebral Blood Flow & Metabolism. 2007;27(2):393-403.
- Sheikov N, McDannold N, Sharma S, et al. Effect of focused ultrasound applied with an ultrasound contrast agent on the tight junctional integrity of the brain microvascular endothelium. Ultrasound in medicine & biology. 2008;34(7):1093-104.
Figures
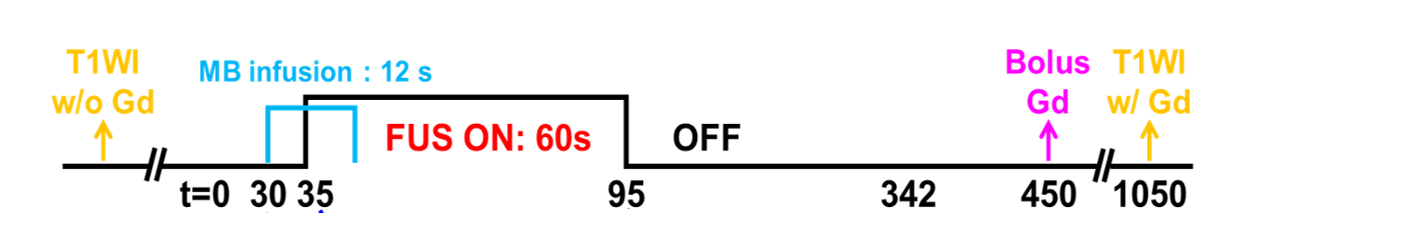
Figure 1. Experimental protocol of in vivo rat experiment. FUS pulses (0.5 or 0.8 MPa, PRF=10
Hz, duty cycle=10% ) was transmitted for 60 s. MB
solution was infused with 1 mL/min infusion rate at t = 30 s. Gd was
injected via tail vein at t = 450
s.
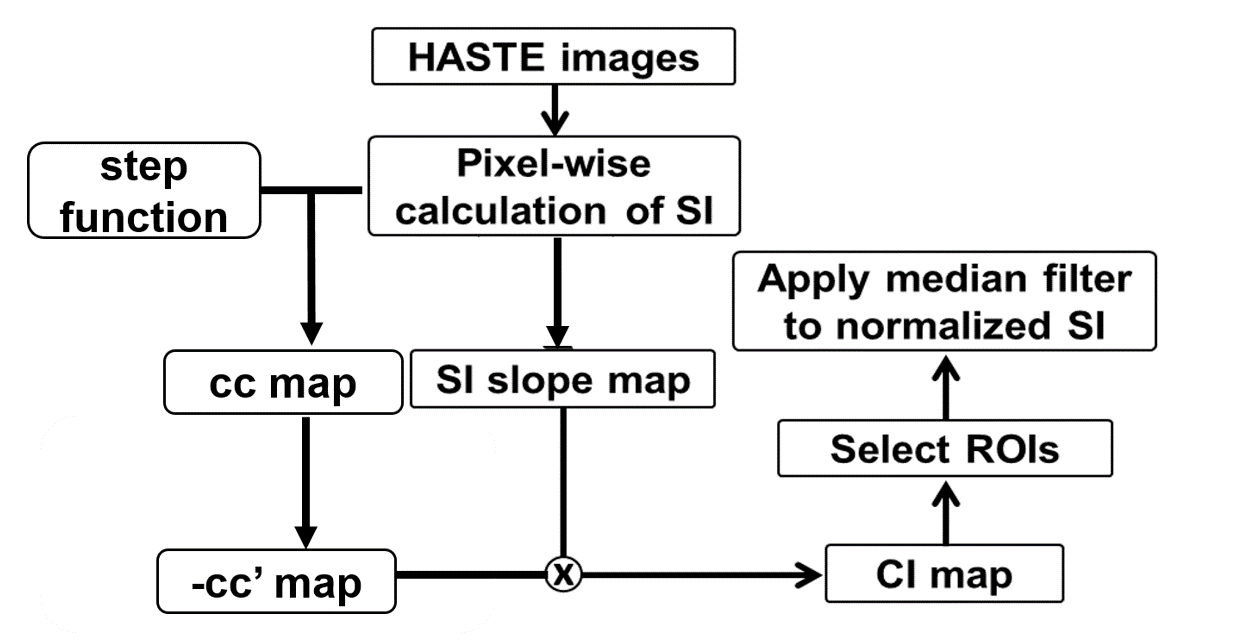
Figure 2. The flow chart of data
analysis process. The
signal intensity (SI) slope map was computed by
pixel-wise slope of SI changes between t = 35~55s. Calculated correlation coefficient (cc)
between a step function and
SI. The positive
cc was
extracted and
reassigned as cc’ map. Then, cc’ map was
multiply by -1 and SI slope map,
i.e. cavitation index (CI) map. Four ROIs
were selected from
CI map to calculate normalized SI with a median filter. Calculated the
logarithm of CI map as log CI map.
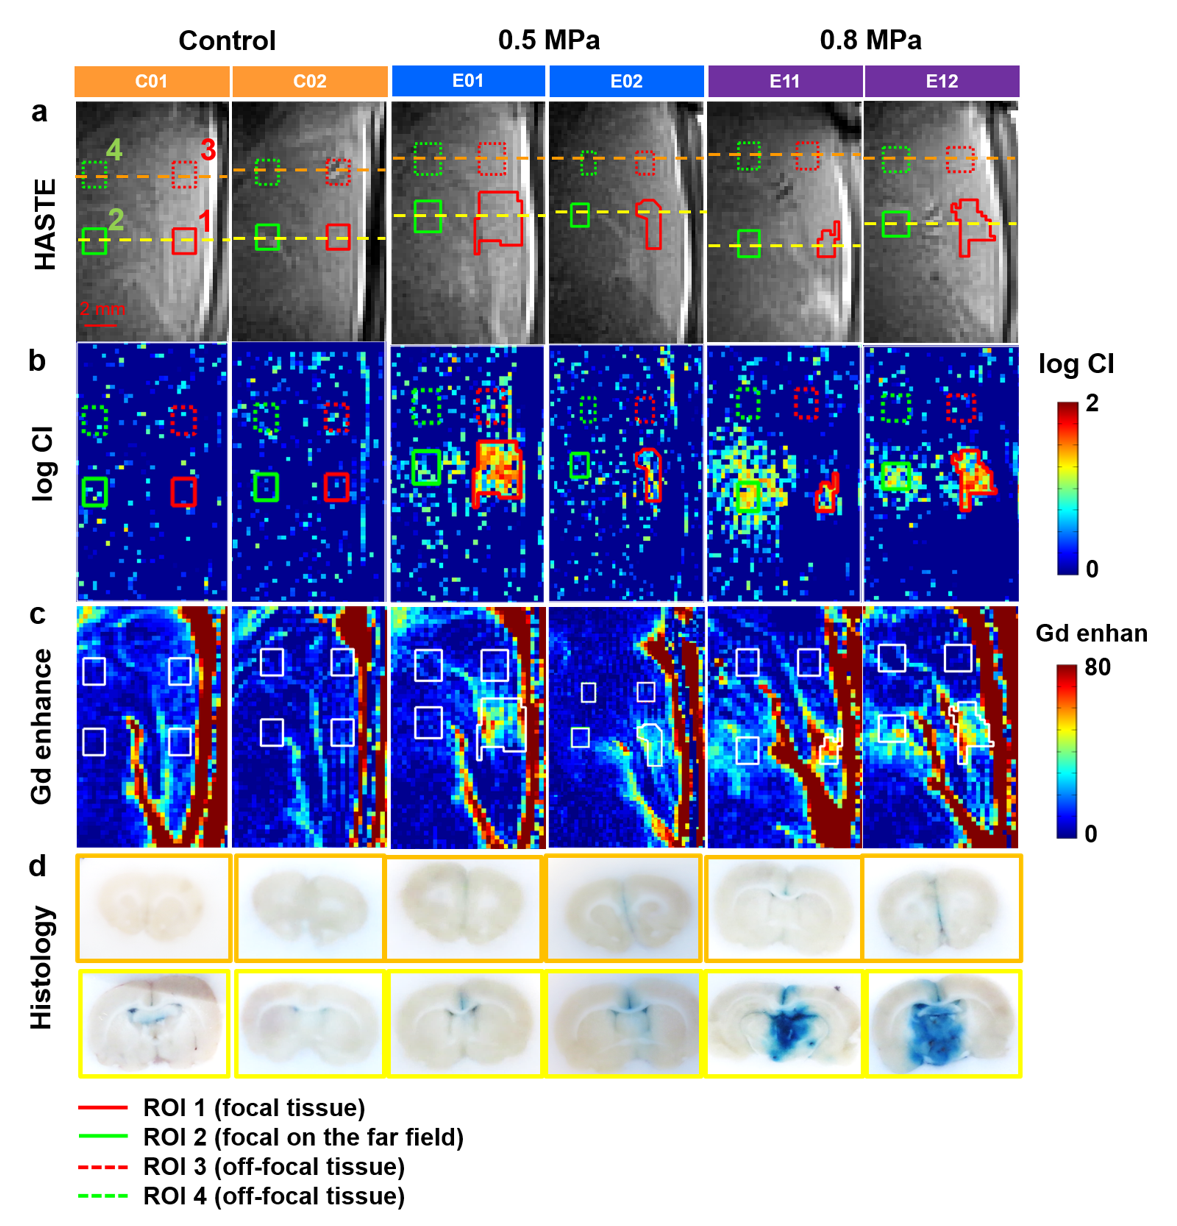
Figure 3. The
HASTE images (a), log(CI) maps (b), and Gd enhancement images (c) of representative
control rats and experimental rats with transmission
of 0.5 or 0.8 MPa FUS pulses. C01: with infusion of 0.25% MB solution only. C02: with infusing normal
saline and applying
0.5 MPa FUS. The histology of brain sections in
focal plane (yellow) and off-focal plane (orange) were shown in (d). The four
ROIs for quantifying SI changes were indicated.
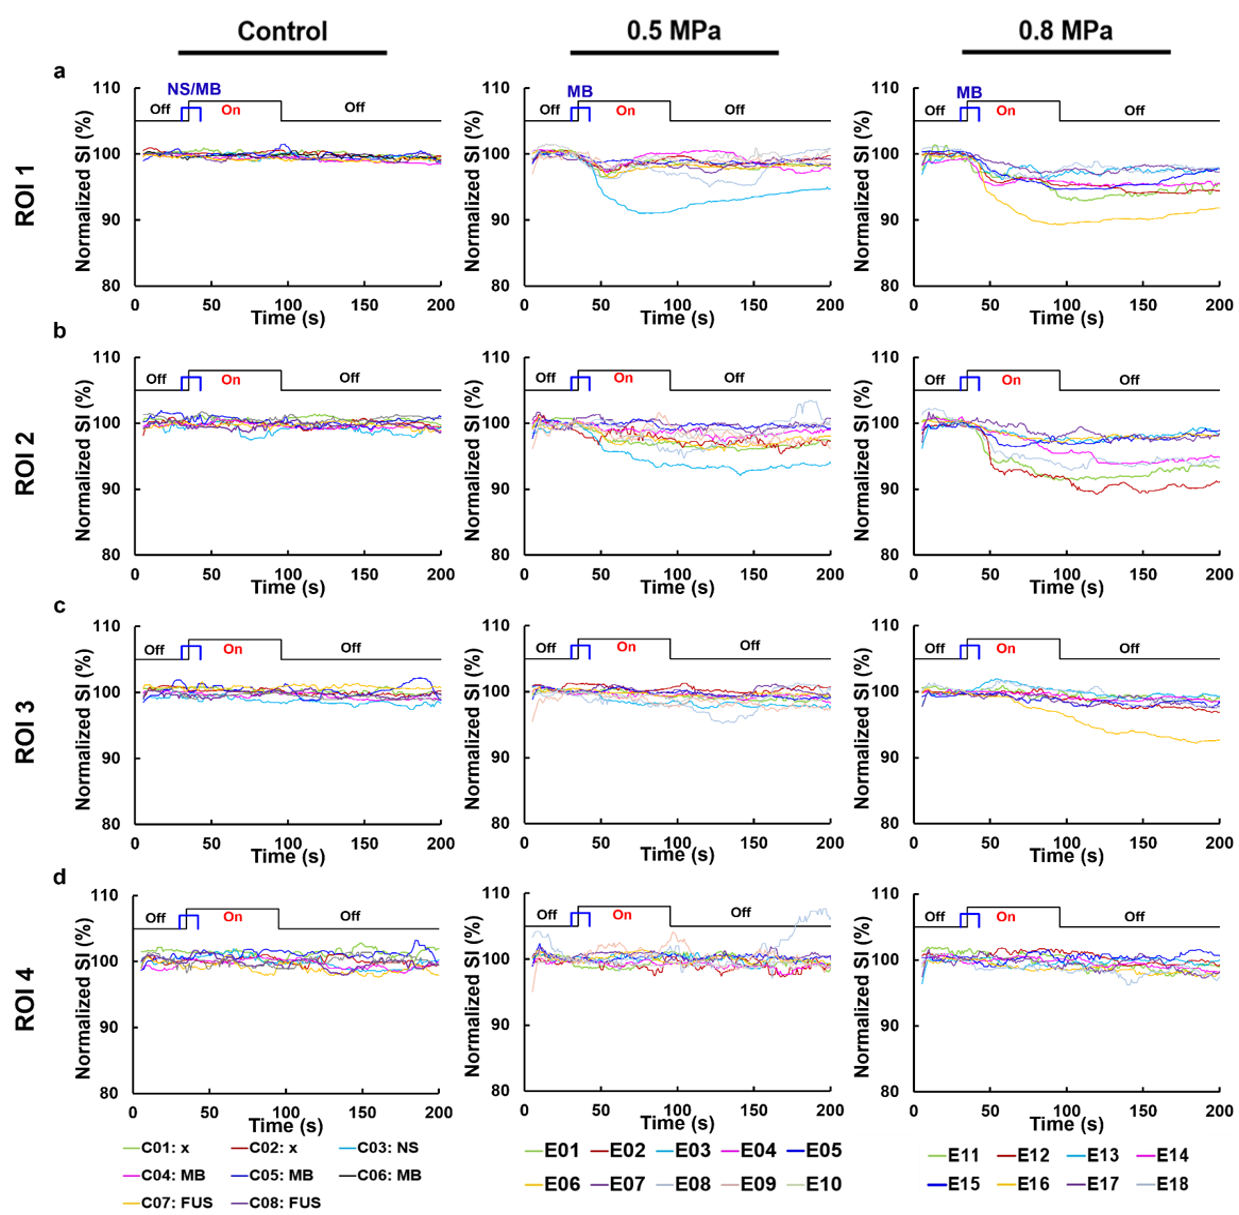
Figure
4. The time courses of normalized SI of four ROIs in vivo control rats and
experimental rats with transmission of 0.5 or 0.8 MPa FUS pulses.