4112
An efficient approach for simultaneous PRF-T1 MR thermometry and shear wave elastography to monitor MR-guided focused ultrasound therapies1Radiology and Imaging Sciences, University of Utah, Salt Lake City, UT, United States
Synopsis
Treatment endpoint assessment in MRgFUS is commonly performed by investigating non-perfused volume or accumulated thermal dose, but these measurements can be inaccurate and have low precision immediately after treatment and can be tissue type dependent. In this work we present a pulse sequence which can provide dynamic measurements of PRF thermometry (and hence also thermal dose), T1 and tissue mechanical properties through shear wave speed measurements. PRF and T1 can provide complete MR thermometry in all tissue types (aqueous and adipose), and together all parameters are useful in treatment endpoint assessment.
Introduction
Magnetic resonance guided focused ultrasound (MRgFUS) is a totally non-invasive thermal treatment modality. MRgFUS treatment endpoint assessment is most commonly performed either by evaluating the non-perfused volume (NPV) after contrast administration or by calculating the accumulated thermal dose (1). NPV has lower precision when performed immediately post treatment than when performed 3-days post treatment. Further, treatment cannot continue after contrast has been administered as contrast can get trapped in the tissue (2–5). The thermal dose resulting in tissue death has been shown to vary greatly with tissue type (6–9). Hence, multi-parametric approaches which takes multiple parameters into account when evaluating tissue damage has gained interest (10–13). However, collecting multiple parameters is often time consuming. In this work we present an MRI pulse sequence which can simultaneously and dynamically measure proton resonance frequency shift MR thermometry (and hence also thermal dose), T1, and tissue shear wave speed (for tissue mechanical properties).Methods
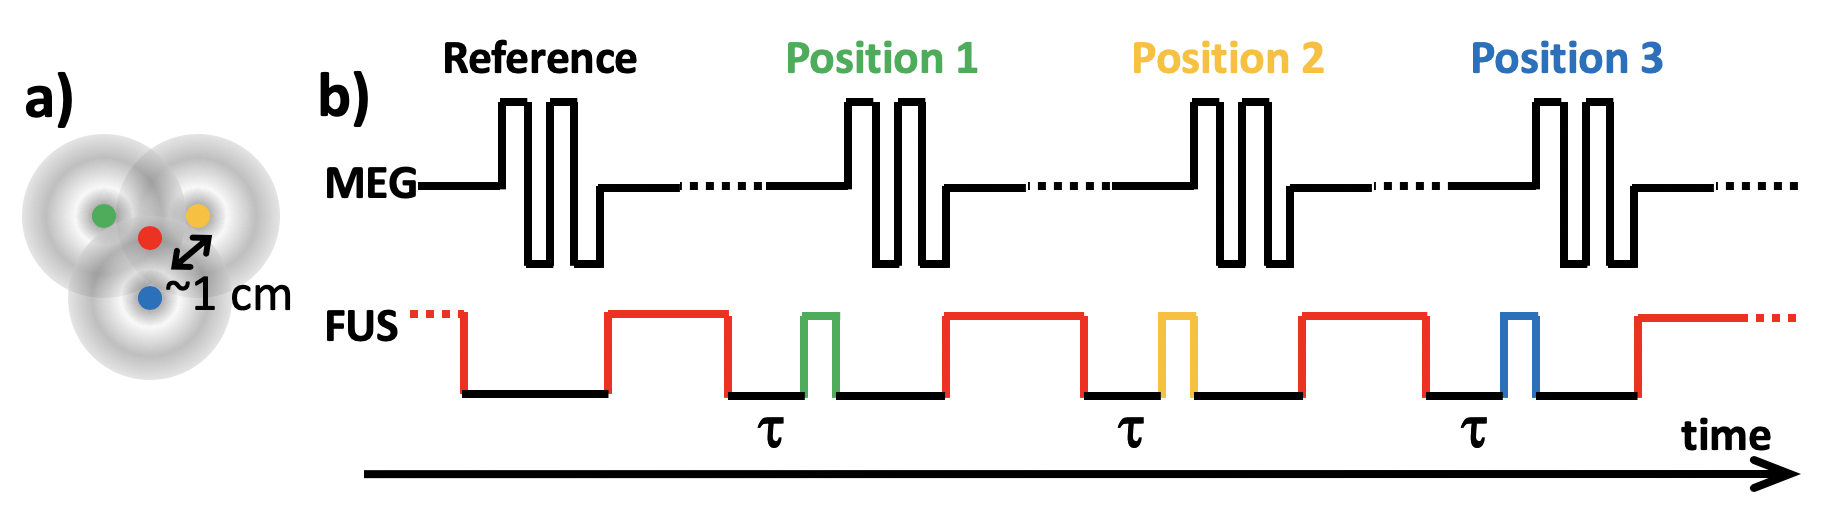
A 3D gradient recalled echo segmented echo planar imaging pulse sequence was modified to include a train of bi-polar motion encoding gradients (4 lobes, 3.4 ms/lobe, 60 mT/m) for MR shear wave elastography (MRSWE) as previously described (14), Figure 1. Optical triggering pulses were used to synchronize the timing of FUS sonications, which are used for both MRSWE displacement encoding and sample heating, with the pulse sequence. MRSWE was applied to 3 (or 5) positions surrounding the geometric focus. Imaging of the MRSWE-positions was interleaved on a TR-basis with a reference image (without motion encoded FUS). The reference image served three purposes; 1) as a reference being subtracted from the MRSWE images to create shear wave speed maps (14), 2) together with an image acquired before the start of the sonications to perform PRF MR thermometry (15), and 3) to dynamically calculate T1 using a recently described single-reference flip angle method (16). To perform MRSWE, MR thermometry, and T1 measurements simultaneous with tissue heating the FUS was applied at the geometric focus when not being used to induce shear waves around the geometric focus, Figure 1. The sonication at geometric focus was turned off for some time τ (= 5.5 ms) before each MRSWE excitation to allow the tissue to relax back to its unperturbed state before the shear wave encoding was performed (17). To dynamically calculate T1 change during heating, a reference image with a low flip angle (5°) was acquired before the start of the sonication, and the dynamic imaging was performed using a higher flip angle close to the Ernst angle (15° in this work).Scan parameters included field of view=128x112x50mm, resolution=1x1x5 mm, TR/TE=43/26 ms, BW=1002 Hz/px, ETL=7, FA=5°/15° (pre-sonication reference/dynamic), 6/8 slice partial Fourier and 80% resolution, acquisition time=4.1 s/3D image and 16.4 s (or 24.6 s) for a full 3 (or 5) point PRF/T1/MRSWE-measurement. The duty cycle for the heating pulses was ~53%.
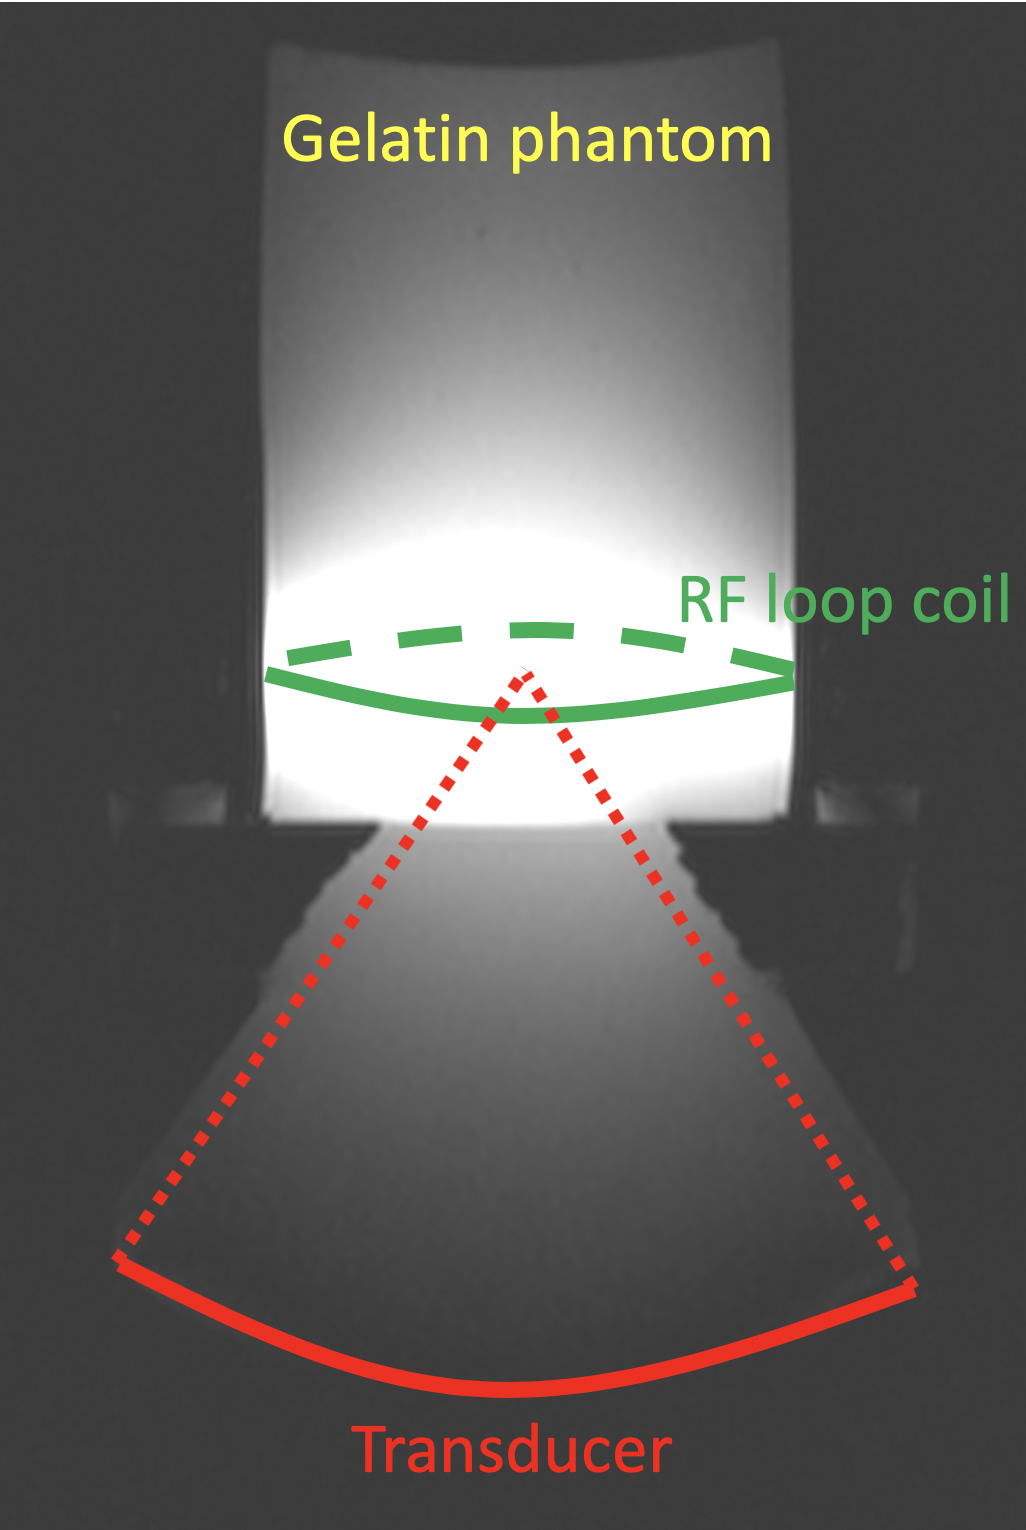
All studies were performed on a 3T scanner (PrismaFit, Siemens, Erlangen, Germany) using a 950-kHz 256-elements focused ultrasound system (Imasonic, Voray-sur-l'Ognon, France and Image Guided Therapy, Pessac, France). Experiments were performed in tissue mimicking gelatin phantoms (18) using an in-house built single channel RF loop coil for signal detection, Figure 2.
Results
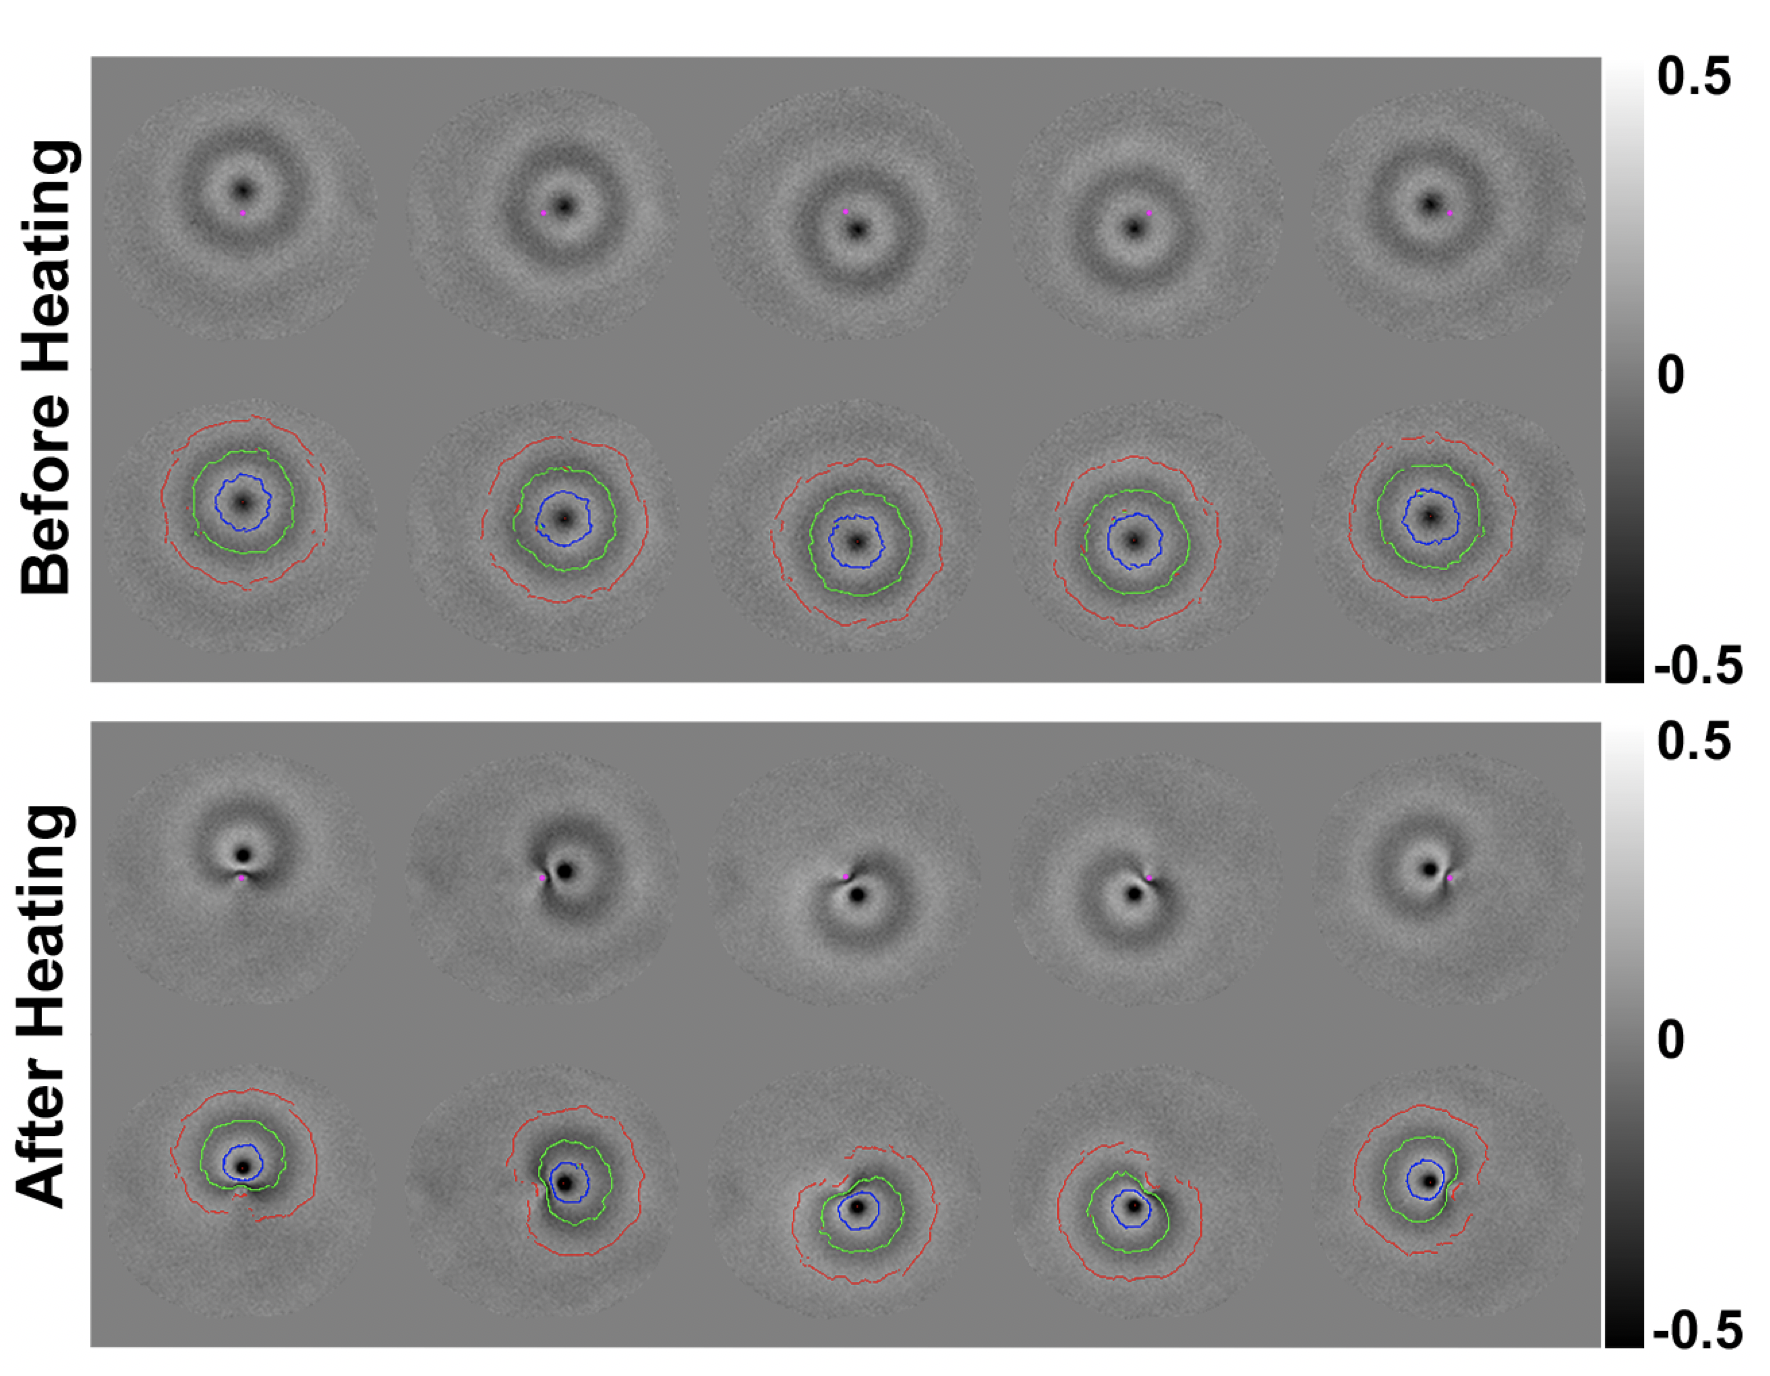
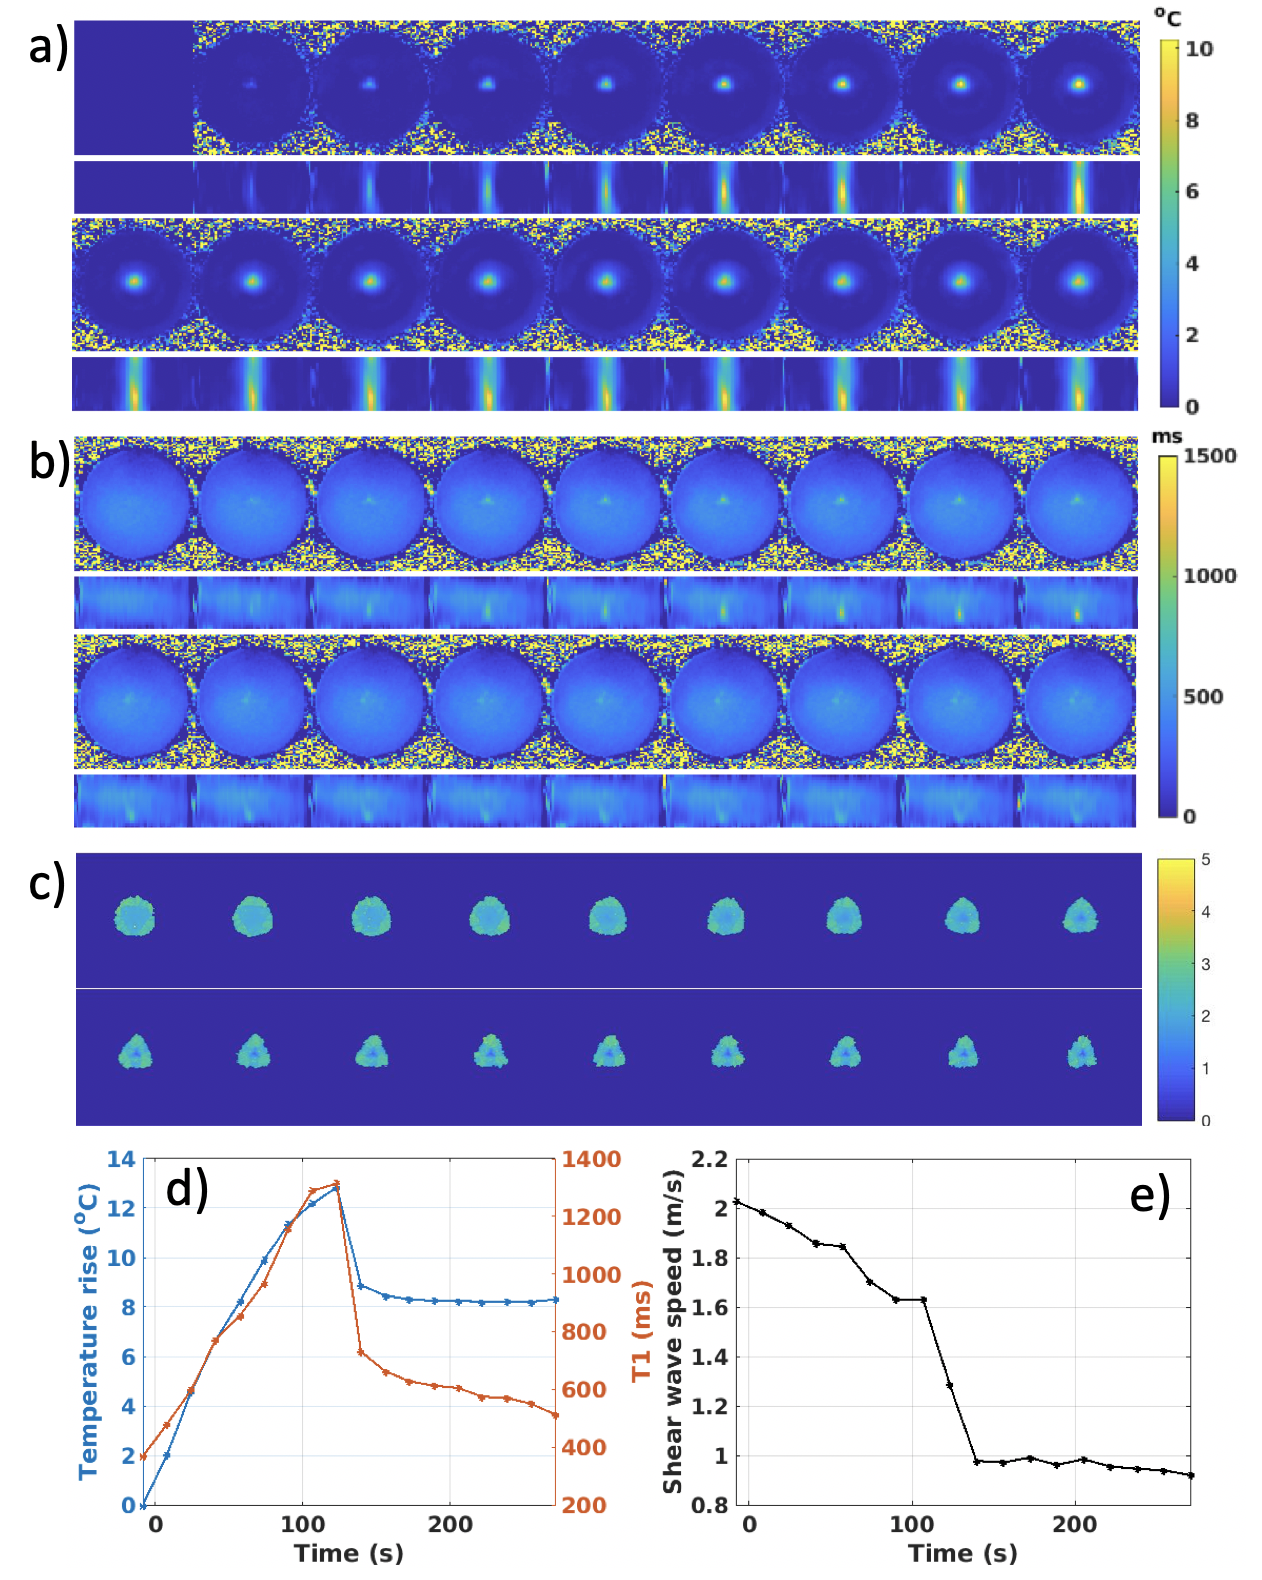
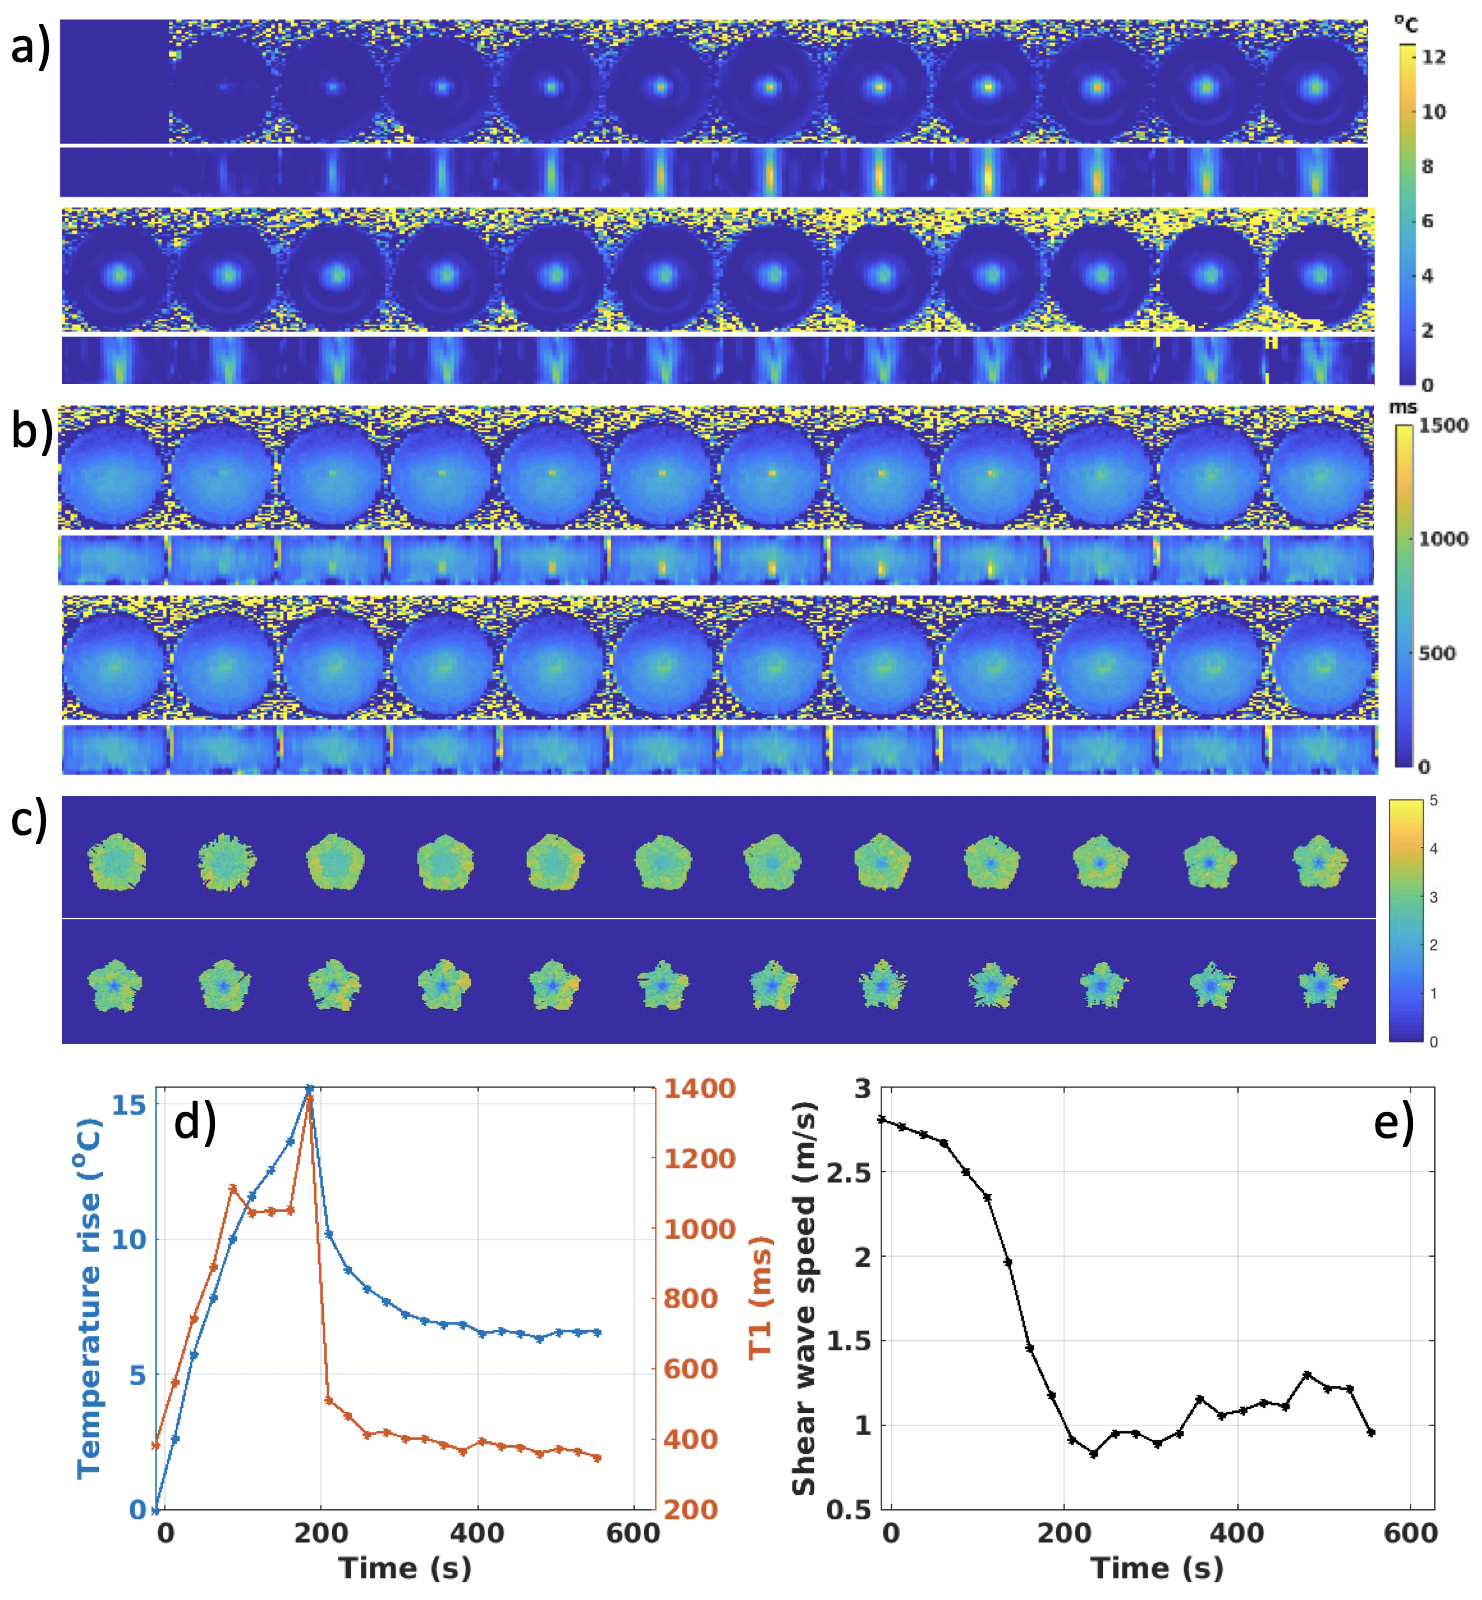
Figure 3 shows example of phase maps and the automatically detected wavefront positions used for shear wave speed calculation both before and after heating. In the unheated state, wavefronts are circularly symmetric. After heating at central location, the shear wavefront positions become highly distorted due to the phantom softening and slow shear wave speed in the heated region. Figures 4 and 5 show two orthogonal views of time courses of MR thermometry and T1, and shear wave speed maps for the 3- and 5-point MRSWE-points cases, respectively. To avoid melting the phantoms a modest heating power of 10 acoustic Watts was used, which resulted in temperature rises of 13-15 °C. This in turn resulted in T1 changes from ~400 ms to ~1400 ms and shear wave speed changed from ~2.0-2.5 m/s to 1.0 m/s.Discussion
Dynamically measuring PRF and T1 can allow for thermometry in all tissue types (aqueous and adipose). Combining thermal dose measurements with measurements of tissue mechanical properties and T1, which has been shown to change irreversibly with ablation (19), can potentially increase the precision of treatment endpoint assessments. Since all measures originate from the same scan they will also be inherently registered.The current acquisition time of 16-25 s for a set of all three measurements can be improved upon using, e.g., parallel imaging or compressed sensing-like approaches. For MR thermometry applications reduction factors of 2-6 have commonly been achieved (20–22). This could take the total scan time down to ~3-4 s, which is the acquisition time for current clinical applications.
Using more MRSWE points (Figure 5) provides more overlapping shear wave speed measurements and larger MRSWE maps. If imaging is sped up further more MRSWE points can be added for even larger coverage.
Conclusions
We have presented a pulse sequence which can efficiently measure PRF and T1 allowing for complete MR thermometry in all tissue types, as well as provide dynamic measurements of multiple parameters related to tissue coagulation.Acknowledgements
This work was supported by a University of Utah seed grant, the Mark H. Huntsman endowed chair and NIH grants R03EB023712 and S10OD018482References
1. Sapareto SA, Dewey WC. Thermal dose determination in cancer therapy. Int. J. Radiat. Oncol. Biol. Phys. 1984;10:787–800.
2. Hectors SJCG, Jacobs I, Heijman E, Keupp J, Berben M, Strijkers GJ, Grüll H, Nicolay K. Multiparametric MRI analysis for the evaluation of MR-guided high intensity focused ultrasound tumor treatment. NMR Biomed. 2015;28:1125–40. doi: 10.1002/nbm.3350.
3. Wijlemans JW, Deckers R, van den Bosch MAAJ, Seinstra BA, van Stralen M, van Diest PJ, Moonen CTW, Bartels LW. Evolution of the Ablation Region After Magnetic Resonance–Guided High-Intensity Focused Ultrasound Ablation in a Vx2 Tumor Model. Invest. Radiol. 2013;48:381–386. doi: 10.1097/RLI.0b013e3182820257.
4. Hijnen NM, Elevelt A, Grull H. Stability and trapping of magnetic resonance imaging contrast agents during high-intensity focused ultrasound ablation therapy. Invest. Radiol. 2013;48:517–524. doi: http://dx.doi.org/10.1097/RLI.0b013e31829aae98.
5. Hijnen NM, Elevelt A, Pikkemaat J, Bos C, Bartels LW, Grüll H, Grull H. The magnetic susceptibility effect of gadolinium-based contrast agents on PRFS-based MR thermometry during thermal interventions. J. Ther. ultrasound 2013;1:8. doi: 10.1186/2050-5736-1-8.
6. Damianou C, Hynynen K. The effect of various physical parameters on the size and shape of necrosed tissue volume during ultrasound surgery. J. Acoust. Soc. Am. 1994;95:1641–9.
7. Dewhirst MW, Viglianti BL, Lora-Michiels M, Hanson M, Hoopes PJ. Basic principles of thermal dosimetry and thermal thresholds for tissue damage from hyperthermia. Int. J. Hyperthermia 2003;19:267–94. doi: 10.1080/0265673031000119006.
8. McDannold NJ, King RL, Jolesz F a, Hynynen KH. Usefulness of MR imaging-derived thermometry and dosimetry in determining the threshold for tissue damage induced by thermal surgery in rabbits. Radiology 2000;216:517–523. doi: 10.1148/radiology.216.2.r00au42517.
9. Yarmolenko PS, Moon EJ, Landon C, Manzoor A, Hochman DW, Viglianti BL, Dewhirst MW. Thresholds for thermal damage to normal tissues: An update. Int. J. Hyperth. 2011;27:320–343. doi: 10.3109/02656736.2010.534527.
10. Jacobs MA, Ouwerkerk R, Kamel I, Bottomley PA, Bluemke DA, Kim HS. Proton, diffusion-weighted imaging, and sodium (23Na) MRI of uterine leiomyomata after MR-guided high-intensity focused ultrasound: a preliminary study. J. Magn. Reson. Imaging 2009;29:649–56. doi: 10.1002/jmri.21677.
11. Jacobs MA, Gultekin DH, Kim HS. Comparison between diffusion-weighted imaging, T2-weighted, and postcontrast T1-weighted imaging after MR-guided, high intensity, focused ultrasound treatment of uterine leiomyomata: preliminary results. Med. Phys. 2010;37:4768–76. doi: 10.1118/1.3475940.
12. Hectors SJCG, Jacobs I, Strijkers GJ, Nicolay K. Multiparametric MRI analysis for the identification of high intensity focused ultrasound-treated tumor tissue. Gelovani JG, editor. PLoS One 2014;9:e99936. doi: 10.1371/journal.pone.0099936.
13. Hectors SJCG, Jacobs I, Moonen CTW, Strijkers GJ, Nicolay K. MRI methods for the evaluation of high intensity focused ultrasound tumor treatment: Current status and future needs. Magn. Reson. Med. 2016;75:302–317. doi: 10.1002/mrm.25758.
14. Hofstetter LW, Odéen H, Bolster BD, Mueller A, Christensen DA, Payne A, Parker DL. Efficient shear wave elastography using transient acoustic radiation force excitations and MR displacement encoding. Magn. Reson. Med. 2019;81:3153–3167. doi: 10.1002/mrm.27647.
15. Ishihara Y, Calderon A, Watanabe H, Okamoto K, Suzuki Y, Kuroda K. A precise and fast temperature mapping using water proton chemical shift. Magn. Reson. Med. 1995;34:814–23.
16. Svedin BT, Payne A, Parker DL. Simultaneous proton resonance frequency shift thermometry and T 1 measurements using a single reference variable flip angle T 1 method. Magn. Reson. Med. 2019:1–15. doi: 10.1002/mrm.27643.
17. Bour P, Marquet F, Ozenne V, Toupin S, Dumont E, Aubry JF, Lepetit-Coiffe M, Quesson B. Real-time monitoring of tissue displacement and temperature changes during MR-guided high intensity focused ultrasound. Magn. Reson. Med. 2017;78:1911–1921. doi: 10.1002/mrm.26588.
18. Farrer AI, Odéen H, de Bever J, Coats B, Parker DL, Payne A, Christensen DA. Characterization and evaluation of tissue-mimicking gelatin phantoms for use with MRgFUS. J. Ther. Ultrasound 2015;3:9. doi: 10.1186/s40349-015-0030-y.
19. Diakite M, Payne A, Todd N, Parker DL. Irreversible change in the T1 temperature dependence with thermal dose using the proton resonance frequency-T1 technique. Magn. Reson. Med. 2013;69:1122–30.
20. Todd N, Vyas U, de Bever J, Payne A, Parker DL. Reconstruction of fully three-dimensional high spatial and temporal resolution MR temperature maps for retrospective applications. Magn. Reson. Med. 2012;67:724–30.
21. Gaur P, Grissom WA. Accelerated MRI thermometry by direct estimation of temperature from undersampled k-space data. Magn. Reson. Med. 2015;73:1914–25. doi: 10.1002/mrm.25327.
22. Jonathan S V., Grissom WA. Volumetric MRI thermometry using a three-dimensional stack-of-stars echo-planar imaging pulse sequence. Magn. Reson. Med. 2018;79:2003–2013. doi: 10.1002/mrm.26862.
Figures