4095
Multinuclear Virtual Observation Points1Medical Physics in Radiology, German Cancer Research Center (DKFZ), Heidelberg, Germany, 2Physics & Astronomy, Heidelberg University, Heidelberg, Germany
Synopsis
Parallel transmission (PTx) is a valuable tool for UHFMRI, but complicates SAR monitoring considerably. The Virtual Observation Point (VOP) algorithm has been crucial in enabling online SAR monitoring during PTx. To date, PTx has only been applied for proton, but as static field strengths continue to increase it becomes interesting to apply PTx methods for other nuclei. This abstract investigates how to apply the VOP algorithm to a transmit array operating at more than one frequency.
Introduction
Parallel transmission (PTx) is a valuable tool for UHFMRI, but complicates SAR control as peak SAR location changes depending upon the driving signals [1]. PTx SAR is typically monitored by measuring the complex transmit signals and applying a model derived from EM simulation. A SAR model typically contains millions of data points [2]. The Virtual Observation Point (VOP) algorithm [3] reduces this to 10s to 100s of points, making online SAR supervision feasible [4]. Currently PTx is only applied to 1H experiments, but as field strengths increase further it becomes interesting to apply the same methods to multinuclear studies, raising the question of how to manage SAR when transmitting with multiple channels and at two of more frequencies. This work investigates SAR estimation for a dual-tuned (31P-1H) transmit array operating at 7T using the VOP algorithm.Theory
An extended Q-matrix may be constructed as \begin{equation}\bf{Q}_\textit{ext} = \left(\begin{array}{cc}\bf{Q}_1 & \bf{0} \\ \bf{0} & \bf{Q}_2\end{array} \right)\end{equation} from the original Q-matrices $$$\bf{Q}_1$$$ and $$$\bf{Q}_2$$$ at the two different frequencies. Electric fields oscillating at different frequencies are uncorrelated, so the off-diagonal blocks are zero and there is no interaction between elements tuned for different nuclei. VOP compression may then be applied as usual.The VOP algorithm uses matrix norms to determine the similarity of Q-matrices as part of the clustering process. The spectral norm of an Hermitian matrix $$$\bf{A}$$$, is \begin{equation} \lVert\bf{A}\rVert_2 = \lambda_{\max} \left( \bf{A} \right) \end{equation} where $$$\lambda_{\max}$$$ is the largest eigenvalue of $$$\bf{A}$$$. The Frobenius norm is \begin{equation} \lVert\bf{A}\rVert_F = \sqrt{\sum_{i=1}^n \lambda_i^2(\bf{A}) }, \end{equation} where $$$n$$$ is the size of $$$\bf{A}$$$ and $$$\lambda_i$$$ are its eigenvalues [5]. For a block diagonal matrix, such as a combined Q-matrix, the spectral norm can only provide information from the dominant block, while the Frobenius norm carries information from the entire matrix.
Methods
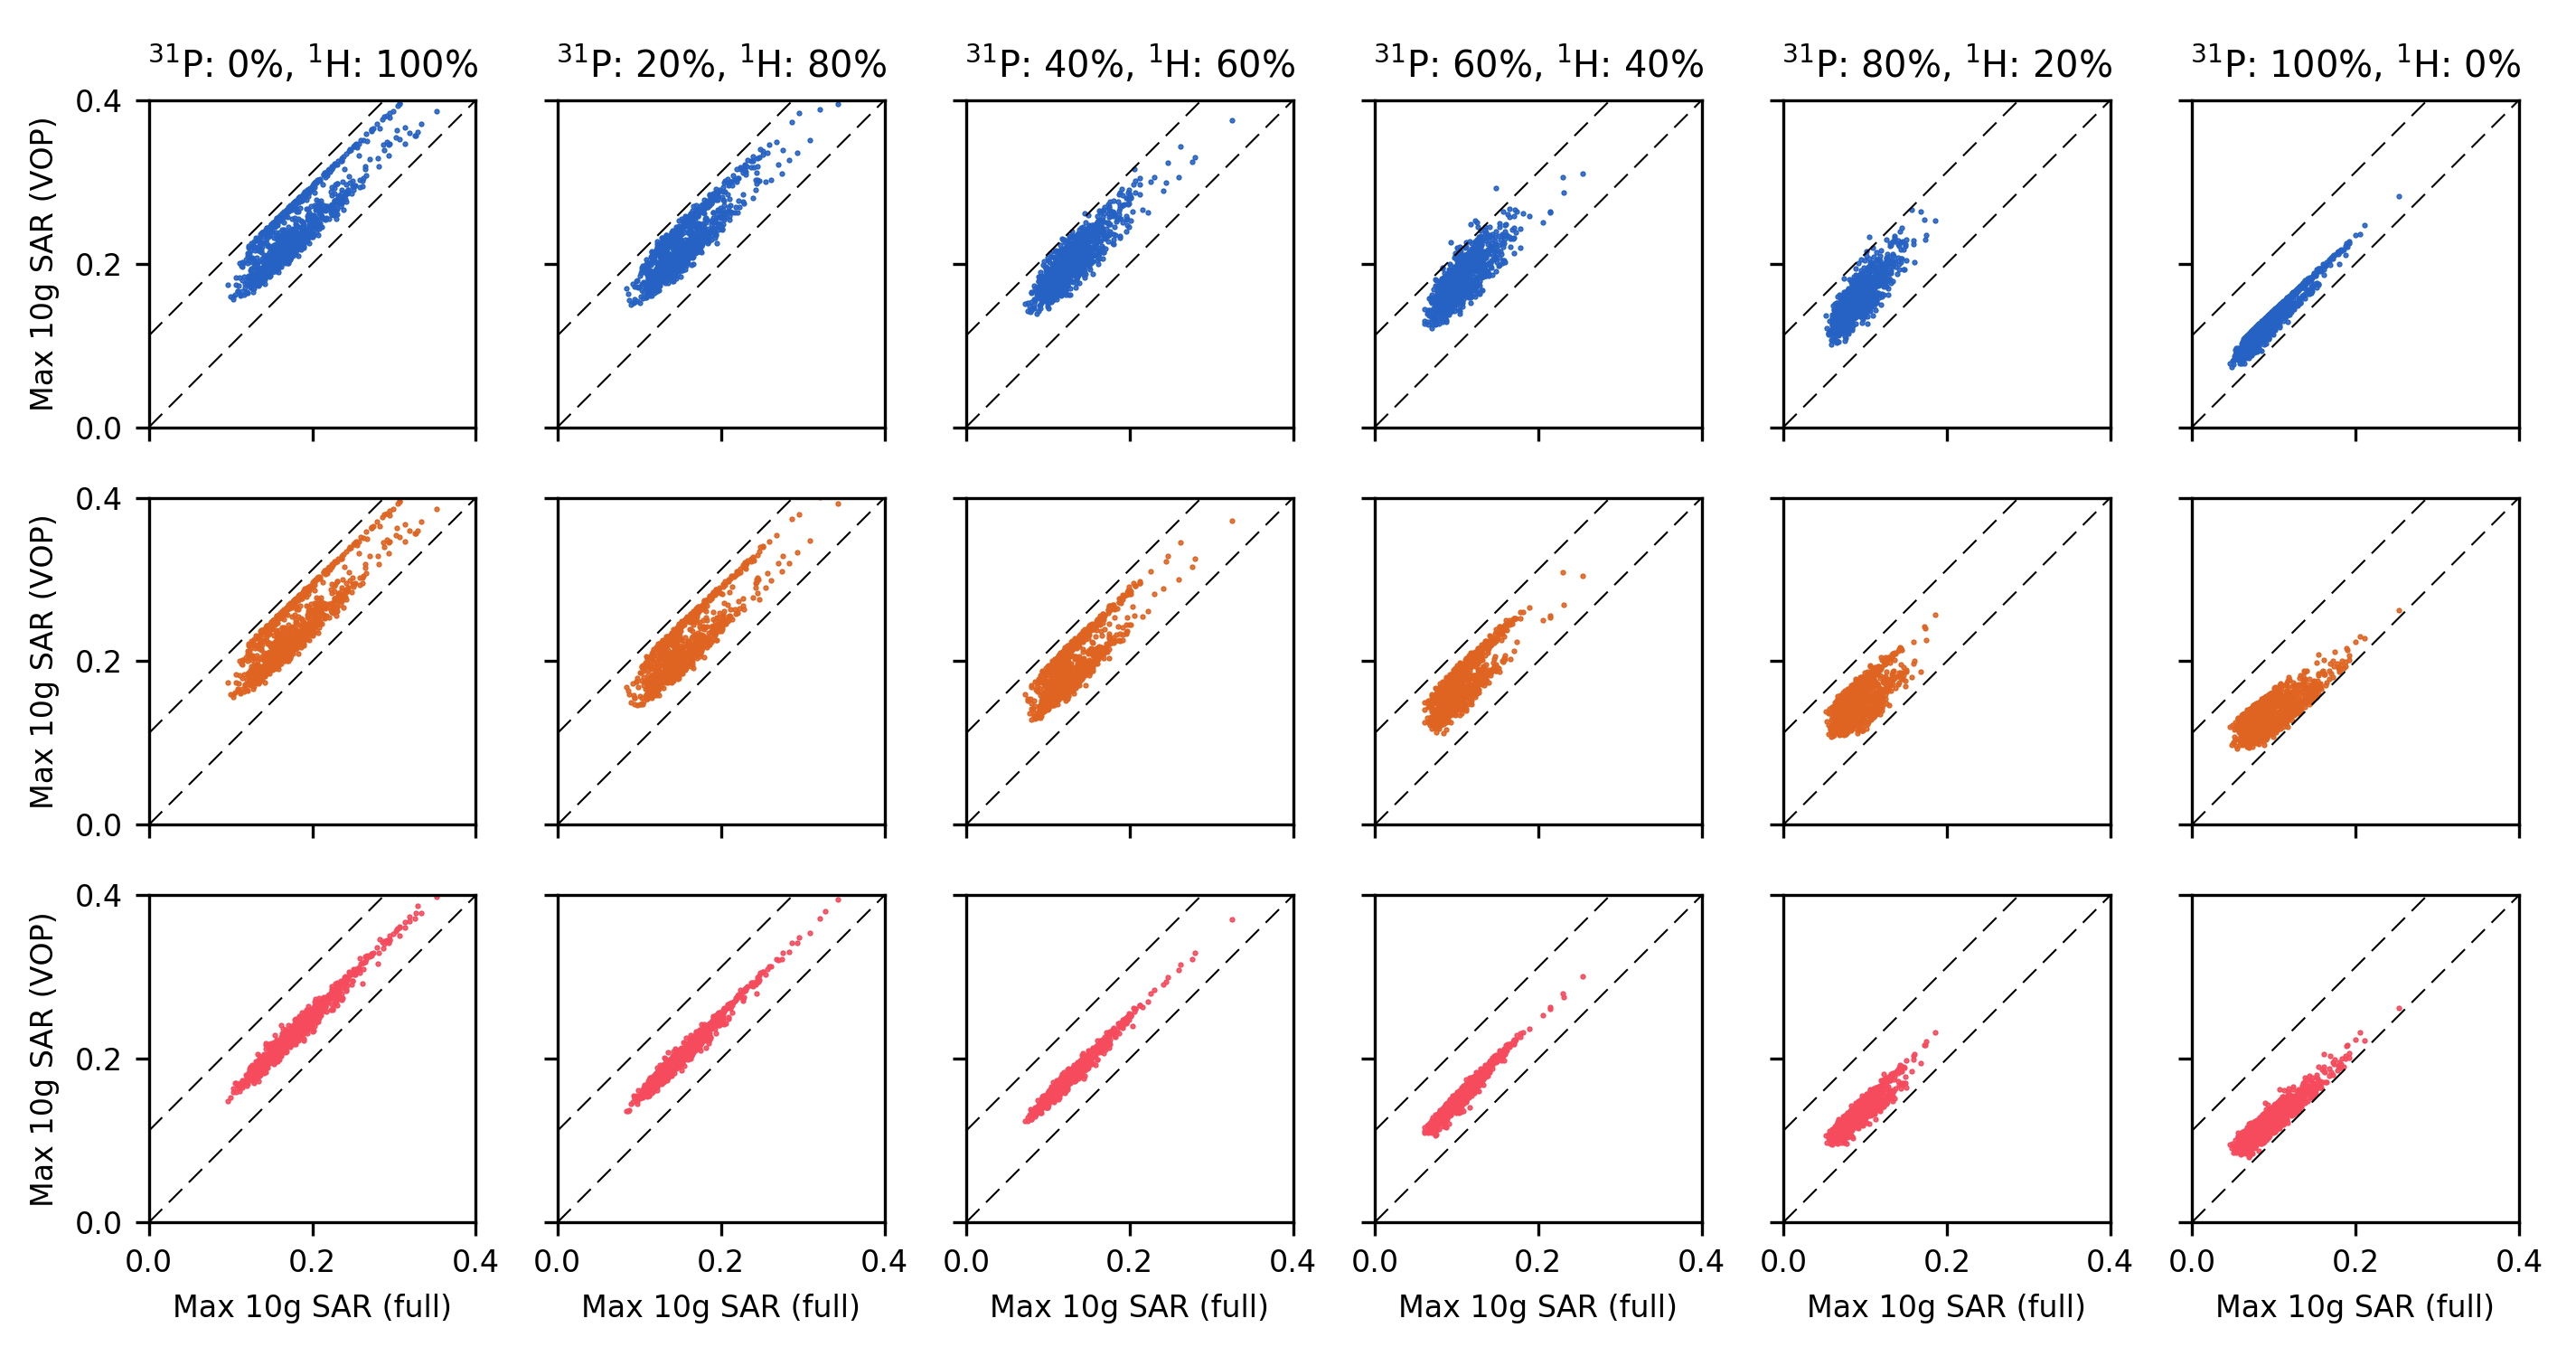
A transmit array (fig. 1), consisting of six meandered dipoles [5] tuned to 120MHz and eight fractionated dipoles [6] tuned to 297MHz, was simulated (CST Studio Suite 2019, Dassault Systemes). The array was loaded with the Duke body model [7] with the prostate centred in the array. Electric field data and tissue properties were exported and all further processing was performed using custom code written in Fortran. Q-matrices [8] were generated at 120 and 297MHz for each voxel location, and averaged over 10g of tissue. VOP compression was then run on 31P and 1H Q-matrices separately, and using the combined Q-matrices. For the separate calculation, a set of VOPs was calculated at each frequency. SAR was evaluated by splitting the driving signal into 31P and 1H parts, calculating the maximum SAR across all VOPs in each set, and summing the two results. For the combined calculation, Q-matrices at each location were combined and passed through the normal VOP compression algorithm, employing either the spectral or Frobenius norm. SAR was evaluated by applying the full driving vector to all VOPs and selecting the maximum result. VOP performance was then evaluated using 1000 random driving vectors, normalised such that the power division between 1H and 31P was ramped from 0-100% to 100-0% in 20% steps. In each case, SAR was calculated (1) with the full set of Q-matrices at both frequencies (ground truth), (2) using the separate VOPs and summing the highest value at each frequency, and (3) and (4) using the combined VOPs calculated from the full Q-matrices using the spectral or Frobenius norm, respectively.Results
Compression with an over-estimation threshold of 10% reduced 21,248,872 Q-matrices in the full dataset to 28 (31P) and 41 (1H) separate VOPs and 55 (spectral) and 46 (Frobenius) combined VOPs, respectively. Figure 2 plots the VOP-estimated 10g SAR against SAR calculated from the full dataset using separate (blue), spectral-combined (orange) and Frobenius-combined (red) VOPs, at a range of power division ratios.Discussion
In no case was the VOP-calculated SAR seen to under-estimate the actual SAR. When using VOPs calculated separately at each frequency, in some cases the estimated SAR exceeded the specified upper limit for over-estimation (e.g. 60% 31P and 40% 1H). This is unsurprising, as the maximum over-estimation factor is only enforced for each VOP set separately. Both sets of results using the combined VOPs stay within bounds for all trials. Using the spectral norm consistently gives a worse estimate than the Frobenius norm, even though the Frobenius-norm VOP set is slightly smaller than the spectral-norm VOP set. Finally, the case of 100% 31P power is interesting. The separately calculated VOP set reduces to a single set of VOPs calculated at the 31P frequency. Both combined VOP sets produce higher over-estimation than the separate set, demonstrating the uncertainty added to the VOP sets due to the combined calculation.Conclusion
Heating due to electric fields at the 31P and 1H frequencies can be considered as two separate, non-interacting processes. However, to produce a VOP-based SAR estimate with low over-estimation, it is advantageous to combine information from the two sets of fields into a single set of Q-matrices, and to run VOP compression on that combined set. Extending an existing VOP-based SAR monitoring system to include multinuclear VOPs is expected to require small changes in hardware and software, which bodes well for future implementation.Acknowledgements
No acknowledgement found.References
[1] Zhu, MRM 51(4), 2004; [2] Padormo et al, NMR Biomed 29(9), 2016; [3] Eichfelder & Gebhardt, MRM 66(5), 2011; [4] Gumbrecht et al, #4420, ISMRM 2013; [5] Golub and Van Loan. Matrix Computations, 3rd edition, 1996; [6] Haghnejad et al, #2139, ISMRM 2016; [7] Raaijmakers et al, MRM 75(3), 2016; [8] Christ et al, Phys. Med. Biol. 55(2), 2010; [9] Homann et al, MRM 65(2), 2011.
Figures