4090
Assessment of planar coil noise performance with discrete uHDC material1Radiology, PennState University College of Medicine, Hershey, PA, United States, 2Neurosurgery, PennState University College of Medicine, Hershey, PA, United States
Synopsis
A study of the noise performance of a planar coil array in the presence of ultra-high dielectric constant (uHDC) material was undertaken. We measured changes in the noise standard deviation and correlation matrix of a 4 channel flex array due to manipulation of uHDC block locations, with blocks either fully overlapping a single channel or straddling two channels. Overlapping a block with a coil element increased the noise of that element, while reducing next-neighbor noise correlations. Further research into this effect could lead to the design of more optimal dielectric configurations that achieve greater SNR.
Purpose
Prior work has examined the SNR benefits offered by ultra-high dielectric constant (uHDC) materials at 3T1,2. These studies measured SNR and noise performance with uHDC material that was placed freely with respect to the coil elements. Thus, one aspect that has not been studied systematically is the effect of uHDC material location (relative to coil elements) upon coil noise and correlation matrices. Here we present a study of the noise performance of a planar coil array with monolithic uHDC blocks, where blocks either fully align with a single coil element or overlap two coil elements.Methods
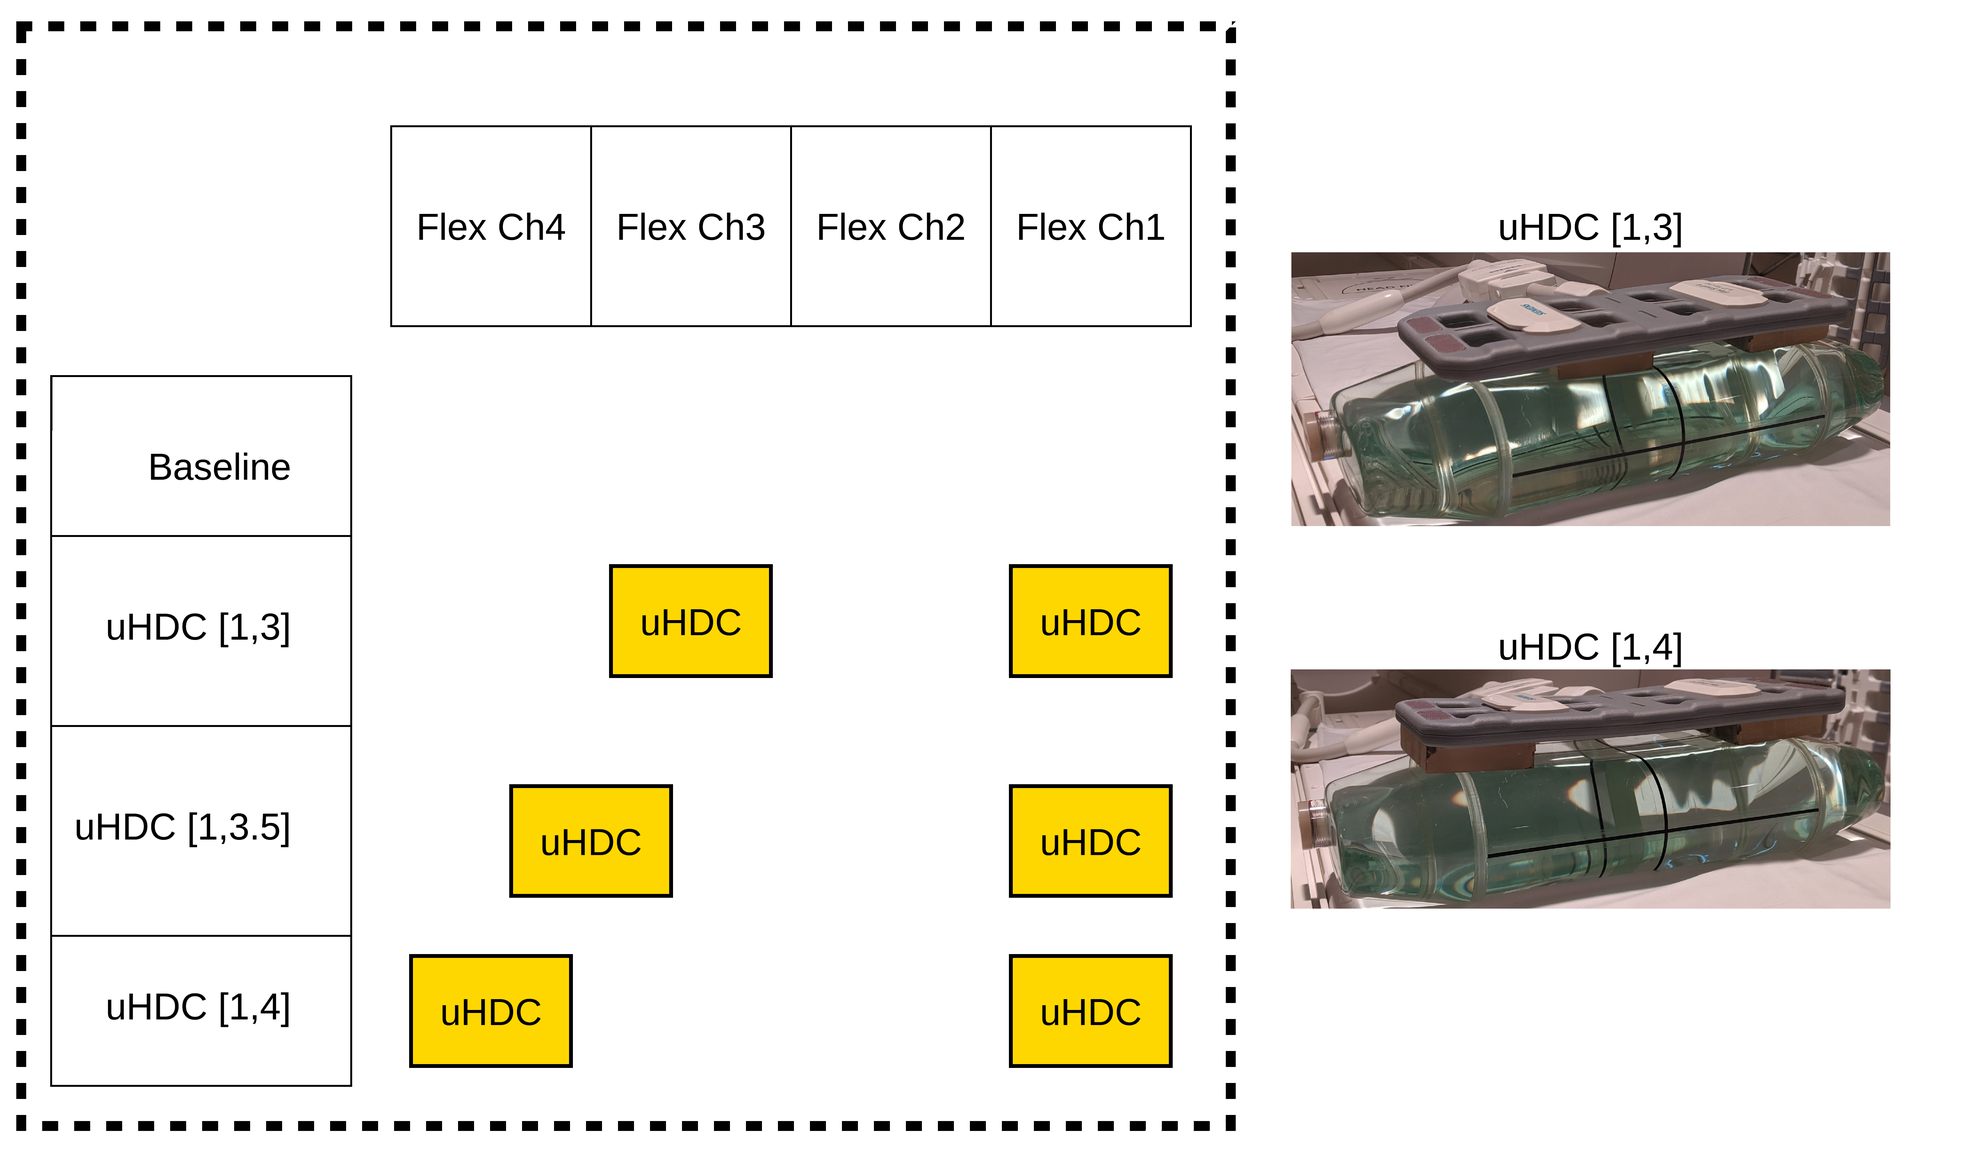
Figure 1 displays the experimental setup utilized in this study. Four configurations were considered, with the placement of two monolithic uHDC blocks (105 x 80 x 20 mm, permittivity approximately 850, PZT) varied between configurations. As an example, uHDC [1,3.5] indicates the two blocks were placed to align with the 1st channel and overlap the 3rd and 4th channels of the flex array. Likewise, uHDC [1,4] indicates blocks aligned with the 1st and 4th channels respectively. Photographs on the right depict two of the configurations, as used in experiment. All data was acquired on a Siemens 3T PrismaFit (Siemens Healthineers, Erlangen, Germany). A Siemens body phantom was imaged in all configurations. Transmission utilized the system body coil and reception a Siemens 4-channel planar flex array (Fig.1). A 3D spoiled GRE sequence (2 mm3 isotropic, TR = 35 ms, FA = 10 degrees) with integrated noise pre-scans was acquired for each configuration. Additionally, B1+ maps were acquired with a 3D AFI3 sequence (3 mm3 isotropic, TR1/TR2 = 25/125 ms, FA = 60 degrees). Per-channel noise standard deviation and noise correlation matrices were calculated from the noise pre-scans. SNR was calculated with the SNR Units Method4 followed by division with the B1+ map to remove transmit effects.Results & Discussion
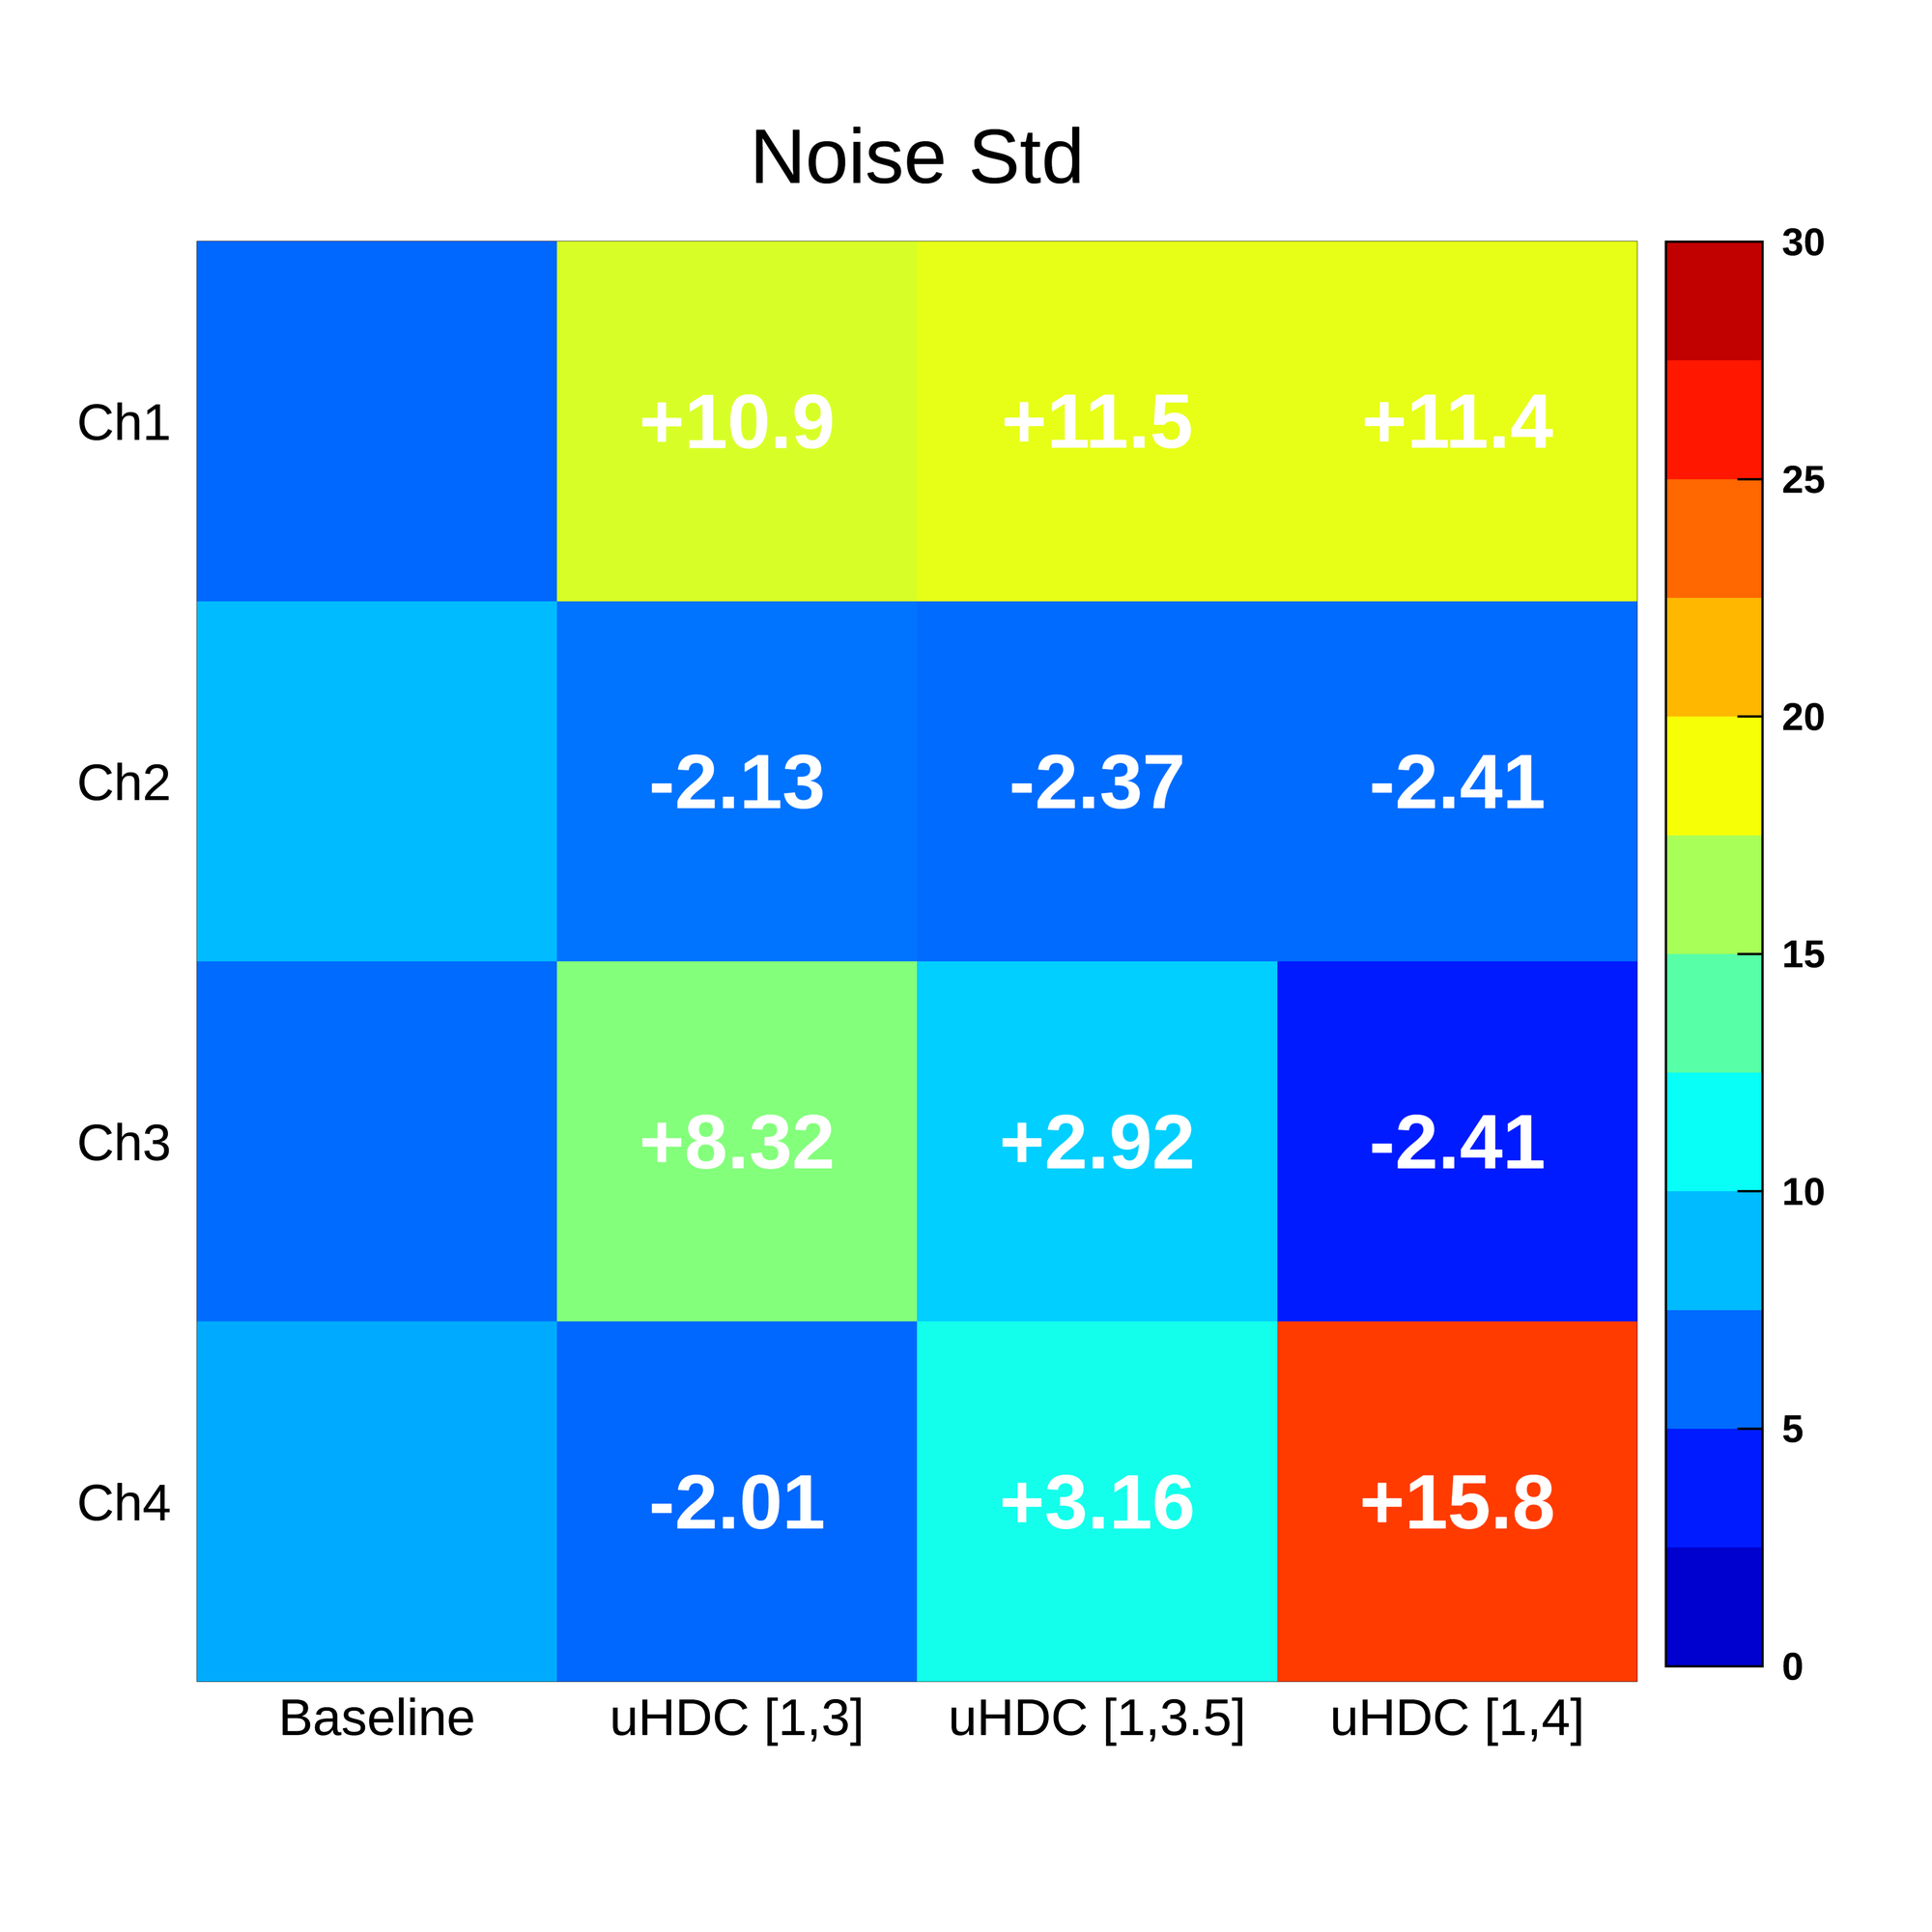
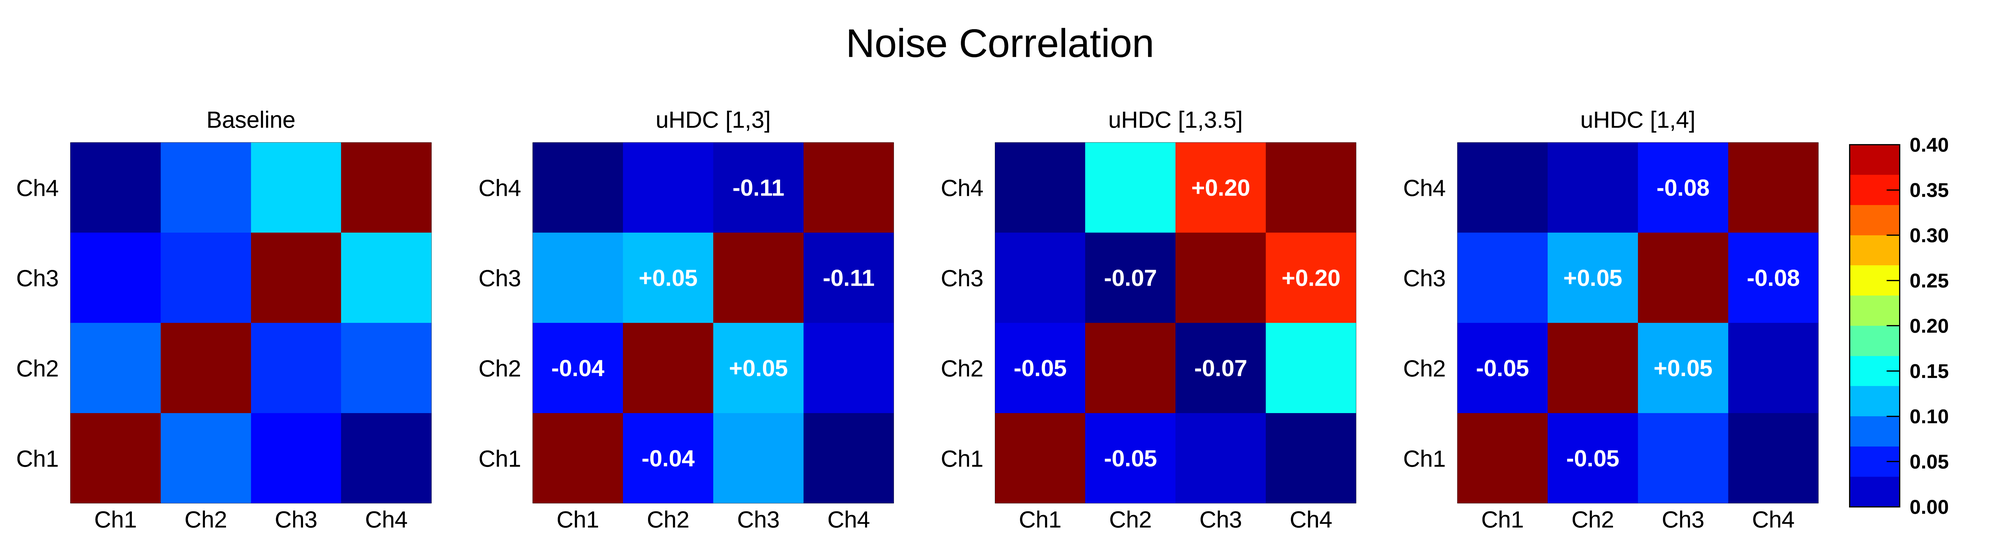
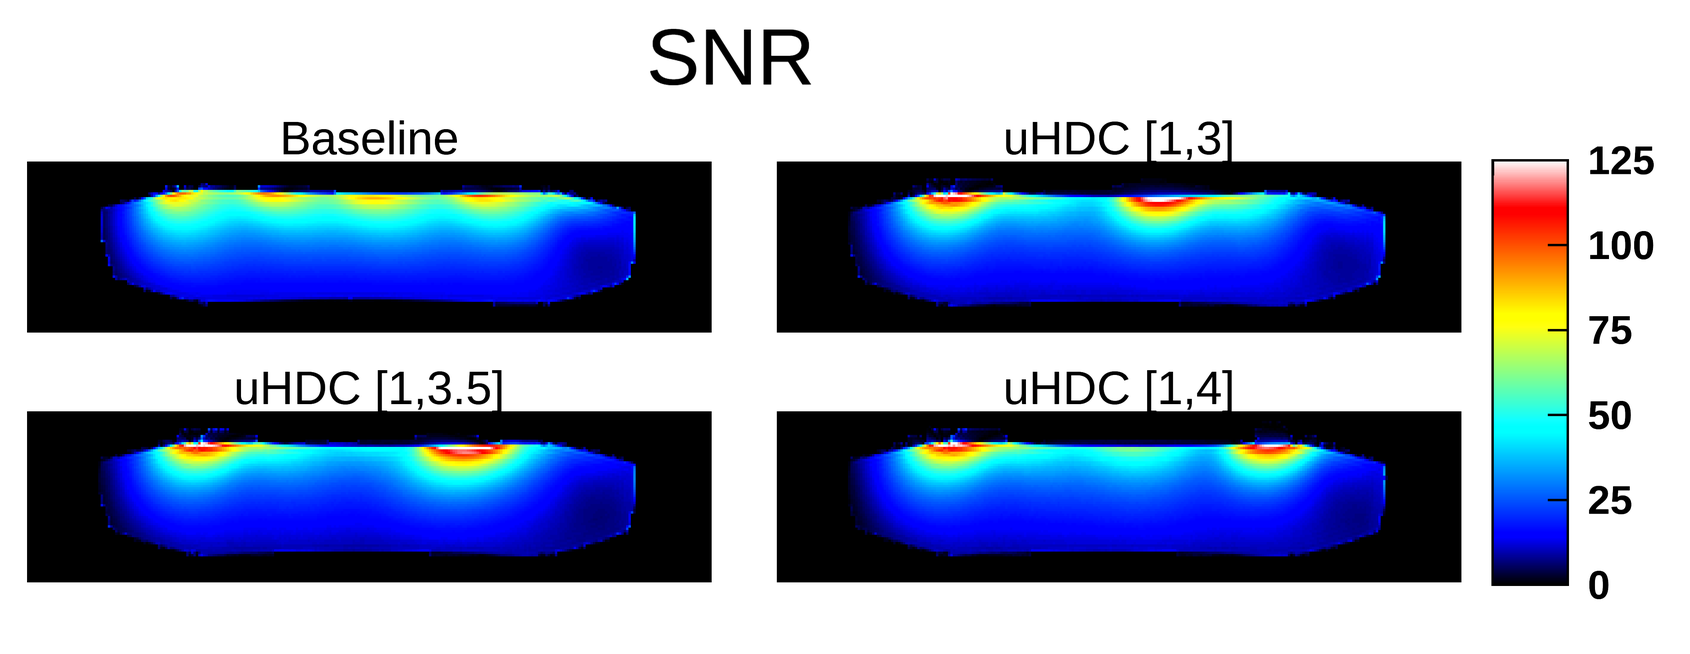
Figure 2 displays the measured noise standard deviation on each channel for each configuration, with the color bar indicating the numerical value of the noise. Printed white text indicates the change from the respective measurement in the baseline column on the left. All three configurations with uHDC aligned a block with Channel 1, and a consistent noise increase of about 3 times from baseline was noted. As the second uHDC block was shifted from Channel 3 to 4, the noise increases were observed to follow the block location. Interestingly, noise decreases were observed on channels not overlapping with uHDC, especially Channel 2. Figure 3 displays the measured noise correlation matrix for each configuration, with printed white text again representing change from the respective matrix element in baseline. In the uHDC [1,3] and [1,4] configurations, next-neighbor correlations were reduced between Channels 1&2 and 3&4. Placement of the second uHDC block in-between Channels 3 and 4 (uHDC [1,3.5]) caused a significant increase in correlations between those channels, but decreases elsewhere. Prior studies have demonstrated that uHDC material has an effect of focusing electromagnetic field flux2. When a uHDC block fully aligns with one channel, shared flux with neighboring channels may be reduced, thus reducing correlations. Placement of a uHDC block overlapping two channels causes significant increases in correlation, because the focused flux is now shared between those channels. Figure 4 displays the calculated SNR map for each configuration, taken from a central axial slice. Strong increases in SNR were observed on channels located next to uHDC blocks. This behavior suggests the increase in coil sensitivity overcame any increase in noise. SNR was consistently lower at Channel 2 with uHDC present, due to the redistribution of the magnetic flux close to the uHDC material.Conclusion
We have presented a simple analysis of the noise performance of a planar coil array with uHDC material. Generally, the presence of a uHDC block increased the noise on nearby coil elements, while elements located further away saw reduced noise. Aligning the block with a coil element seemed to reduce next-neighbor correlations, while overlapping a block between two elements significantly increased the correlation of those elements. Consideration of these effects could provide a way to further optimize discrete or semi-discrete configurations of dielectric material.Acknowledgements
This work was supported in part by NIH grants of U01 EB026978References
[1] Koolstra et al, “Improved Image Quality and Reduced Power Deposition in the Spine at 3 T Using Extremely High Permittivity Materials”, MRM 2018; 79(5): 1192-1199
[2] Rupprecht et al, “Improvements of transmit efficiency and receive sensitivity with ultrahigh dielectric constant (uHDC) ceramics at 1.5T and 3T”, MRM 2018; 79(5): 2842-51
[3] Yarnykh, “Actual Flip-Angle Imaging in the Pulsed Steady State: A Method for Rapid Three-Dimensional Mapping of the Transmitted Radiofrequency Field” MRM 2007; 57:192-200
[4] Kellman et al, “Image reconstruction in SNR units: a general method for SNR measurement”, MRM 2005; 54(6): 1439-47
Figures