4084
High-Permittivity Dielectric Probes for Ultra-High Field MR Microscopy at 17.2 T1Institut Fresnel, Aix Marseille Université, Marseille, France, 2Multiwave Imaging, Marseille, France, 3DRF/Joliot/Neurospin/UNIRS, Gif-sur-Yvette, France, 4ITMO University, Saint-Petersbourg, Russian Federation, 5Leiden Univ. Medical Center, Leiden, Netherlands
Synopsis
We propose a theoretical model predicting the Signal-to-Noise Ratio (SNR) of dielectric antennas for Magnetic Resonance Imaging. The SNR is estimated with a semi-analytical approach describing the first transverse electric mode of a high-permittivity ring resonator. When the ring is properly excited with a feeding loop, it induces a strong magnetic field in the sample while dielectric losses are limited due to low electric field intensity in this region. The proposed model is validated with numerical simulations regarding microscopy applications and its prediction confirmed experimentally at 17.2 T.
Introduction
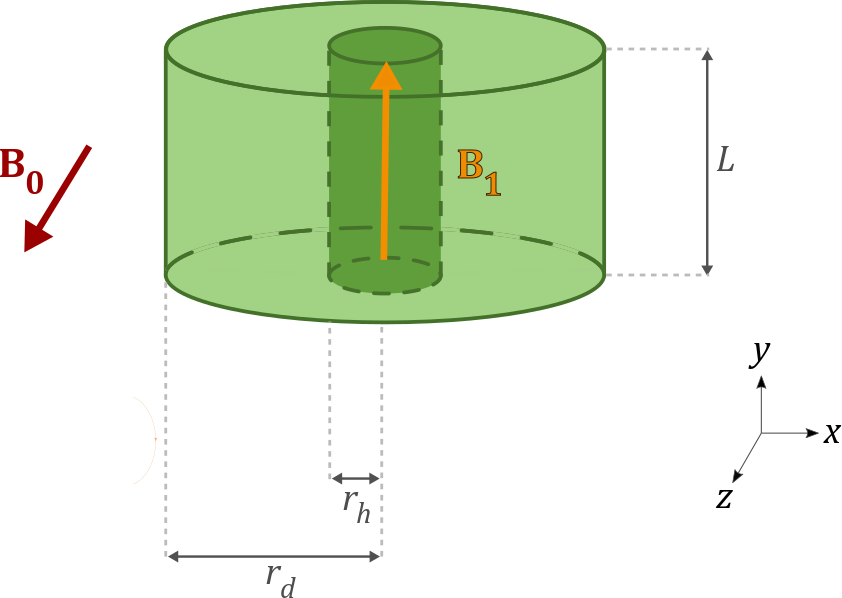
Magnetic Resonance Microscopy (MRM) aims at imaging small samples with very high spatial resolution (<< 100 μm) using B0 field strengths between 7 T and 22 T1. At such fields, the conventional RF coil is the solenoid. However, for lossy biological samples, its ultimate Signal-to-Noise Ratio (SNR) is intrinsically limited by the significant electric field within the sample2. Dielectric resonators are an alternative probe design to tackle this issue3,4: high-permittivity rings support eigenmodes whose frequency characteristics rely on the resonator dimensions and the material properties5,6. The first transverse electric mode (TE01δ) produces a strong B1 excitation field (Fig. 1), and a low E-field. Here we present a semi-analytical model (SAM) to design dielectric ring probes with high SNR7. This model is validated with numerical simulations and experimentally tested for MRM at 17.2 T8.Methods
The noise is dominated by losses in the dielectric ring (volume $$$V_\mathbf{ring}$$$, outer and inner radii $$$r_\mathbf{d}$$$ and $$$r_\mathbf{h}$$$, height $$$L$$$, permittivity $$$\epsilon_\mathbf{r}$$$) and in the sample (volume $$$V_\mathbf{samp}$$$, radius $$$r_\mathbf{h}$$$, height $$$L$$$, electrical conductivity $$$\sigma_\mathbf{samp}$$$). The SNR is proportional to the SNR factor (Eq. 1) with $$$H_\mathbf{samp}(0)$$$ the H-field amplitude in the sample, and (Eq. 2)9 the total dielectric losses.(Eq. 1) $$u_\mathbf{SNR}=H_\mathbf{samp}(0)/\sqrt{P_\mathbf{loss}}$$
(Eq. 2) $$P_\mathbf{loss}=\frac{1}{2}\omega\epsilon''\int_{V_\mathbf{ring}}|\mathrm{E}|^2dv+\frac{1}{2}\sigma_\mathbf{samp}\int_{V_\mathbf{samp}}|\mathrm{E}|^2dv$$
The TE01δ mode field is described by Bessel and Hankel functions in cylindrical coordinates $$$\left(\rho,\theta,y\right)$$$. As this mode has a cylindrical symmetry, $$$H_y$$$, $$$H_\rho$$$ and $$$E_\theta$$$ are the only nonzero components10. Expressing $$$H_y$$$, as in Eqs. 3-4 with $$$\alpha_\Omega$$$ and $$$\beta_\Omega$$$ the wavenumbers in region $$$\Omega$$$, enables to derive the other components11,12.
(Eq. 3)$$H_\mathbf{y,samp}\left(\rho,y\right)\propto J_\mathbf{0}\left(\alpha_\mathbf{samp}\rho\right)\cos\left(\beta_\mathbf{samp}y\right)$$
(Eq. 4)$$H_\mathbf{y,ring}\left(\rho,y\right)\propto \left[H_\mathbf{0}^\mathbf{(1)}\left(\alpha_\mathbf{ring}\rho\right)+\xi H_\mathbf{0}^\mathbf{(2)}\left(\alpha_\mathbf{ring}\rho\right)\right]\cos\left(\beta_\mathbf{ring}y\right)$$
The E-field, derived from the spatial derivative of $$$H_\mathbf{y}$$$, is proportional to the H-field amplitude. In Eq. 3, this amplitude is $$$H_\mathbf{samp}(0)$$$. To analytically express dielectric losses, the probe EM field is simplified to that of the corresponding disk: $$$\mathrm{E}\left(\overrightarrow{r}\right)_{|ring}=\mathrm{E}\left(\overrightarrow{r}\right)_{|disk}$$$, $$$\mathrm{E}\left(\overrightarrow{r}\right)_{|samp}=\tau\mathrm{E}\left(\overrightarrow{r}\right)_{|disk}$$$ and $$$\mathrm{E}\left(\overrightarrow{r}\right)_{|disk}\propto J_\mathbf{1}\left(\alpha_\mathbf{disk}\rho\right)$$$. $$$\tau$$$ reflects the amplitude decrease from permittivity contrast between the sample and the ring. Eq. 1 becomes Eq. 5 with $$$P_\mathbf{loss,norm}^\mathbf{i}=P_\mathbf{loss}^\mathbf{i}/|H_\mathbf{disk}(0)|^2$$$.
(Eq. 5) $$u_\mathbf{SNR}^\mathbf{DR}=\tau/\sqrt{P_\mathbf{loss,norm}^\mathbf{ring}+\tau^2 P_\mathbf{loss,norm}^\mathbf{samp}}$$
A Frequency Domain Solver (CST Microwave Studio) was used to evaluate the field distribution of the mode excited in the dielectric probe by a 1 cm diameter non-resonant loop. In a “combined method”, the SNR factor is computed with Eq. 5 applied to the field exported from numerical simulations run in the CST Eigenmode Solver (mesh step: 0.2 mm isotropic).
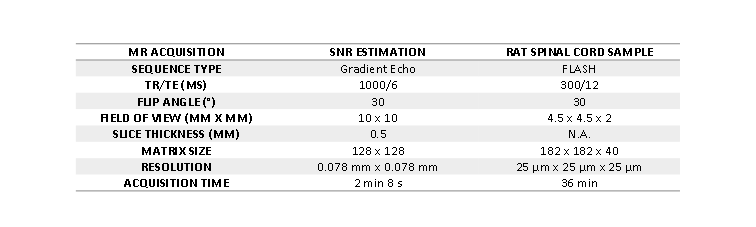
The experimental resonator was built with a ferroelectric ceramic8 with the following parameters at 730 MHz (Larmor frequency at 17.2 T): $$$r_\mathbf{d}$$$ = 9 mm, $$$r_\mathbf{h}$$$ = 2.8 mm, $$$L$$$ = 10 mm, $$$\epsilon_\mathbf{r}$$$ = 536, $$$\tan\delta$$$ = $$$8\times 10^{-4}$$$. The phantom used was a tube of diameter 4.5 mm and length 12 mm filled with a solution of permittivity $$$\epsilon_\mathbf{r,test}$$$ = 50 and conductivity $$$\sigma_\mathbf{test}$$$ = 1 S/m. The corresponding optimal solenoid has 4 turns, 7 mm diameter, 12 mm length and is made with 1.5 diameter copper wire2. Its SNR factor can be found in the literature2. MRI acquisitions were performed on a preclinical device (Bruker BioSpin, Ettlingen, Germany) equipped with a triaxial gradient system of maximum strength 1 T/m. The biological sample studied was a chemically fixed rat spinal cord. MR acquisitions were performed with sequences described in Fig. 2.
Results
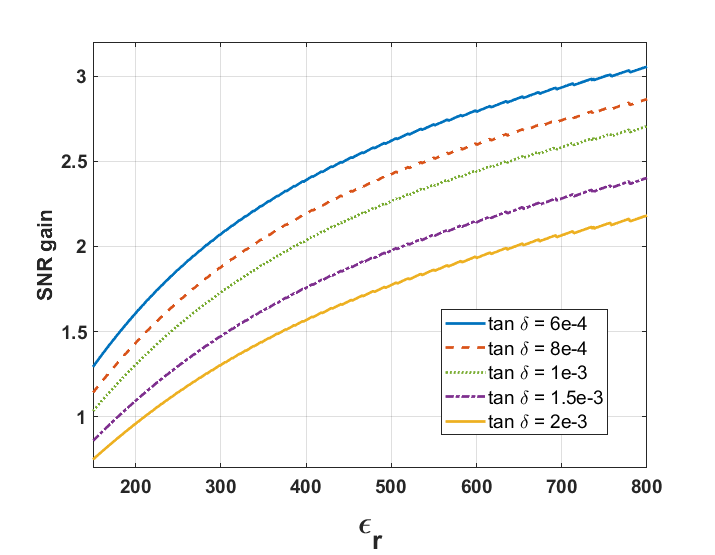
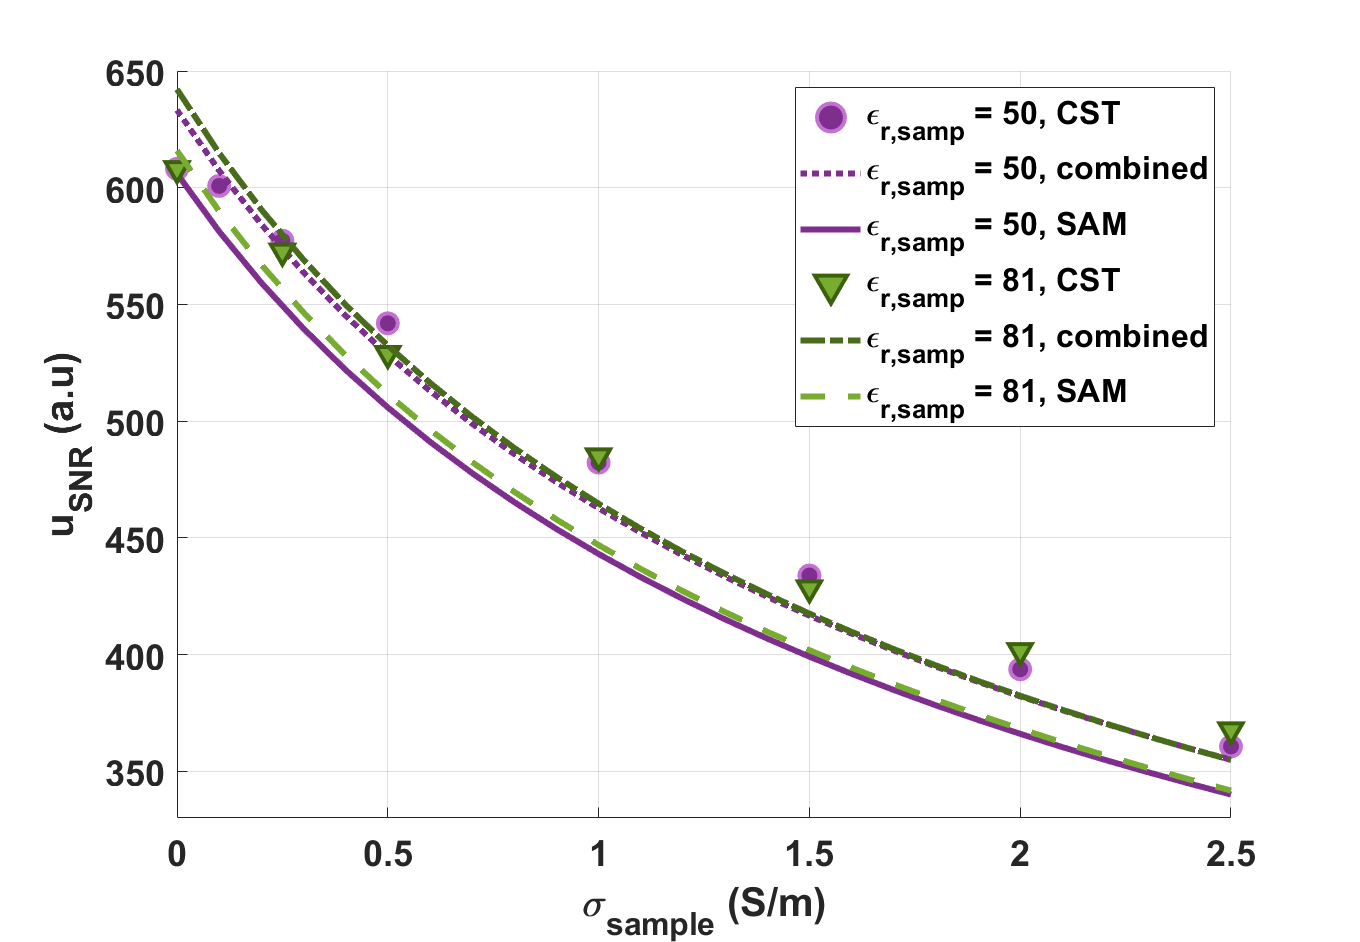
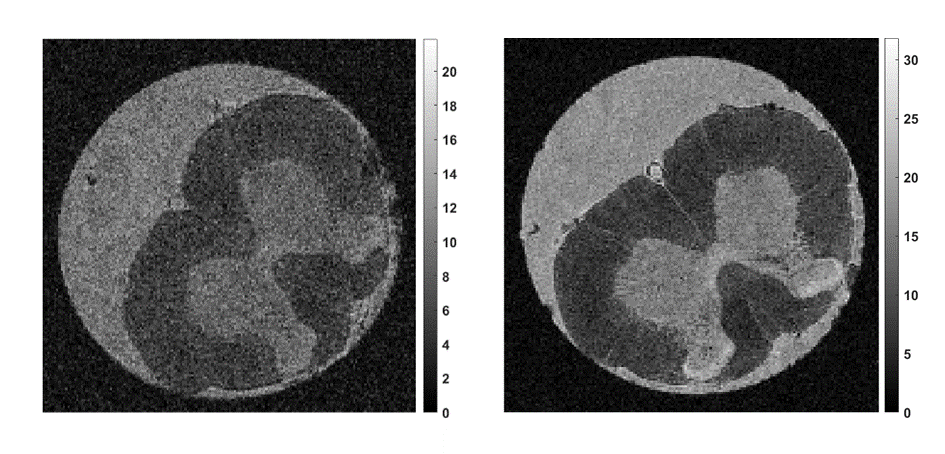
The SAM was used to estimate the SNR gain $$$u_\mathbf{SNR}^\mathbf{DR}/u_\mathbf{SNR}^\mathbf{sol}$$$, plotted in Fig. 3 for the phantom as a function of the dielectric properties. For each permittivity, $$$r_\mathbf{d}$$$ was adapted to adjust the TE01δ mode to the Larmor frequency. When $$$\tan\delta \leq 2 \times 10^{-3}$$$ and $$$\epsilon_\mathbf{r}\geq 220$$$, the semi-analytical method predicts a higher SNR with the dielectric probe than with the optimal solenoid. From this dependency, the prototype properties were selected, resulting in a theoretical SNR gain of 2.5. The prototype SNR factor was computed using the SAM and compared to numerical simulations and a combined method as shown in Fig. 4. The sample permittivities were 50 and 81 and its conductivity was varied from 0 to 2.5 S/m. The relative error between the SAM and the commercial software was always below 8%7. Finally, experiments performed on the test solution resulted in a measured SNR gain of 2.2 (versus 2.5 theoretically), as obtained with numerical simulations. Fig. 5 demonstrates that the ceramic probe performs better than the optimal solenoid when imaging the biological sample, with an SNR gain of 1.45.Discussion
The SAM estimates the SNR factor with an error lower than 8% over a large range of electromagnetic properties. The SNR gain estimation was validated in one case, in which the predicted value was within 15% of the experimentally measured value.Conclusion
This study focused on the modelling of dielectric ring probes in which the first TE mode is excited to generate the B1 field used in MR acquisitions. The semi-analytical model predicts the performance of such probes with a good accuracy and can be used as a design guideline. Our current and future work includes the extension of dielectric probes modelling to clinical applications. This includes resonators with human scale dimensions, as well as the study of higher resonant modes (like HEM modes).Acknowledgements
This project received funding from the European Union’s Horizon 2020 Research and Innovation programme (grant No 736937) and from an ERC Advanced Grant (NOMA-MRI 670629). S.G. acknowledges the support by the President of the Russian Federation (МК-3620.2019.8).References
1. Ciobanu, L. (2017). Microscopic Magnetic Resonance Imaging: A Practical Perspective. Pan Stanford.
2. Minard, K. R., & Wind, R. A. (2001). Solenoidal microcoil design—Part II: Optimizing winding parameters for maximum signal‐to‐noise performance. Concepts in Magnetic Resonance, 13(3), 190-210.
3. Haines, K., Neuberger, T., Lanagan, M., Semouchkina, E., & Webb, A. G. (2009). High Q calcium titanate cylindrical dielectric resonators for magnetic resonance microimaging. Journal of Magnetic Resonance, 200(2), 349-353.
4. Neuberger, T., Tyagi, V., Semouchkina, E., Lanagan, M., Baker, A., Haines, K., & Webb, A. G. (2008). Design of a ceramic dielectric resonator for NMR microimaging at 14.1 tesla. Concepts in Magnetic Resonance Part B: Magnetic Resonance Engineering: An Educational Journal, 33(2), 109-114.
5. Mongia, R. K., & Bhartia, P. (1994). Dielectric resonator antennas—A review and general design relations for resonant frequency and bandwidth. International Journal of Microwave and Millimeter‐Wave Computer‐Aided Engineering, 4(3), 230-247.
6. Kajfez, D., & Guillon, P. (1998). Dielectric resonators (p. 547). Atlanta: Noble Publishing Corporation.
7. Moussu, M. A.C., Abdeddaim, R., Dubois, M., Georget, E., Webb, A. G., Nenasheva, E., Belov, P., Glybovski, S., Ciobanu, L., & Enoch, S. (2019). A Semi-Analytical Model Of High Permittivity Dielectric Ring Resonators for Magnetic Resonance Imaging. Under review.
8. Moussu, M. A., Ciobanu, L., Kurdjumov, S., Nenasheva, E., Djemai, B., Dubois, M., ... & Glybovski, S. (2019). Systematic Analysis of the Improvements in Magnetic Resonance Microscopy with Ferroelectric Composite Ceramics. Advanced Materials, 1900912.
9. Petit, R. (1989). Ondes électromagnétiques en radioélectricité et en optique (Vol. 2). Paris: Masson.
10. Pozar, D. M. (2009). Microwave engineering. John Wiley & Sons.
11. Zhang, K., Li, D., Chang, K., Zhang, K., & Li, D. (1998). Electromagnetic theory for microwaves and optoelectronics (pp. 274-283). Berlin: Springer.
12. Sheen, J. (2008). A dielectric resonator method of measuring dielectric properties of low loss materials in the microwave region. Measurement Science and Technology, 19(5), 055701.
Figures