4079
Efficient 3D-Characterization of Metamaterial Devices for Enhanced Magnetic Resonance Imaging1MR Physics, Fraunhofer MEVIS, Bremen, Germany, Bremen, Germany, 2Antenna Technology and Electromagnetic Modelling, Fraunhofer Institute for High Frequency Physics and Radar Techniques FHR, Wachtberg, Germany, 3University of Oldenburg, Oldenburg, Germany, 4MR-Imaging and Spectroscopy, Faculty 01 (Physics/Electrical Engineering), University of Bremen, Bremen, Germany
Synopsis
We present a dedicated RF-measurement setup consisting of custom-build Tx/Rx coils, an automated positioning system and a vector network analyzer that is suitable for an efficient characterization of MR-metamaterial devices which is crucial during the design stage. We measure complex scattering parameters over a large volume in air and obtain dispersion curves of a magneto-inductive lens and a wire-resonator metasurface that have been designed for 3T applications. Strong field enhancement effects are observed close to the metasurface as well as the positional dependency of extrema in dispersion curves.
Introduction
Metamaterials are artificial, usually periodic arrangements of sub-wavelength structures that can influence the propagation of electromagnetic waves. Most popular effects that can be achieved with metamaterials are a negative index of refraction and the perfect lens1,2. One major drawback for applications is that these effects are often limited to a small frequency range only. In MRI, this is of no great concern since only a narrow band around the targeted resonance frequency at a given field strength is essential. Therefore, different MR-metamaterials have been designed for promising new applications, including µ =-1 lenses, signal-enhancement, and near-field control3-6. In order to be safely applied to humans, the frequency response of these devices needs to be properly characterized in advance, which typically includes EM-Simulations and MRI measurements. However, this can become time-consuming and expensive if an MRI scanner is needed. Here, we present an efficient RF- measurement setup that allows for a precise characterization of the 3D frequency response in terms of complex scattering parameters (S-parameters). The determination of extrema in the dispersion curves is crucial to the understanding of metamaterial-induced signal enhancement and modification for novel applications in MRI.Methods
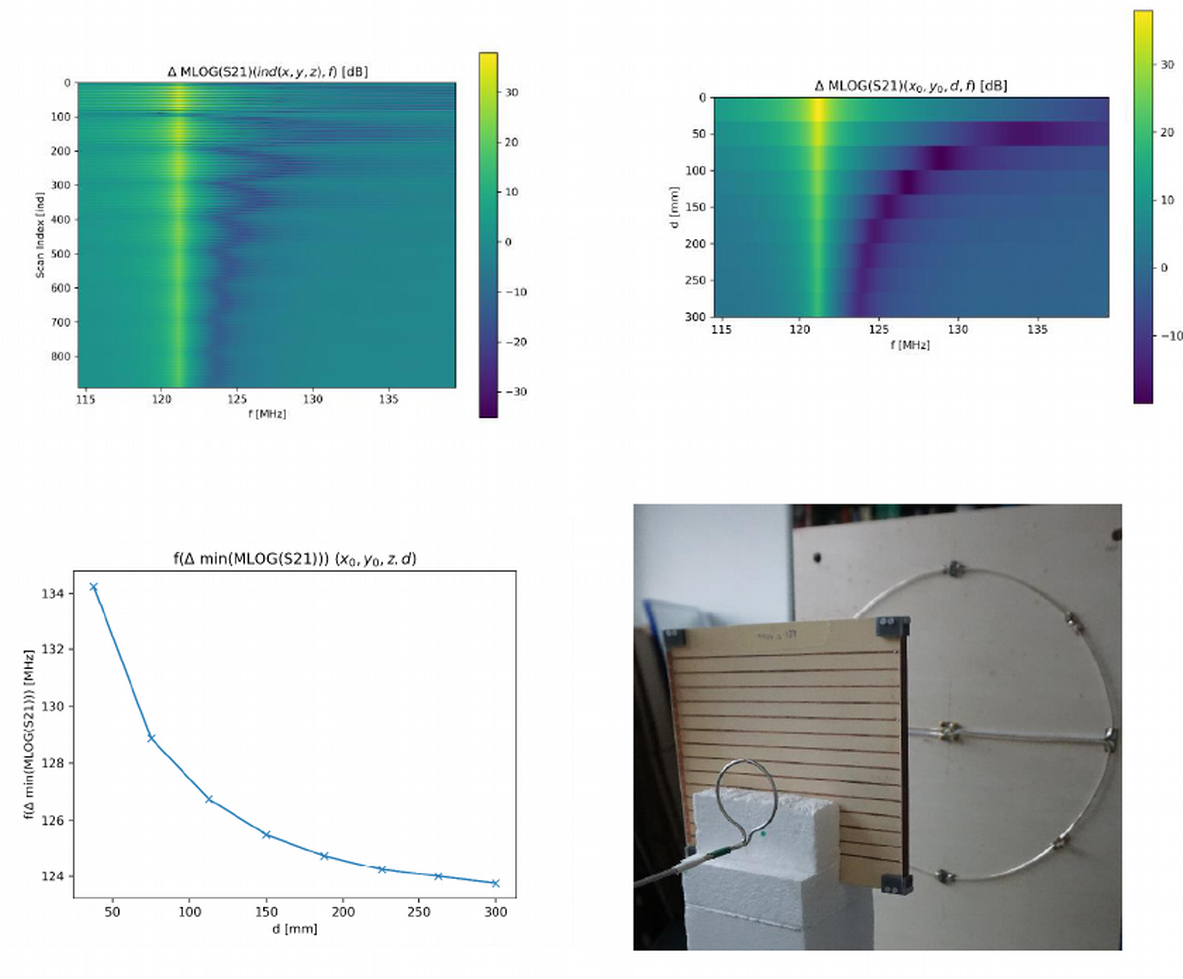
We use a custom build setup (Fig.1) consisting of (i) a dedicated Tx-coil (diameter 30 cm) providing a homogeneous B-field with a resonance frequency around 123 MHz, (ii) a small custom Rx-coil (diameter 4.5 cm) for high spatial resolution, (iii) a highly accurate (2µm) and fast (6.3 mm/s) 3-axis positioning system (SF600, Gampt, Germany) mounted on wooden poles (160 cm height), and (iv) a vector network analyzer (E5061B ENA Keysight, USA) for measuring complex scattering parameters. The entire setup is controlled using self-written Python APIs to the hardware by use of PyVISA7. Complex-valued S-parameter curves can be recorded in a highly automated manner in 3d space. The metamaterial structures under investigation are a magneto-inductive lens8 and a wire-resonator metasurface9. The former is composed of two coupled planar 6x6 arrays of capacitively-loaded copper split-ring resonators milled on FR4 substrate and positioned 11 mm from each other, while the latter is composed of a linear periodic arrangement of capacitively-loaded λ/2 wires. We use CST Studio Suite® (Dassault Systèmes, France) to accompany our measurements with EM-simulations.Results
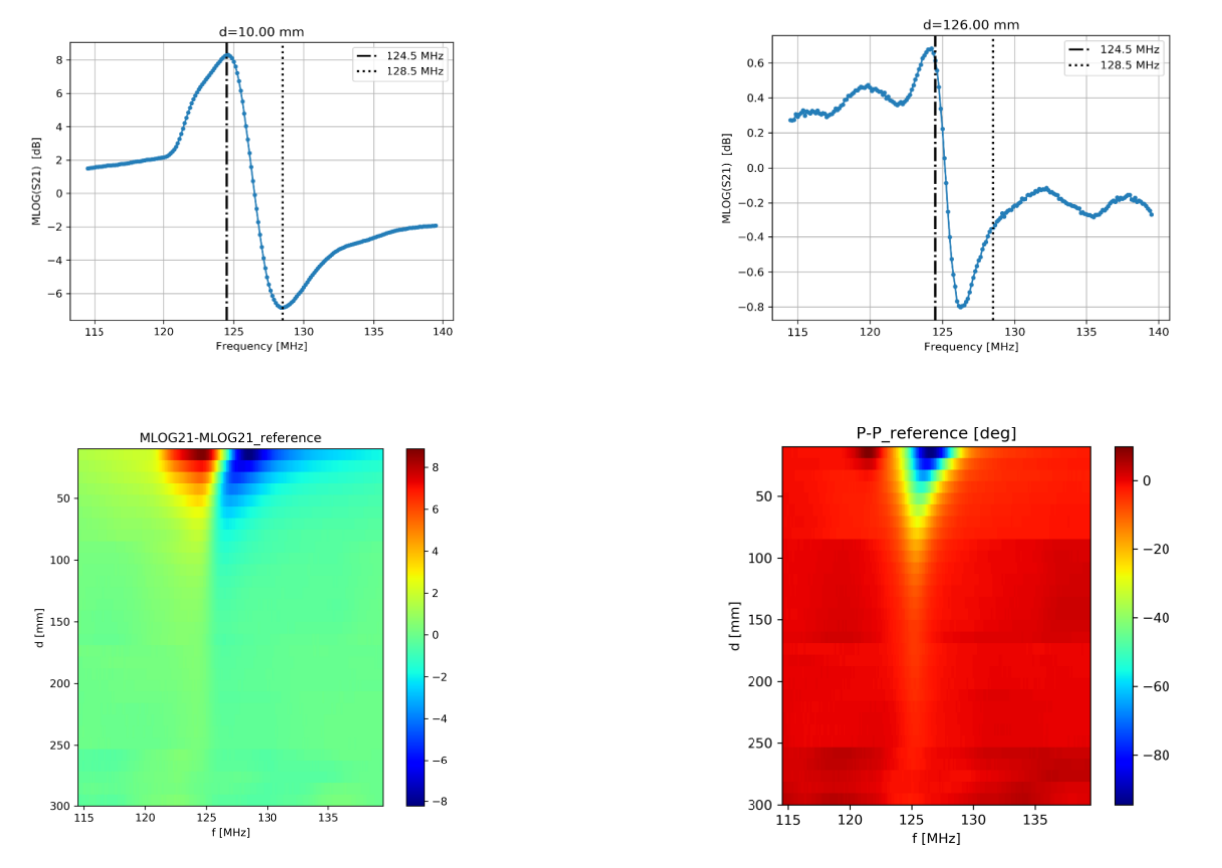
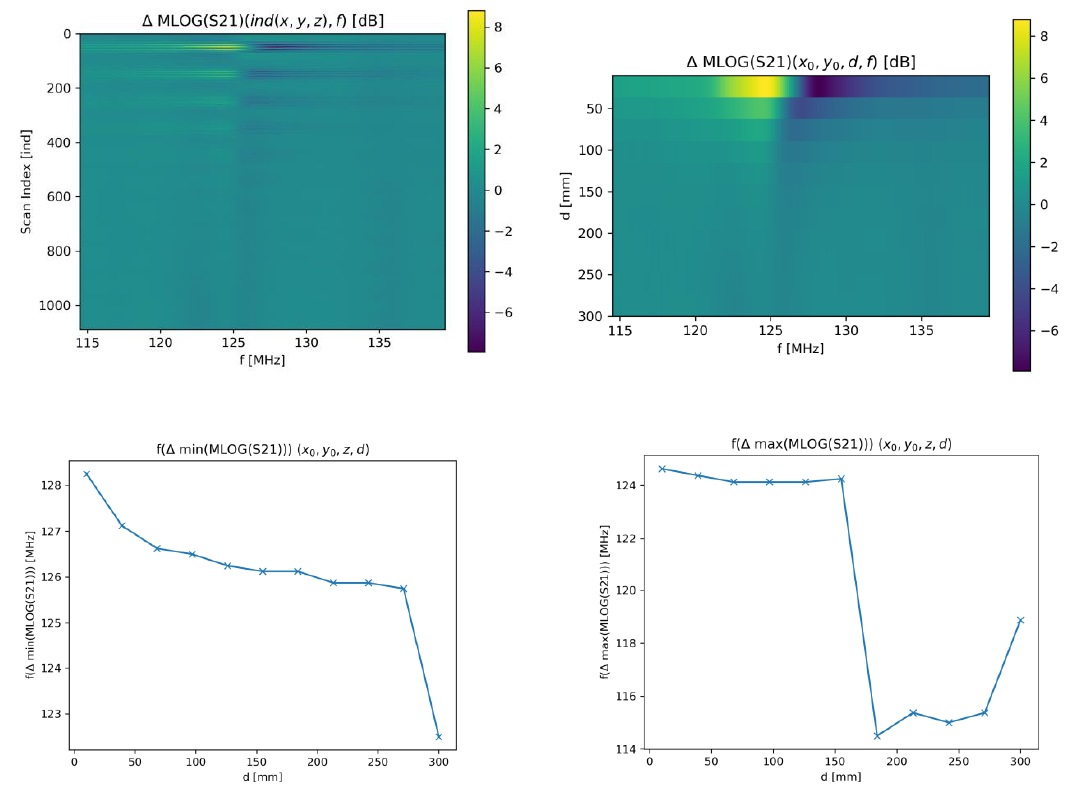
First, we obtain S21-parameter curves with a high sampling density in 3d-space for the two different metamaterials with different resonance frequencies. For the lens (Figs. 2,3) we find a maximum of S21 at 124.5 MHz close to results from simulations (Fig. 4). For the wire-resonator S21 is maximal at 121.5 MHz (Fig. 5). The 3d datasets of Figs. 3,5 cover a volume of about 300x230x180 mm3 with step-sizes of (dx,dy,dz) = (37.5, 23.0,22.5) mm. Fig. 2 shows the dispersion curves in magnitude and phase along the central axis of the Tx-coil with higher spatial sampling. For both samples, we observe a strong positional dependency of the dispersion minima, which shift about 2 MHz and 10 MHz over a distance of 300 mm, respectively. The result is shown in Fig.3 (lens) and Fig. 5 (wire-resonator). As opposed to that, the maxima are only shifted about one MHz or even less over the same distance. In addition, we observe a very strong field enhancement effect of more than 30 dB in magnitude and phase close to its surface.Discussion & Conclusion
Our custom-build coils and the measurement setup allow for investigating different MR-Metamaterials, including a lens and a signal enhancing wire-resonator, at the resonance frequency of a 3T MRI scanner but the approach is easily scalable to other field strengths.To obtain proper dispersion curves, the background signal must be corrected for by subtracting at each position the S-parameter measurement without the metamaterial sample, which we perform in advance. Usually, S-parameter curves are measured after a thru calibration of the network analyzer. However, this procedure basically needs to be done at each position requiring to take out the metamaterial device before each measurement. Our approach is thus much more efficient.
Consequently, the setup allows for faster prototype characterization, smaller feedback times for closed loop design of novel metamaterial devices, and will speed up future optimization processes and the fine tuning of the structures. This is important in the production process of metamaterial devices as it is typically a repetitive design-prototyping-cycle due to small inaccuracies in electronic and material components. In addition, field homogeneity can be assessed in a fast and accurate way, and different modes supported by, e.g., resonators can be analyzed.
Our measurements of the wire-resonator suggest that a comparably high signal enhancement can potentially be achieved in future MRI measurements with slight tuning to the desired resonance. To our knowledge, the observed positional dependency of the dispersion effects has not been included in current MRI measurements using metamaterial samples which, however, should be taken into account for ideal novel approaches of metamaterial-enhanced MR-imaging.
Acknowledgements
This work was supported by the FhG Internal Programs (Grant No. MAVO 142- 600555).References
[1] Pendry, J. B. (2000). Negative refraction makes a perfect lens. Physical review letters, 85(18), 3966.
[2] Smith, D. R., Pendry, J. B., & Wiltshire, M. C. (2004). Metamaterials and negative refractive index. Science, 305(5685), 788-792.
[3] Slobozhanyuk, A. P., Poddubny, A. N., Raaijmakers, A. J., van Den Berg, C. A., Kozachenko, A. V., Dubrovina, I. A., ... & Belov, P. A. (2016). Enhancement of magnetic resonance imaging with metasurfaces. Advanced materials, 28(9), 1832-1838.
[4] Duan, G., Zhao, X., Anderson, S. W., & Zhang, X. (2019). Boosting magnetic resonance imaging signal-to-noise ratio using magnetic metamaterials. Communications Physics, 2(1), 35
[5] Schmidt, R., Slobozhanyuk, A., Belov, P., & Webb, A. (2017). Flexible and compact hybrid metasurfaces for enhanced ultra high field in vivo magnetic resonance imaging. Scientific reports, 7(1), 1678.
[6] Freire, M. J., Marques, R., & Jelinek, L. (2008). Experimental demonstration of a μ=− 1 metamaterial lens for magnetic resonance imaging. Applied Physics Letters, 93(23), 231108.
[7] https://pyvisa.readthedocs.io/en/latest/index.html Accessed November 6th 2019
[8] Algarín, J. M., Freire, M. J., Breuer, F., & Behr, V. C. (2014). Metamaterial magnetoinductive lens performance as a function of field strength. Journal of Magnetic Resonance, 247, 9-14.
[9] Hurshkainen, A., Nikulin, A., Georget, E., Larrat, B., Berrahou, D., Neves, A. L., ... & Glybovski, S. (2018). A novel metamaterial-inspired RF-coil for preclinical dual-nuclei MRI. Scientific reports, 8(1), 9190.
Figures