4067
Active Transmit/Receive Switches for Low Field Magnetic Resonance (<100mT)1Biomedical Engineering, Vanderbilt University, Nashville, TN, United States, 2Vanderbilt University Institute of Imaging Science, Vanderbilt University, Nashville, TN, United States, 3National Institute of Standards and Technology, Boulder, CO, United States, 4Massachusetts General Hospital, A.A. Martinos Center for Biomedical Imaging, Boston, MA, United States, 5Electrical Theory and New Technology, Chongqing University, Chongqing, China, 6Physics, Harvard University, Cambridge, MA, United States
Synopsis
Low-field MRI is of increasing interest due to its low cost, improved safety, portability, and low power requirements. A transmit/receive switch is an essential piece of hardware used to dynamically connect a coil to either the transmitter or receiver. Current low field systems typically use passive crossed-diode TR switches. For RF excitation with small flip angles, there may not be sufficient forward bias voltage to turn on the diodes in passive switches, which limits fast imaging and MR fingerprinting. In this study we evaluate alternative active T/R switches for low power experiments and compare them, at 6.7 and 30 mT.
Purpose
Very low field MRI (<100mT) [1] is of increasing interest due to its low cost, improved safety, portability, and low power requirements [2,3,4]. A TR (transmit/receive) switch is an essential piece of hardware used to dynamically connect a coil to either the transmitter or receiver [5]. At higher frequencies, positive-intrinsic-negative (PIN) diodes are effective switches and widely used. However, at lower frequencies their carrier lifetime is problematic [6,7], so current low field systems typically use passive crossed-diode TR switches. For RF excitation with small flip angles, there may not be sufficient forward bias voltage to turn on the diodes in passive switches, which limits fast imaging and MR fingerprinting [8]. In addition, silicon diodes apply amplitude-dependent phase shifts when insufficiently powered. In this study we evaluate alternative active mechanical and electrical TR switches for low power experiments and compare them to a classic passive TR switch, at 6.7 and 30 mT.Methods
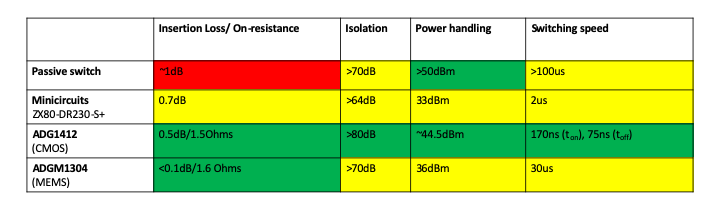
Switch Characteristics:Fig 1 lists the TR switches we evaluated and compares them in terms of the most important TR switch characteristics: insertion loss/on-resistance, power handling, isolation, and switching speed. In this work we evaluated a conventional passive TR switch, a low voltage MEMS device (ADGM1304), a complementary metal-oxide semiconductor (CMOS) switch (ADG1412), and a commercial electrical switch (Minicircuits). Micro-electromechanical switches (MEMS) have high isolation because the leads are physically disconnected, but have a slower switching speed because a plate must be moved from one position to another. We did the same experiment with the MEMS switch in both a single and a parallel state to test the improved isolation and power performance. In comparison, electrical switches have high switching speed and low insertion loss but can suffer from frequency limits and power handling issues.
NMR Experiments:
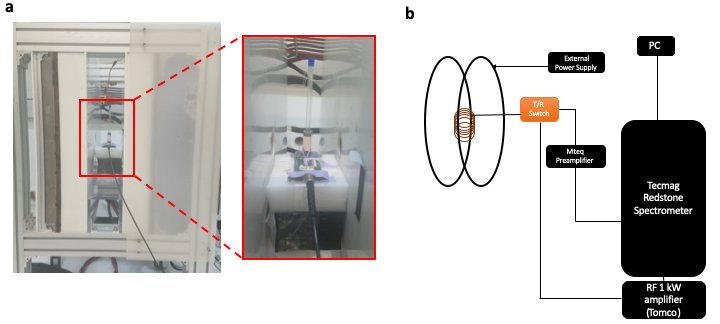
F1 (RF power) calibrations and loopback tests were performed and evaluated at 6.7 mT (288 kHz) and 30 mT (1.28 MHz) using a variable field, BFM-OC (Resonance Research Inc, Billerica, MA, USA) electromagnet, a Tecmag Redstone (Houston, TX,USA), and a 1kW Tomco RF amplifier (Stepney, South Australia). Shown in Fig 2a, we used a 50-turn 2 layer litz wire-wound solenoid (ID=10mm, Q =24) changing the tune/match board for each frequency. The overall system design is shown in Fig 2b.
Results and Discussion
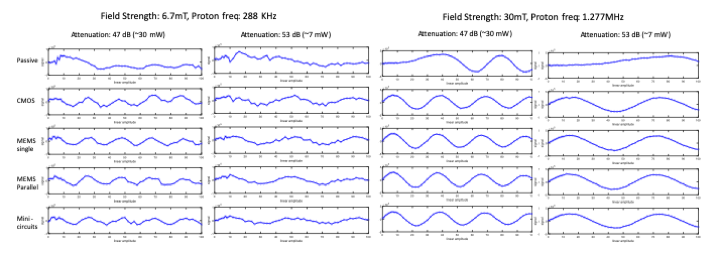
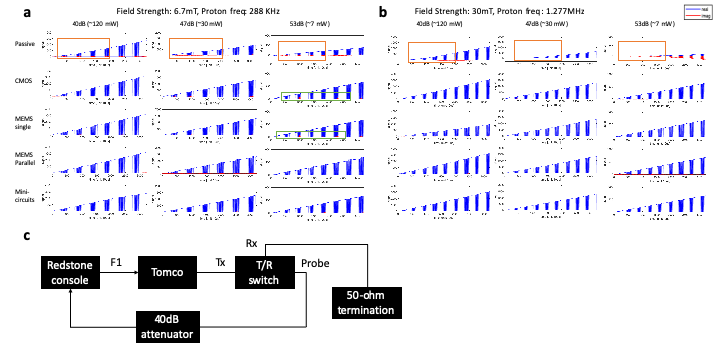
As shown in Fig 3 and Fig 4, the MEMS and CMOS switches outperformed the conventional passive TR switch with regards to low flip angle calibrations, power loss, and phase dependencies. Using low powers, 47dB and 53dB attenuations (~7/30 mWatts), the nutation curves show the 90 degree flip angle keeping the power constant. The passive TR switch uses much more power to get to 90 degrees while the active TR switches reach 90 degrees within a fraction of that time. The plots clearly show that the passive switch doesn’t perform well until reaching a power threshold, seen by zero values at low amplitudes in the nutation curves. Both 30mW and 7mW powers are used to clearly display the power needed to reach the 90 degree flip and then the following flip angles to monitor the amplitude of the 270 in comparison to the 90 (Fig3 47dB plots). For lower frequencies, the amplitude of the passive switch at 270 degrees is much lower than the 90 degree amplitude. The commercial active TR switch performs similarly to the MEMS and CMOS solutions at 30mT but falls short at 6.7mT where it has more loss than the parallel MEMS (41,370 compared to 33,530 for signal magnitude) (Fig 3a). Fig 4 demonstrates that none of the active TR switches have a phase dependency compared to the passive switch which shows a phase roll near the diode threshold. The loopback tests were performed for all switches at 6.7 and 30mT validating the consistency through the kHz and low MHz frequency regime.Conclusion
We have demonstrated the benefits of using an active TR switch with either a MEMS device or CMOS instead of the conventional passive TR switch. We have also compared these solutions to a commercial active TR solution to show better power handling and less loss. Both the MEMS and CMOS have improved nutation curves at low flip angles and overall require less power than a passive TR switch. Additionally, when using a parallel MEMS solution, the insertion loss is lower than a commercial active TR solution.Acknowledgements
This work was supported by NIH Grant U01 EB 025162, NIH Grant R01 EB 016695, and the ARPA-E ROOTS (Rhizosphere Observations Optimizing Terrestrial Sequestration) project.References
1. Geethanath, S., & Vaughan Jr, J. T. (2019). Accessible magnetic resonance imaging: a review. Journal of Magnetic Resonance Imaging, 49(7), e65-e77.
2. Marques, J. P., Simonis, F. F., & Webb, A. G. (2019). Low‐field MRI: An MR physics perspective. Journal of magnetic resonance imaging, 49(6), 1528-1542.
3. Sarracanie, M., LaPierre, C. D., Salameh, N., Waddington, D. E., Witzel, T., & Rosen, M. S. (2015). Low-cost high-performance MRI. Scientific reports, 5, 15177.
4. Wald, L. L., McDaniel, P. C., Witzel, T., Stockmann, J. P., & Cooley, C. Z. (2019). Low‐cost and portable MRI. Journal of Magnetic Resonance Imaging.
5. Fukushima, E. (2018). Experimental pulse NMR: a nuts and bolts approach. CRC Press.
6. Caverly, R. H., & Hiller, G. (1989). The frequency-dependent impedance of pin diodes. IEEE transactions on microwave theory and techniques, 37(4), 787-790.
7. Hoffmann, A., & Schuster, K. (1964). An experimental determination of the carrier lifetime in pin diodes from the stored carrier charge. Solid-State Electronics, 7(10), 717-724.
8. Ma, D., Gulani, V., Seiberlich, N., Liu, K., Sunshine, J. L., Duerk, J. L., & Griswold, M. A. (2013). Magnetic resonance fingerprinting. Nature, 495(7440), 187.
Figures