4048
Sensitivity Enhancement at 7T Brain MR imaging Using Wireless Coupled-Split-Ring-Resonators Array1Biomedical Engineering and Imaging Institute, Icahn School of Medicine at Mount Sinai, New York, NY, United States, 2Siemens Medical Solutions USA, Inc, New York, NY, United States
Synopsis
Image quality in the brain periphery at ultra high field MRI is severely limited by low sensitivity. In this work we illustrate an efficient method for enhancing imaging sensitivity at 7T in a cadaver brain. The method is based on the application of a wireless coupled-split-ring-resonator array that amplifies the MR signal during acquisition, which can alleviate the low sensitivity problem in the brain periphery when low flip angle and low SAR sequences are needed. Initial ex-vivo 7T MR brain imaging results showed that 2-fold to 6-fold SNR gain was obtained using this array.
Purpose
To improve the signal sensitivity in the brain on 7T MRI systems by wireless signal amplification during the reception.Introduction
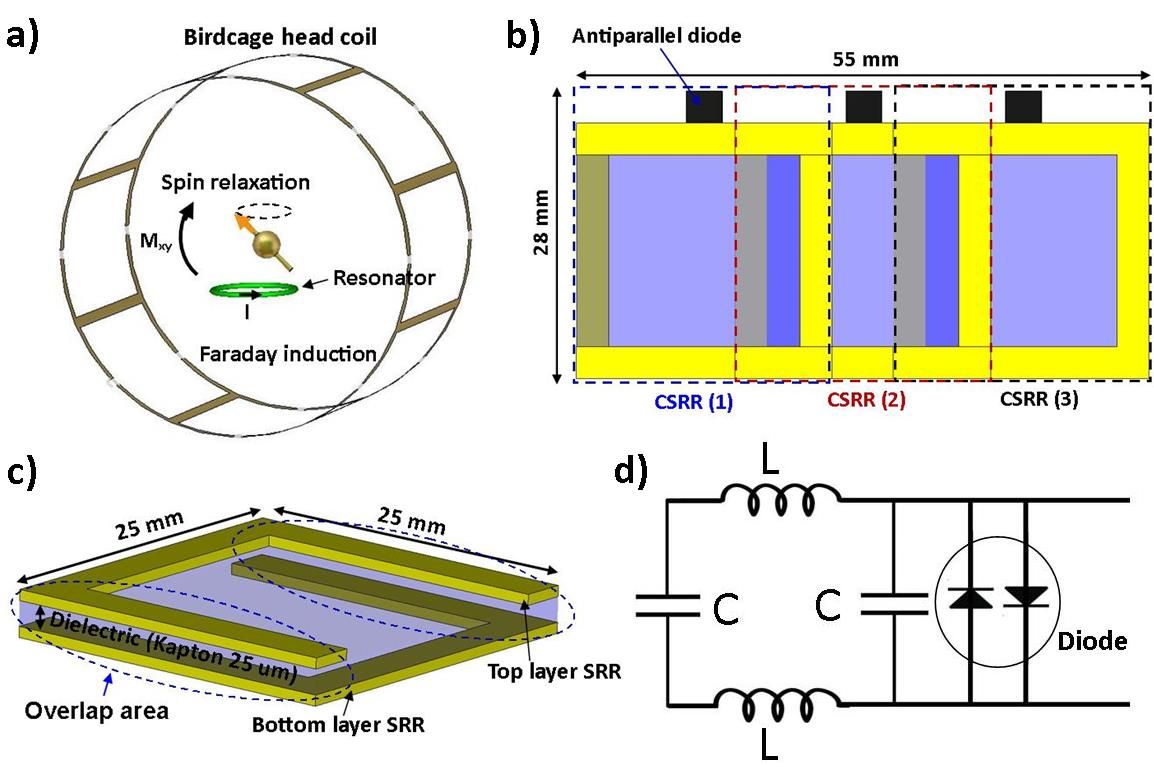
In MR imaging, SNR plays a critical role in spatial resolution, image quality, and acquisition time. Experimental results demonstrate approximately linear SNR increase with a static magnetic field strength up to 4T.1 However, SNR becomes complex when stronger magnetic fields (> 4T) are considered. A comparison of 3T and 7T data obtained under the same imaging parameters shows an SNR increase by factor of 2 at the center of the head, but significantly lower gain at the periphery at 7T.1,2 This non-uniform SNR enhancement results from the inhomogeneous B1 field (due to the wavelength effect) in a volume head coil, which is more conspicuous at 7T. To improve the receive sensitivity at the periphery, we developed a wireless, passive, and flexible RF array. The proposed array can be placed near the area of interest without need for wired connection to the scanner. The array amplifies the signal at its covered area during reception, based on the concept of Faraday’s law of induction (Fig.1a). To prevent B1 field distortion and alleviate potential safety concerns, the array was decoupled from RF transmission. This array is intended to be utilized with very low flip angle and low SAR sequences at 7T to improve SNR gain (2 to 6 times in ex-vivo).Method
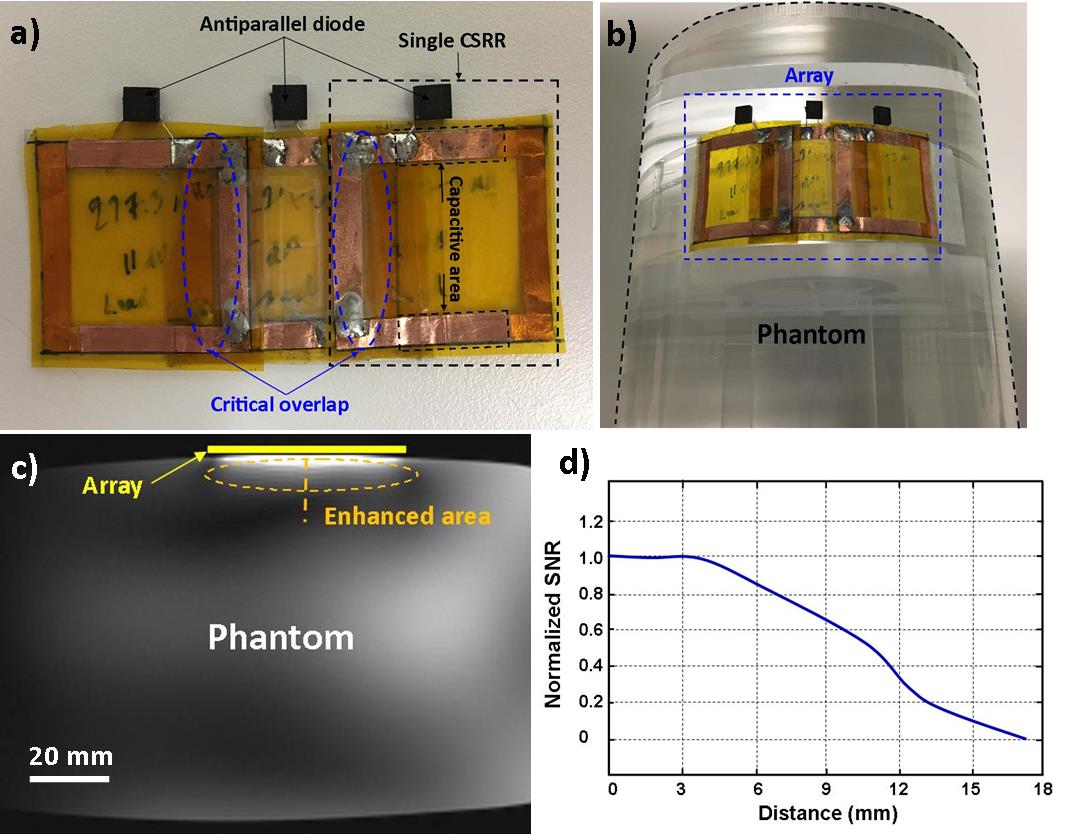
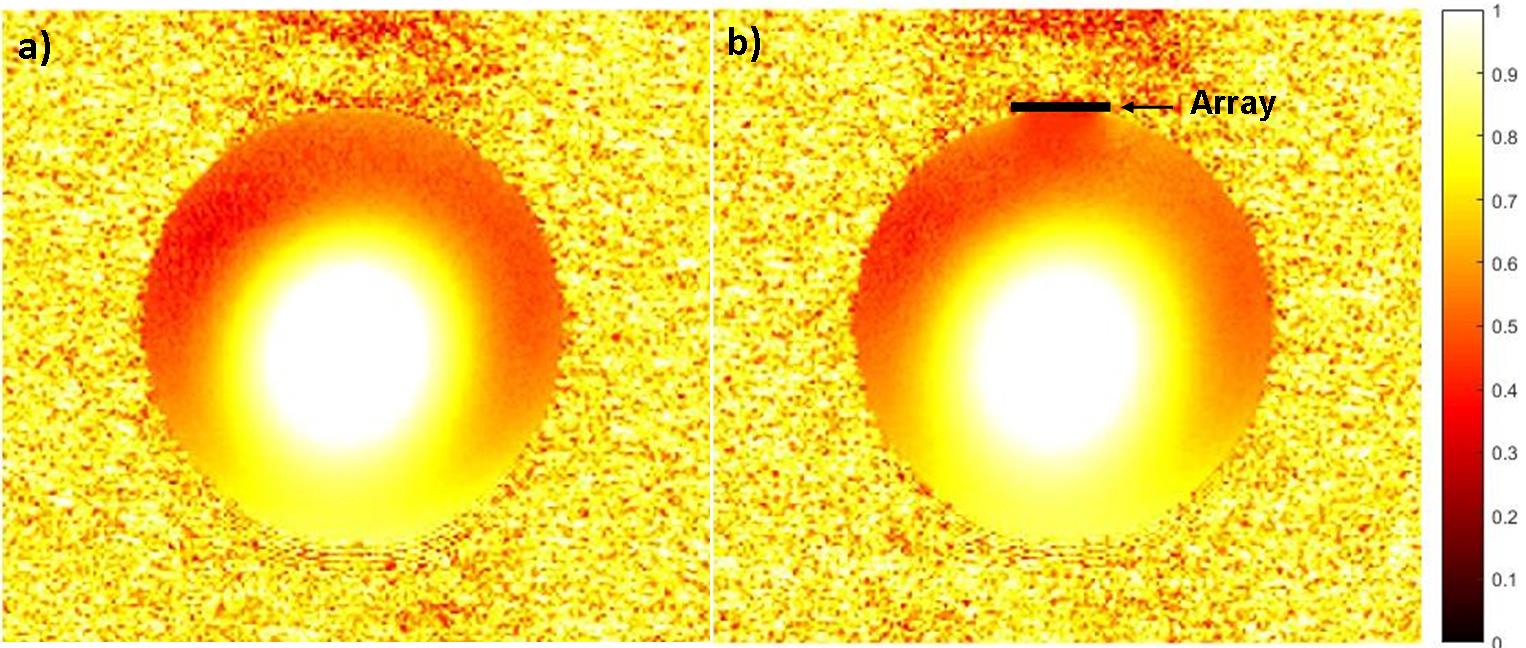
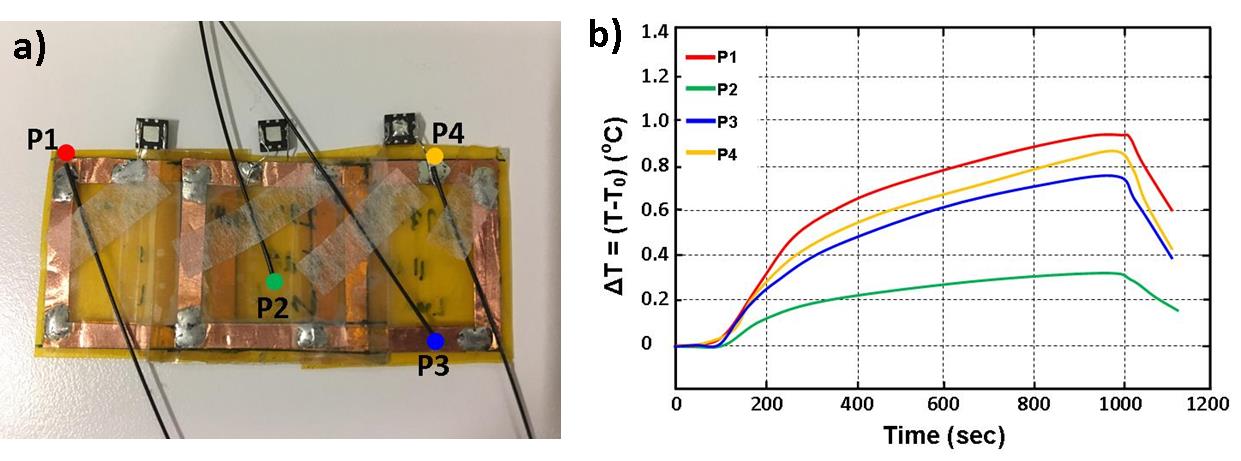
The proposed array consists of three coupled-split-ring resonators3 (CSRR) tuned to the Larmor frequency (297 MHz) of a 7T MR scanner (MAGNETOM 7T, Siemens Healthcare, Erlangen, Germany). The total dimension of the array is 5.5×2.8 cm2 with each CSRR dimension of 2.5×2.8 cm2 (Fig.1b). Electromagnetic simulation (CST, Germany) was used to evaluate and optimize the effect of the design parameters. The CSSR is a multi-layer structure; the first layer is an SRR etched copper on a 25 μm thick flexible substrate (Kapton), then after the CSRR was completed by etching the second 180°-rotated SRR layer on the other side of the substrate (Fig.1c). When tuning a resonator, it is desirable to control the capacitance to reach the Larmor frequencies.4 In this design the overlap area between two SRRs can control the capacitance. The equivalent electric circuit model of a single CSRR is shown in figure 1d. All CSRRs electrical characteristics were measured in the phantom via an Agilent E5061B network analyzer. The decoupling among the elements was addressed with critical overlap (Fig.2a). The RF and imaging safety was provided by decoupling the resonators from RF excitation using antiparallel PIN diodes (Macom). CSRRs are only coupled during reception to amplify the receive signal. B1 map was calculated on the phantom (CuSo4 solution) to determine the B1 field distribution in the vicinity of the array using double angle method.5 Electromagnetic simulation was performed to evaluate SAR distribution in a gel phantom to identify SAR hotspots. Temperature measurement was measured in the vicinity of the array in the gel phantom (dielectric constant = 70; heat capacity = 4454 J/(kg·K); conductivity = 0.65 S/m) under 15-min high SAR MR sequences (GRE: TR/TE=2.6/1.5 ms, flip angle=5°, slice thickness=10 mm, slice number=2 mm, FOV=220×220 mm2, average=32) to analyze the RF safety. The phantom and ex-vivo MR experiments were performed to evaluate the array imaging performance by characterizing image SNR. The flexible and thin structure of the array allow it to be placed on the curved surfaces (Fig.2b). All images were obtained on a 7T MR scanner (MAGNETOM 7T, Siemens Healthcare, Erlangen, Germany) using a single-channel transmitter and 32-channel receiver head coil. GRE (TR/TE =250/10 ms, flip angle=1°, Matrix size=256×256, slice thickness=3 mm, FOV=180×180 mm2) and inversion recovery (TR/TE/IR =2000/3.3/300 ms, flip angle=8°, Matrix size=256×256, slice thickness 3 mm, FOV=180×180 mm2) sequences were used to acquire images with/without the array for comparison.Results
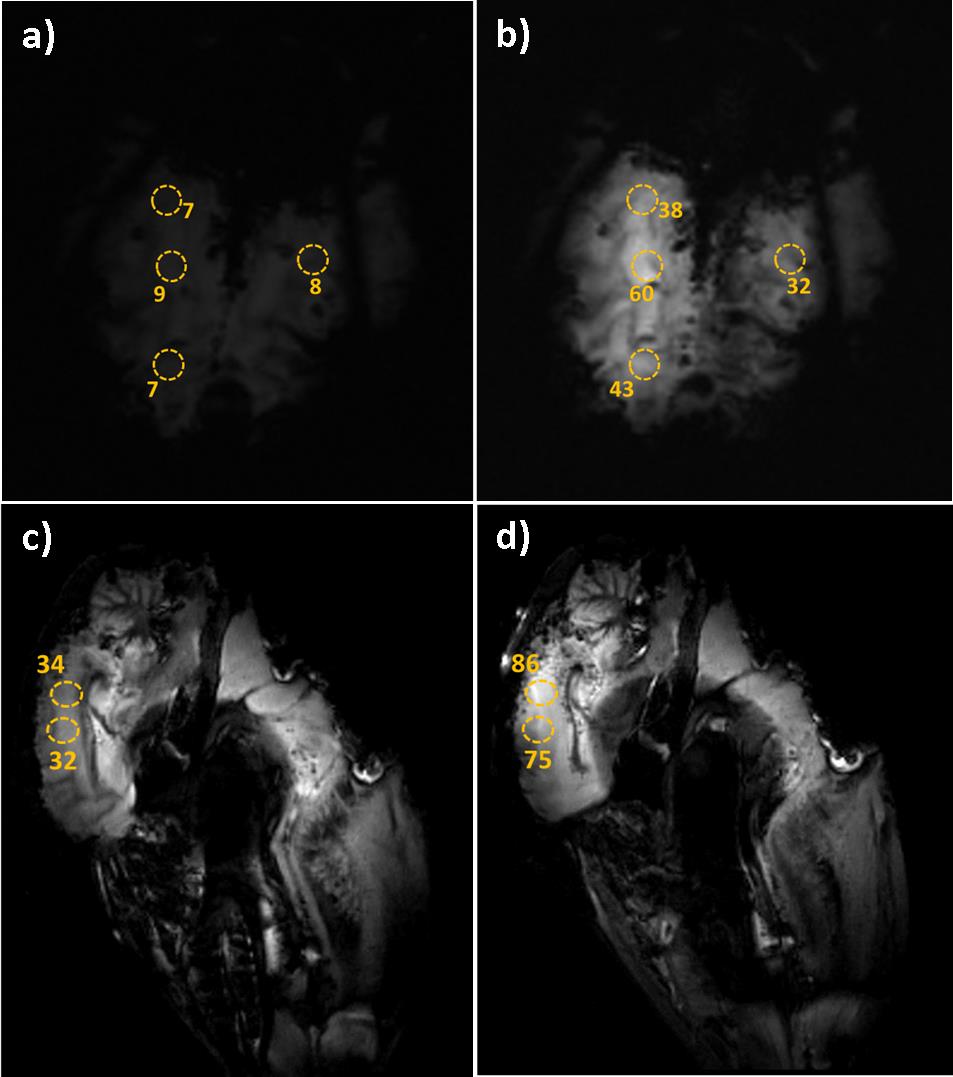
The GRE phantom image shows the enhanced SNR area (dashed ellipse) (Fig.2c); the corresponding 1D SNR profile along the dashed line indicates 8-fold SNR gain in the array vicinity (Fig.2d), while moving away from the array the enhancement is decreased. The B1 map analysis displays a negligible B1 field magnitude distortion in the vicinity of the array (Fig.3). This distortion can be explained by the fringing effect of the induced current on the array during the RF transmission. Temperature measurement recorded by the fiber optic temperature probes (Fig.4a) reported maximum temperature rise (ΔT) of 0.9 °C with respect to the reference point (Fig.4b). Ex-vivo MR images acquired with/without the array show that the highest SNR enhancement of 6-fold and 2-fold were calculated in GRE and inversion recovery ex-vivo images, respectively.Conclusion
A method of enhancing SNR is proposed and experimentally demonstrated on a 7T MR system. By positioning an array of resonators near an imaging sample, SNR of the MR signal can be amplified significantly in the area covered by the array. This method can provide a solution for the low SNR problem at the brain periphery at high fields. The ex-vivo experimental results showed an SNR gain up to 6-fold obtained using the proposed device. Future work can be focused on increasing the area of interest by increasing the number of elements for the purpose of human imaging.Acknowledgements
Authors would like to thank Derek Smith for his scientific discussion.References
1. Ugurbil K, Auerbach E, Moeller S, et al. Brain imaging with improved acceleration and SNR at 7 Tesla obtained with 64‐channel receive array. Magn Reson Med., 2019;82:495–509.
2. Verma G, Balchandani P. Ultrahigh field MR Neuroimaging. Topics in Magnetic Resonance Imaging., 2019;28:137-144.
3. Marqués R, Francisco M, Jesus M, Francisco M. Comparative analysis of edge- and broadside- coupled split ring resonators for metamaterial design - theory and experiments. IEEE Transaction on Antenna and Propagation., 2003;51:2572-2581.
4. Alipour A , Gokyar S , Algin O, Atalar E, Demir H V., An inductively coupled ultra‐thin, flexible, and passive RF resonator for MRI marking and guiding purposes: Clinical feasibility. Magn. Reson. Med., 2017;80: 361-370.
5. Hornak J, Szumowski J, Bryant R. Magnetic field mapping. MagnReson Med 1987;6:158–163.
Figures