4035
Signal-to-noise measurement of a 4-channel parallel radiofrequency transmission system for MRI at 3 T1Physical Sciences, Sunnybrook Research Institute, Toronto, ON, Canada, 2Electrical and Computer Engineering, McMaster University, Hamilton, ON, Canada, 3Medical Biophysics, University of Toronto, Toronto, ON, Canada
Synopsis
Parallel radiofrequency transmission (pTx) is a highly researched topic. As a result, researchers have implemented different in-house system designs to investigate its clinical benefits. The performance specifications of these custom systems are often unknown. Signal-to-noise (SNR) ratio analysis is an important consideration for optimal imaging. This work uses a simple multi-purpose method to conduct SNR analysis and noise characterization of a 4-channel pTx system integrated on an existing 3 T MRI system.
Introduction
Parallel radiofrequency transmission (pTx) system implementations have grown steadily in the last decade1,2,3. At present, some commercial systems are available for research; however, in-house designs remain a relevant alternative not only from a cost perspective, but also because optimal channel counts and optimal pTx methods for different clinical applications are still under investigation. Often, in-house pTx systems are assembled with commercial and in-house designed components that can require additional measurements to determine certain system characteristics. Although most measurements can be performed “on the bench,” it is advantageous to conduct measurements during imaging for better accuracy and improved insight about true system behaviour, as some MRI applications (e.g. reduced field-of-view imaging) are more sensitive to pTx system uncertainties. In particular, signal-to-noise ratio (SNR) analysis of pTx systems is an important consideration to maximize performance. This work uses a simple multi-purpose method to conduct SNR analysis and noise characterization of a 4-channel pTx system integrated on an existing 3 T MRI system.Theory
The signal-to-noise ratio is defined as: $$SNR = signal power / noise power$$The noise factor, F, is defined as: $$F = SNRin / SNRout$$
where SNRin is the ratio of radiofrequency (RF) signal and noise power at the input of the device under test for a frequency of interest, and SNRout is the analogous ratio at the output. F is commonly expressed in decibels (dB) as the noise figure (NF) and it is then defined as, $$NF = 10·log(F).$$
Methods
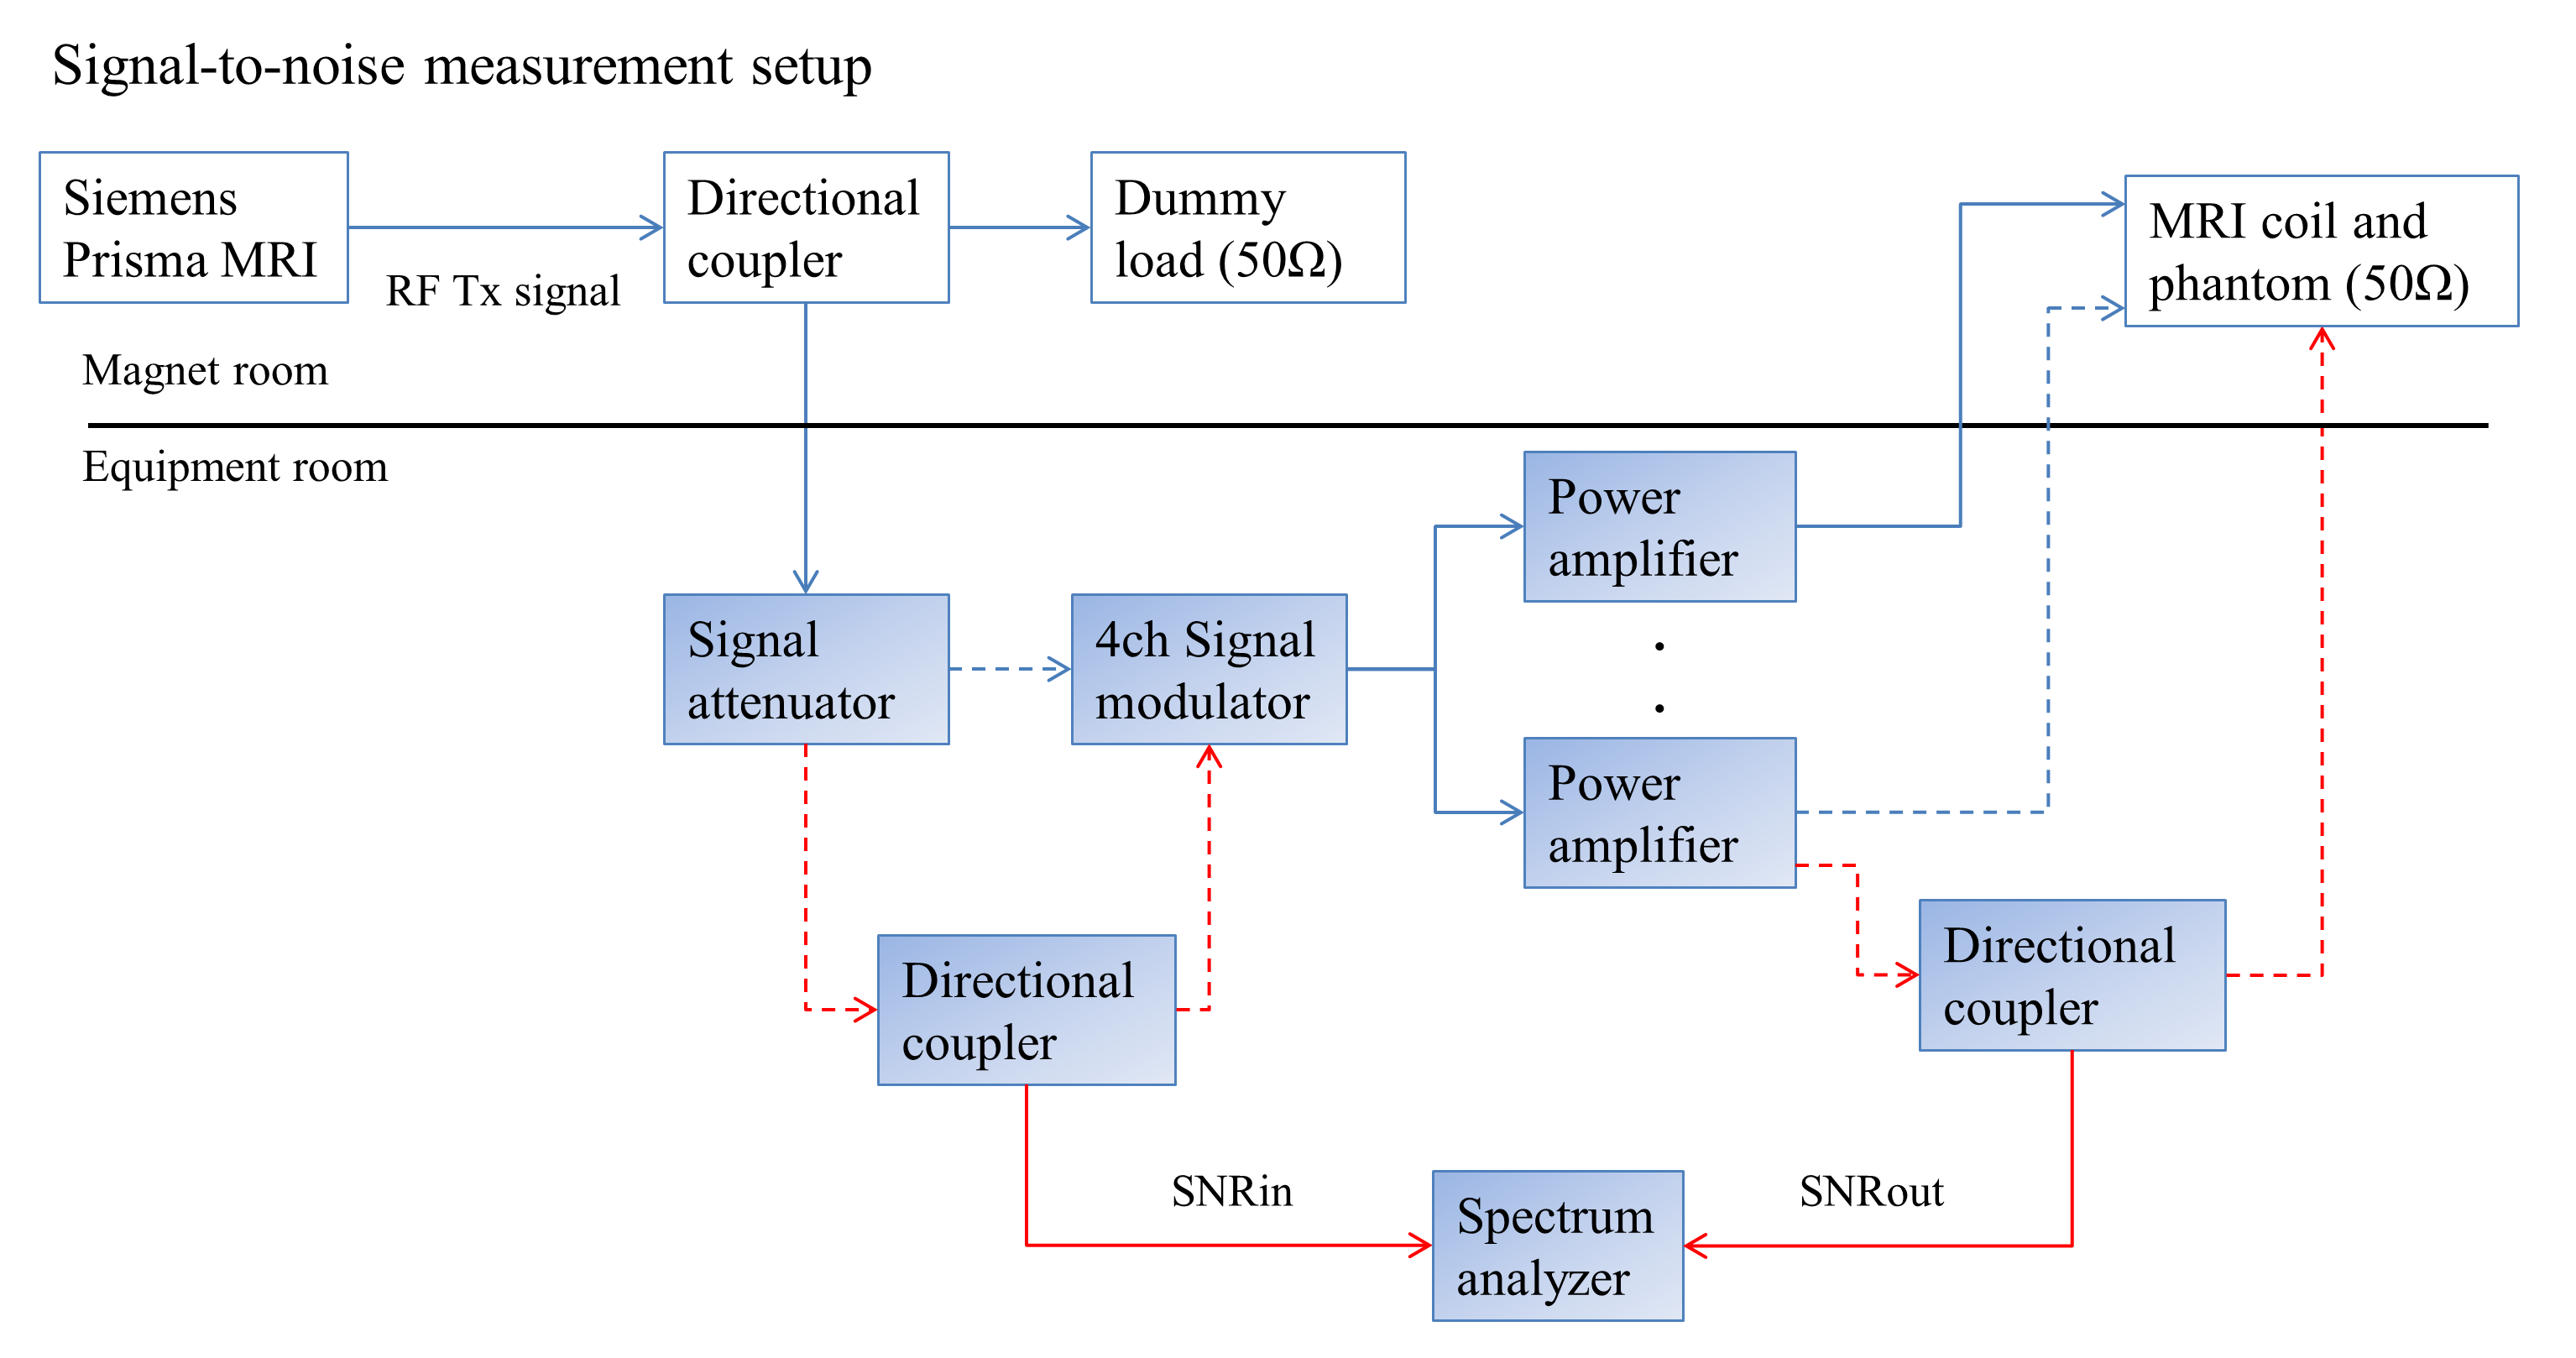
To measure SNR of our 4-channel pTx system3 that is integrated on an existing 3 T MRI system (Magnetom Prisma, Siemens), RF directional couplers (C5497-13 / C7008-102, Werlatone, Patterson, NY) were inserted into the RF transmission pathway as shown in Fig. 1. Normal operation of the MRI system is possible because of the insertion of the dummy load inside the magnet room, enabling RF excitation using the pTx system3. Using a spectrum analyzer (N9010A, Keysight Technologies, Santa Rosa, CA) both signal and noise power were measured for a specified bandwidth of 51 kHz, such that SNRin and SNRout were determined separately at different reference points. Corresponding values for F and NF can then be calculated using the above equations. All measurements were performed during gradient-echo imaging (repetition time=2000 ms, echo time=2.46 ms, flip angle=60°, slice thickness=5 mm, field-of-view=220 mm) of a uniform poly-acrylic acid phantom (conductivity=~0.47 S/m; relative permittivity=~80), with 4-channel pTx in quadrature mode (90⁰ phase offset between RF pulses submitted on successive channels).Results
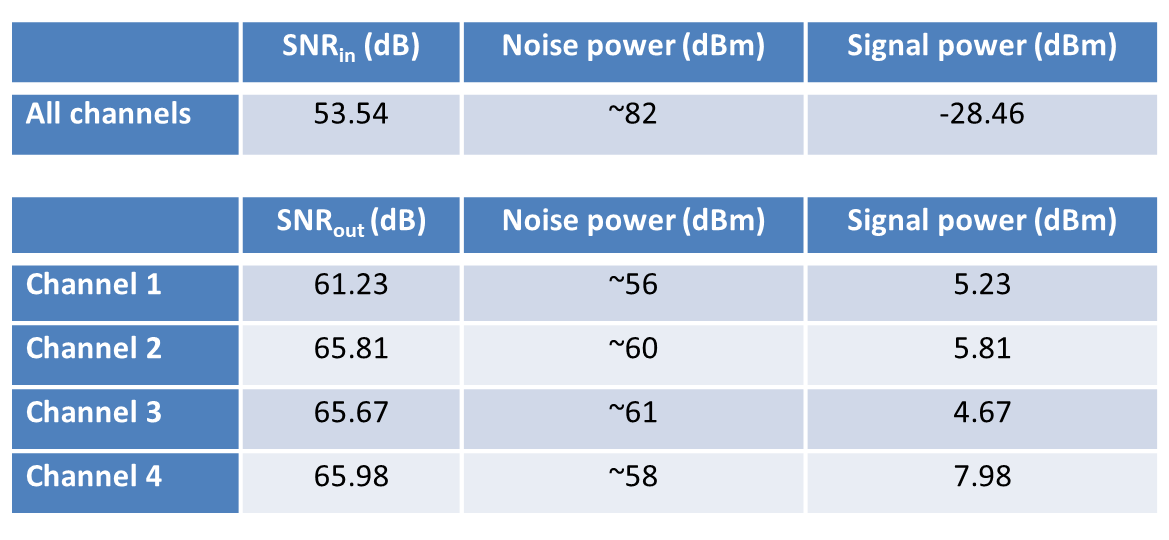
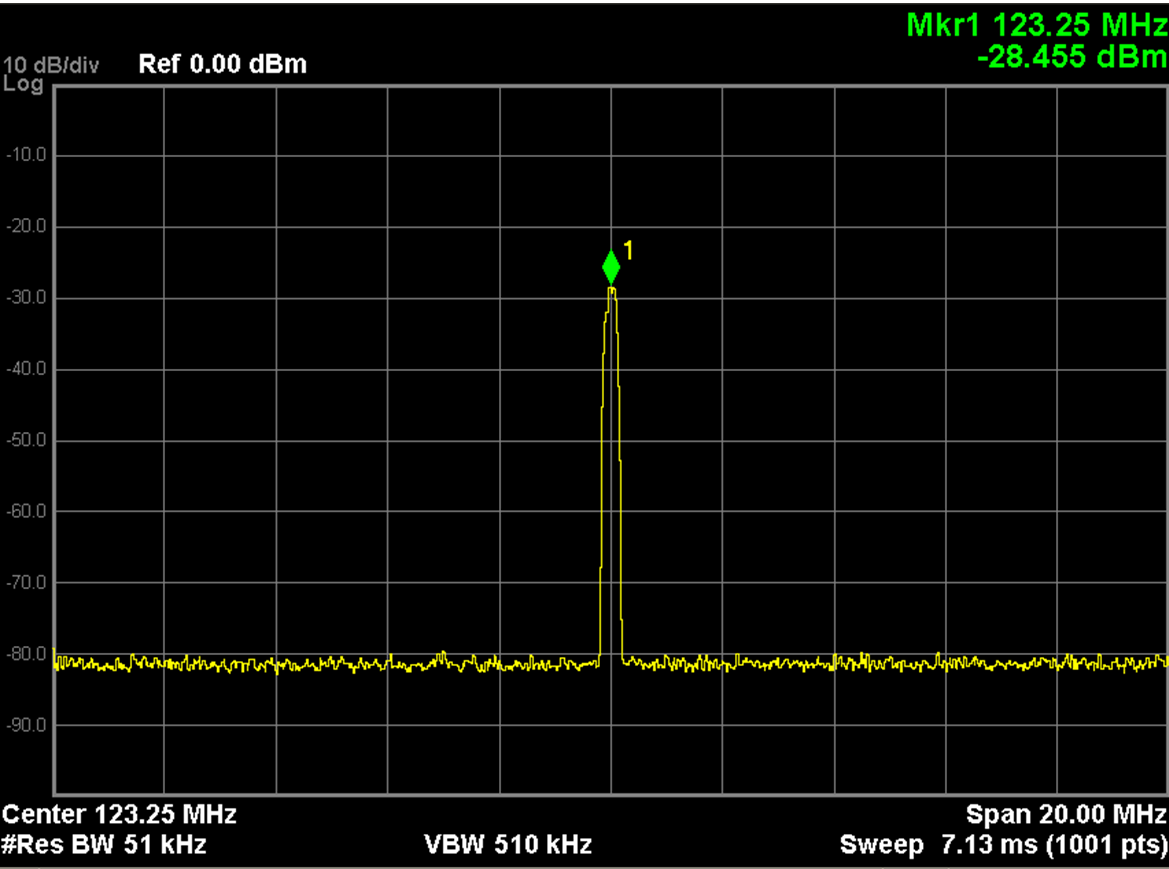
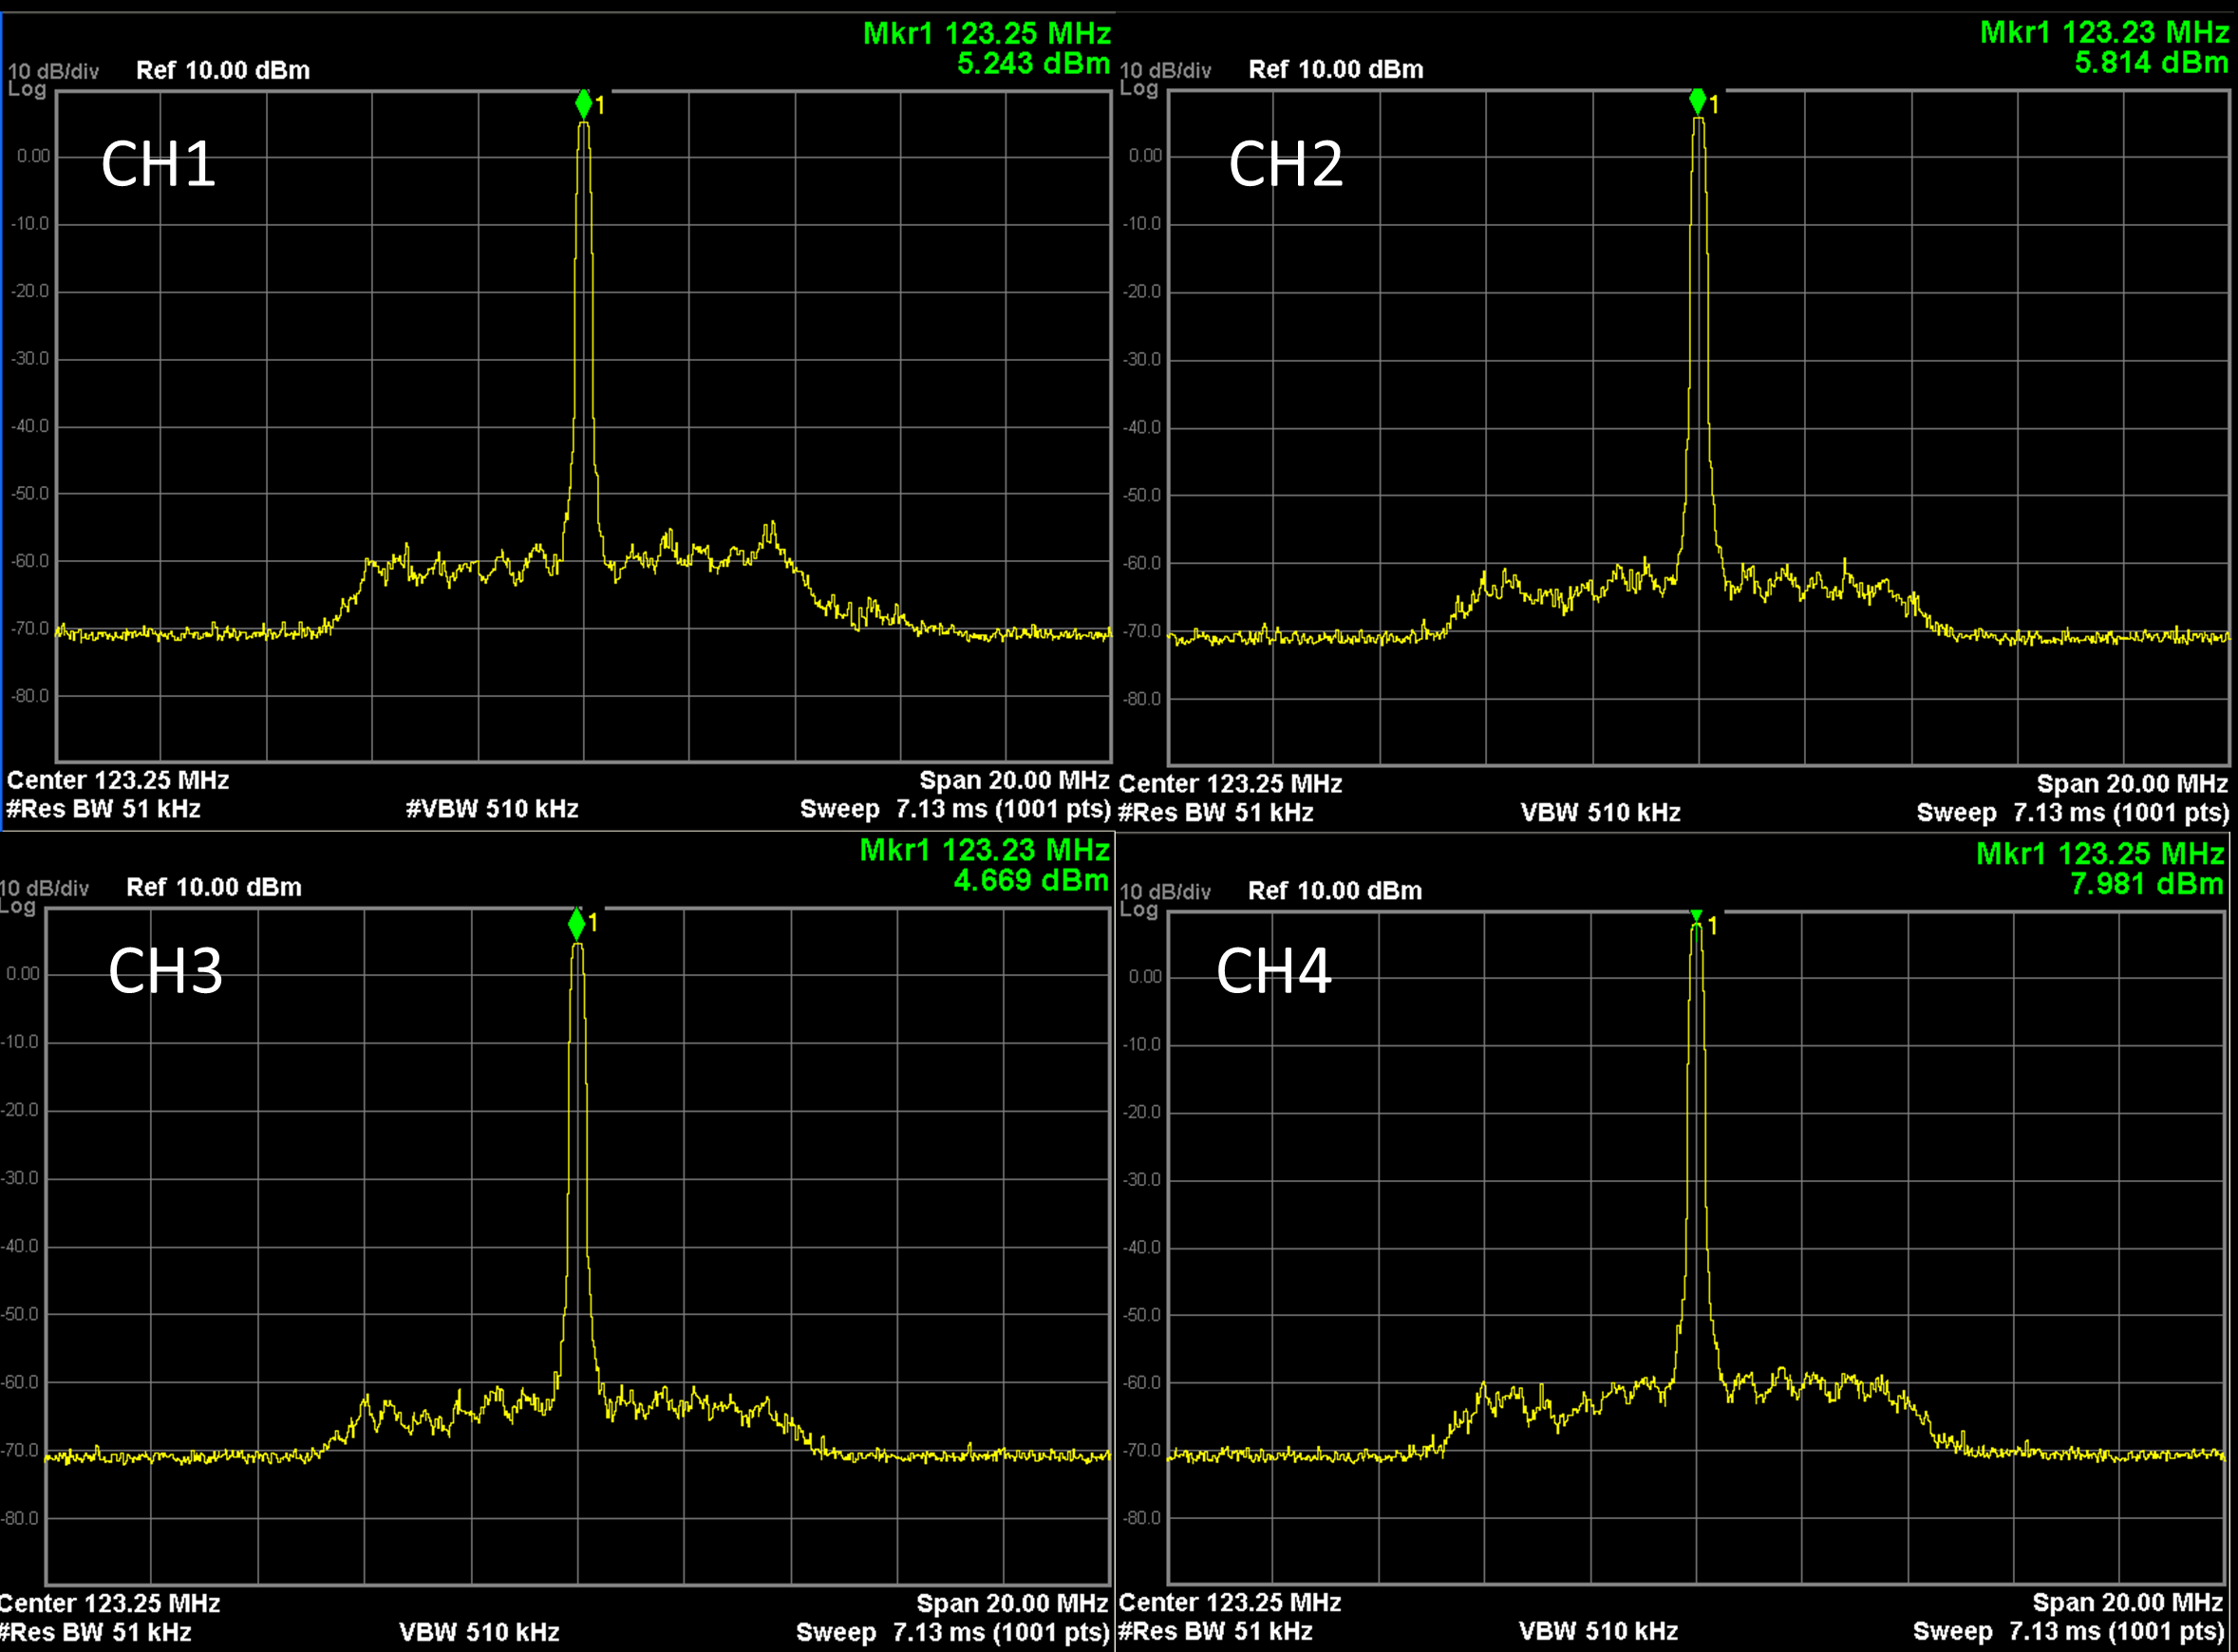
SNR measurement results are reported in Fig. 2. For additional context, Fig. 3 displays a sample screen capture on the spectrum analyzer at the input of the signal modulator and Fig. 4 displays sample screen captures on the spectrum analyzer at the output of each RF power amplifier (RFPA).Discussion and Conclusion
Using the above equations, the NF of each pTx channel can be calculated, however on closer inspection, it is believed that the full signal spectrum was not captured in Fig. 3 and requires further analysis. Small-signal measurement can be difficult. Nonetheless, Fig. 4 provided a number of useful observations; overall system noise appears to have increased and channel-to-channel variation in signal and noise power was observed. This channel-to-channel system behaviour is likely to change for different pTx-MRI imaging conditions; a challenge for benchtop procedures to replicate. Therefore, this measurement setup offers many advantages. For example, a real-time calibration procedure can be implemented to adjust output signals (e.g. for undesired channel-to-channel variation) for optimal imaging, similar to pre-scan routines on commercial systems. Other uses include real-time power and specific absorption rate monitoring and noise characterization of specific devices (e.g. signal modulator or RFPA). In conclusion, a useful multi-purpose measurement setup was used to further characterize our 4-channel pTx-MRI system. Additional system measurements are planned prior to the conference proceedings.Acknowledgements
Special thanks to Fred Tam for the helpful discussion.References
[1] Tweig et al., “A 16 channel head-only pTx array using high efficiency in-bore RFPAs at 3T.” ISMRM 2017.
[2] Filci et al., “Prototype hardware of FPGA controlled multi-channel all-digital RF transmitter for parallel magnetic resonance imaging.” ISMRM 2017.
[3] Yang et al., “A Platform for 4‑Channel Parallel Transmission MRI at 3 T: Demonstration of Reduced Radiofrequency Heating in a Test Object Containing an Implanted Wire.” J Med Biol Eng. 2019.
Figures