4026
Developing High Channel Count Receive Arrays for Human Brain Imaging at 10.5T1Center for Magnetic Resonance Research (CMRR), University of Minnesota Twin Cities, Minneapolis, MN, United States, 2Department of Biomedical Engineering, University of Minnesota Twin Cities, Minneapolis, MN, United States, 3Centre for Cognitive Neuroimaging, University of Glasgow, Glasgow, Scotland
Synopsis
Highly decorrelated, high channel count receive arrays are a prerequisite to capturing the signal-to-noise ratio and acceleration performance potential of ultra-high field MRI. A self-decoupled 32-channel receive array was built for human brain imaging at 10.5T. Noise correlation and signal-to-noise ratio (SNR) of the RF coil were measured in phantom experiments at 10.5T. SNR was compared to a commercial 32-channel receiver array at 7T. Noise correlation matrices demonstrated effective decoupling of receive elements. Experimental SNR measurements demonstrated on average 60% higher overall SNR at 10.5T compared to 7T.
Introduction
Ultra-high field (UHF) magnetic resonance imaging (MRI) increased ultimate intrinsic signal-to-noise ratio (SNR)1–3, image acceleration with less SNR penalty4–7 and, in some cases, contrast-to-noise ratio (CNR). These advantages allow higher image resolution and/or reduced acquisition time ushering in new opportunities for various clinical and research applications8,9. To exploit such advantages at the extreme field of 10.5T, a 32-channel receiver array was built for 10.5T human brain imaging and its performance was compared with a state of the art 32-channel receiver array at 7T for SNR. We are currently building a 64-channel version and designing a 128-channel version of this coil.Methods
RF coil design and constructionThe 10.5T 32-channel receiver array was composed of 31 loop elements and a cloverleaf element implemented on the top of the helmet (head former). The cloverleaf element was composed of two perpendicular loops, each with crossed-over legs, whose outputs were combined into a single receive channel. The other 31 loop elements were divided into rows along the z-direction, where each row had 0.8-1 cm overlap with adjacent rows. No overlap or inductive decoupling was used between elements of each row. Instead a self-decoupling technique10 was developed to decouple adjacent loops within each row. This was achieved using a trimmer capacitor to control current phase in each loop. Preamplifier decoupling11 was used to further improve decoupling between all receive elements. In order to minimize the interactions between transmitter and receiver, preamplifier input coaxial (feed) cables were gathered and routed in five paths along the centerline of transmitter loops. Cable traps were constructed on preamplifier input coaxial cables and tuned slightly off-resonance12 to avoid coupling into receive elements while suppressing shield-current-induced noise13,14. A 16-channel dual row loop transmitter15 was co-designed and used in these experiments.
Data acquisition and analysis
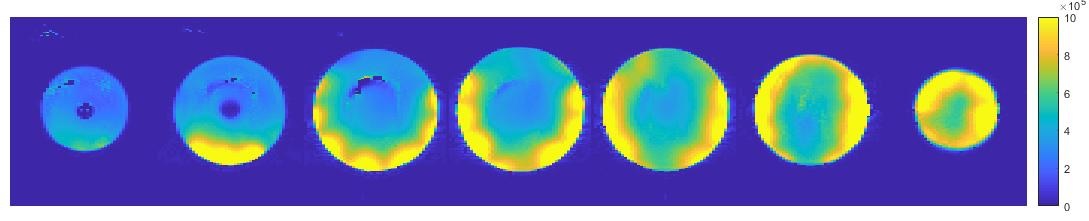
Relative transmit field maps were obtained using a series of small flip angle multi-slice gradient echo (GRE) sequences16,17. The typical sequence parameters were seven 5 mm thick axial slices, TR=100ms, TE=3.5ms, FA=10°, pixel bandwidth = 300 Hz/pixel. Actual flip angle (AFI)18 maps were acquired (3D, TR=75ms, TE=2.0ms, nominal FA=50°). SNR data were acquired in an approximately fully relaxed, transverse multi-slice GRE sequence with the same 7 axial slices, TR=7000ms-10000ms, TE=3.5ms, FA=80°, pixel bandwidth = 300 Hz/pixel. This was followed by a noise scan which was identical to the SNR sequence except for FA=0°, TR=70-100ms.
The noise correlation matrix was calculated based on the complex noise data and used to decorrelate the SNR data before they are combined using root sum-of-square method11,19. In steady state gradient echo, signal intensity is proportional to (sin θ)E2, where E2=exp(-TE/T2∗) and θ is the flip angle distribution reflecting transmit B1+ inhomogeneity. SNR maps were normalized by (sin θ), voxel size and bandwidth to make SNR calculations comparable across experiments20. T2* decay, which would be higher at 10.5T, was not considered in these calculations.
Results
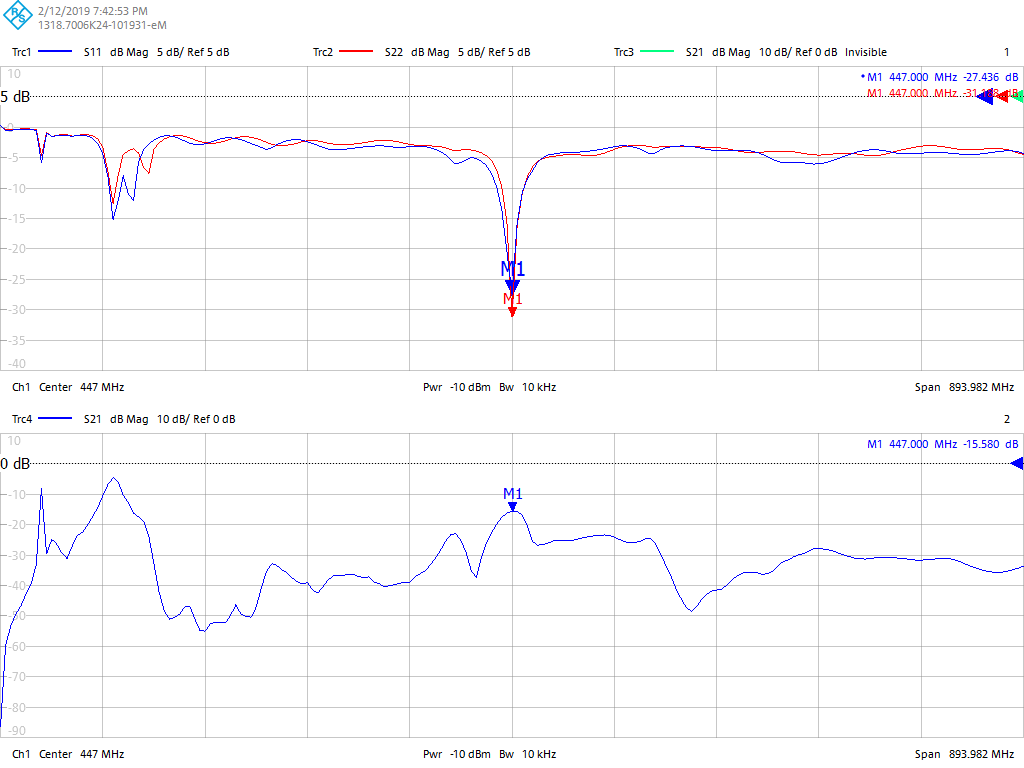
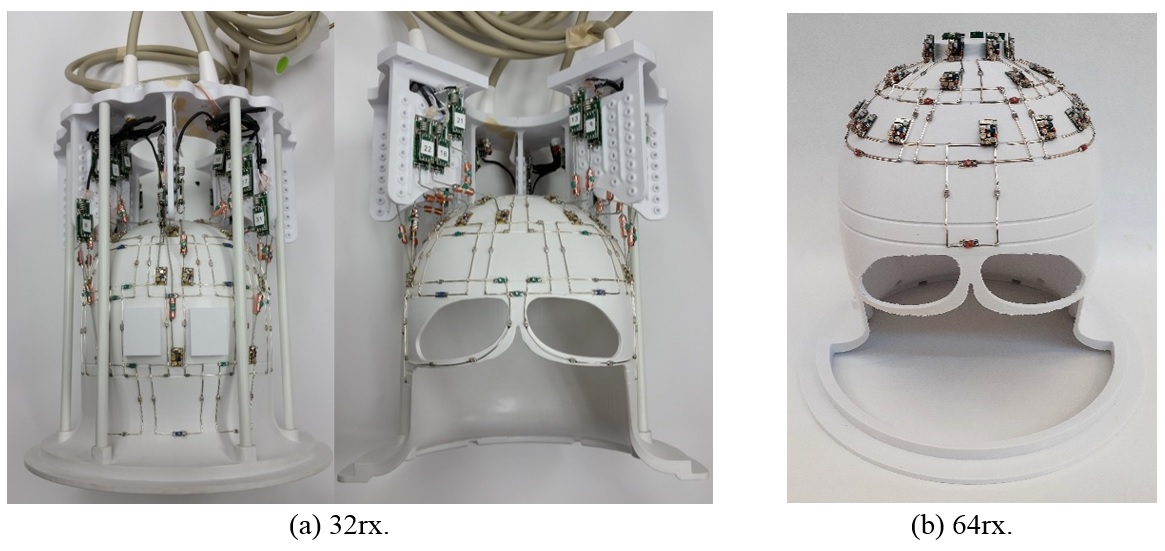
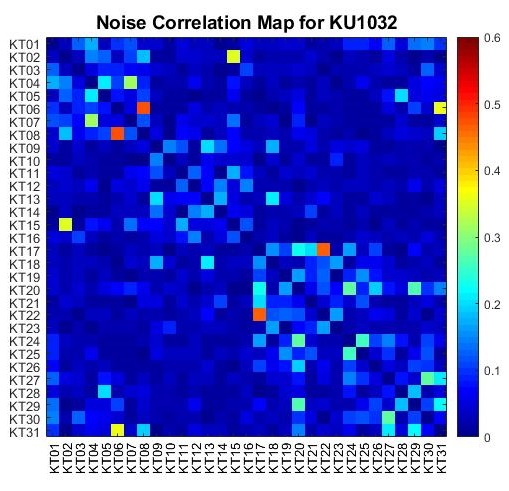
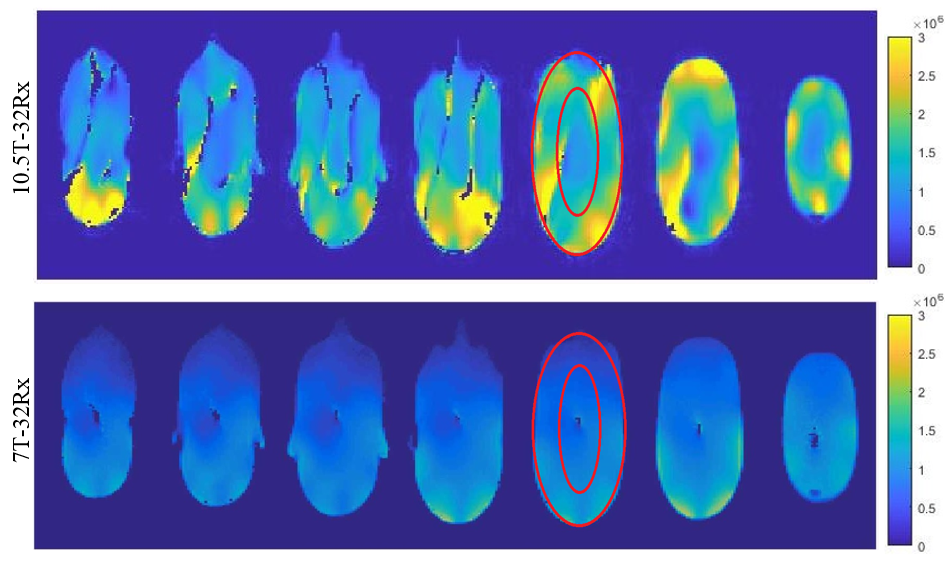
Bench measurements demonstrated average -15dB decoupling between elements in each row. Figure 1 presents S-parameters of the eye loops measured using a 16-port vector network analyzer (ZNBT8, Rohde & Schwarz), demonstrating effective decoupling of these loops as an instance. These are adjacent loops, each 8x4cm, non-overlapped, with 0.8cm gap between them. The presented S-parameters are without inductive decoupling and before preamplifiers were attached. Figure 2a presents the completed 32-channel receive array.Figure 3 presents the noise correlation matrix of the receive array measured experimentally at the 10.5T scanner. Maximum noise correlation of 0.37 is a significant improvement over previous works21. We attribute this to the self-decoupling technique, design of cable routing relative to transmitter and optimized location of coaxial cable traps. Figure 4 illustrates experimental SNR comparison obtained with identical protocol and experimental setups at 7T and 10.5T. Central SNR was 53% higher at 10.5T and peripheral SNR was 66% higher at 10.5T.
Discussion
We presented a successful development of a 10.5T receive array using an implementation of a novel self-decoupling approach which can be used to simplify future high density receive array design and construction via reducing the reliance on overlap. Noise correlation results suggest this array layout has a promising potential for parallel imaging, as g-factor22 improves with lower noise correlation. The receive array design presented here was shown15 to result in receiver transparency (i.e. transmit field immunity to receive array insertion23). Receiver transparency will facilitate specific absorption rate (SAR) estimation and regulatory validation as it simplifies the electromagnetic simulation pipeline. Furthermore, peripheral and central SNR improvements presented here in comparison to 7T confirm the expected gains for ultra-high field imaging3,24–26 and are crucial to various high resolution clinical and research applications of UHF MRI9,27–30.Conclusion
Electromagnetic simulations, MR thermometry and safety evaluations of the 32-channel receive array presented here for the purpose of regulatory validation leading to in-vivo experiments are currently ongoing. At ultra-high magnetic fields, higher channel counts (ultra-high density receive arrays) are required to achieve higher fraction of the ultimate intrinsic SNR31. A 64-channel receive array is under construction (Figure 2b) and a 128-channel receiver is designed for human brain imaging at 10.5T based on the lessons learned with the RF coil presented herein.Acknowledgements
The authors acknowledge NIH S10 RR029672, NIH U01EB025144, BTRC P41 EB015894, P30 NS076408, P41 EB027061 and NIH R34AG055178 grants.References
1. Ocali O, Atalar E. Ultimate intrinsic signal-to-noise ratio in MRI. Magn Reson Med. 1998;39(3):462-473. doi:10.1002/mrm.1910390317
2. Schnell W, Renz W, Vester M, Ermert H. Ultimate signal-to-noise-ratio of surface and body antennas for magnetic resonance imaging. IEEE Trans Antennas Propag. 2000;48(3):418-428. doi:10.1109/8.841903
3. Pohmann R, Speck O, Scheffler K. Signal-to-noise ratio and MR tissue parameters in human brain imaging at 3, 7, and 9.4 tesla using current receive coil arrays. Magn Reson Med. 2016;75(2):801-809. doi:10.1002/mrm.25677
4. Schmitter S, Schnell S, Uğurbil K, et al. Towards high-resolution 4D flow MRI in the human aorta using kt-GRAPPA and B1+ shimming at 7T. J Magn Reson Imaging. 2016;44(2):486-499. doi:10.1002/jmri.25164
5. Arcan M, Urk E, Wu X, et al. Toward Imaging the Body at 10.5 Tesla. Magn Reson Med. 2017;77:434-443. doi:10.1002/mrm.26487
6. Sati P. Diagnosis of multiple sclerosis through the lens of ultra-high-field MRI. J Magn Reson. 2018;291:101-109. doi:10.1016/J.JMR.2018.01.022
7. Wiesinger F, Van de Moortele P-F, Adriany G, De Zanche N, Ugurbil K, Pruessmann KP. Parallel imaging performance as a function of field strength - An experimental investigation using electrodynamic scaling. Magn Reson Med. 2004;52(5):953-964. doi:10.1002/mrm.20281
8. Ladd ME, Bachert P, Meyerspeer M, et al. Pros and cons of ultra-high-field MRI/MRS for human application. Prog Nucl Magn Reson Spectrosc. 2018;109:1-50. doi:10.1016/J.PNMRS.2018.06.001
9. Uğurbil K. Imaging at ultrahigh magnetic fields: History, challenges, and solutions. Neuroimage. 2018;168:7-32. doi:10.1016/J.NEUROIMAGE.2017.07.007
10. Yan X, Gore JC, Grissom WA. Self-decoupled radiofrequency coils for magnetic resonance imaging. Nat Commun. 2018;9(1):3481. doi:10.1038/s41467-018-05585-8
11. Roemer PB, Edelstein WA, Hayes CE, Souza SP, Mueller OM. The NMR phased array. Magn Reson Med. 1990;16(2):192-225. doi:10.1002/mrm.1910160203
12. Shajan G, Kozlov M, Hoffmann J, Turner R, Scheffler K, Pohmann R. A 16-channel dual-row transmit array in combination with a 31-element receive array for human brain imaging at 9.4 T. Magn Reson Med. 2014;71(2):870-879. doi:10.1002/mrm.24726
13. Seeber DA, Jevtic J, Menon A. Floating shield current suppression trap. Concepts Magn Reson. 2004;21B(1):26-31. doi:10.1002/cmr.b.20008
14. Brown J, Whitlock B. Common-Mode to Differential-Mode Conver-sion in Shielded Twisted-Pair Cables (Shield-Current-Induced Noise). 114th AES Conv Amsterdam. 2003:5747. http://www.aes.org/e-lib/. Accessed June 17, 2019.
15. Adriany G, Radder J, Tavaf N, et al. Evaluation of a 16-Channel Transmitter for Head Imaging at 10.5T. In: 2019 International Conference on Electromagnetics in Advanced Applications (ICEAA). IEEE; 2019:1171-1174. doi:10.1109/ICEAA.2019.8879131
16. Van de Moortele P, Snyder C, DelaBarre L, Vaughan J, Ugurbil K. Shimming at Very High Field with Multiple Element RF Coils: Calibration Tools from Ultra Fast Local Relative B1+/- Phase to Absolute Magnitude B1+ Mapping. In: International Society of Magnetic Resonance in Medicine. ; 2007:1676.
17. Van de Moortele P-F, Ugurbil K. Very fast multi channel B1 calibration at high field in the small flip angle regime. In: International Society of Magnetic Resonance in Medicine. ; 2009:367.
18. Yarnykh VL. Actual flip-angle imaging in the pulsed steady state: A method for rapid three-dimensional mapping of the transmitted radiofrequency field. Magn Reson Med. 2007;57(1):192-200. doi:10.1002/mrm.21120
19. Kellman P, McVeigh ER. Image reconstruction in SNR units: A general method for SNR measurement. Magn Reson Med. 2005;54(6):1439-1447. doi:10.1002/mrm.20713
20. Adriany G, Van De Moortele P-FF, Wiesinger F, et al. Transmit and receive transmission line arrays for 7 tesla parallel imaging. Magn Reson Med. 2005;53(2):434-445. doi:10.1002/mrm.20321
21. Uğurbil K, Auerbach E, Moeller S, et al. Brain imaging with improved acceleration and SNR at 7 Tesla obtained with 64-channel receive array. Magn Reson Med. February 2019. doi:10.1002/mrm.27695
22. Pruessmann KP, Weiger M, Scheidegger MB, Boesiger P. SENSE: Sensitivity encoding for fast MRI. Magn Reson Med. 1999;42(5):952-962. doi:10.1002/(SICI)1522-2594(199911)42:5<952::AID-MRM16>3.0.CO;2-S
23. Tavaf N, Lagore RL, Moen S, et al. A 15-channel loop dipole array for in-vivo swine head MR imaging at 10.5T. In: International Society of Magnetic Resonance in Medicine. Vol 27. ; 2019:1445. https://index.mirasmart.com/ISMRM2019/PDFfiles/1445.html.
24. Guérin B, Villena JF, Polimeridis AG, et al. The ultimate signal-to-noise ratio in realistic body models. Magn Reson Med. 2017;78(5):1969-1980. doi:10.1002/mrm.26564
25. Pfrommer A, Henning A. The ultimate intrinsic signal‐to‐noise ratio of loop‐ and dipole‐like current patterns in a realistic human head model. Magn Reson Med. 2018;80(5):2122-2138. doi:10.1002/mrm.27169
26. Wiesinger F, Boesiger P, Pruessmann KP. Electrodynamics and ultimate SNR in parallel MR imaging. Magn Reson Med. 2004;52(2):376-390. doi:10.1002/mrm.20183
27. De Martino F, Yacoub E, Kemper V, et al. The impact of ultra-high field MRI on cognitive and computational neuroimaging. Neuroimage. 2018;168(March):366-382. doi:10.1016/j.neuroimage.2017.03.060
28. Dumoulin SO, Fracasso A, van der Zwaag W, Siero JCW, Petridou N. Ultra-high field MRI: Advancing systems neuroscience towards mesoscopic human brain function. Neuroimage. 2018;168:345-357. doi:10.1016/j.neuroimage.2017.01.028
29. Polimeni JR, Uludağ K. Neuroimaging with ultra-high field MRI: Present and future. Neuroimage. 2018;168:1-6. doi:10.1016/j.neuroimage.2018.01.072
30. Trattnig S, Springer E, Bogner W, et al. Key clinical benefits of neuroimaging at 7T. Neuroimage. 2016;168(November):477-489. doi:10.1016/j.neuroimage.2016.11.031
31. Keil B, Wald LL. Massively parallel MRI detector arrays. J Magn Reson. 2013;229:75-89. doi:10.1016/j.jmr.2013.02.001
Figures