4016
Voxel-wise Characterization of Hemodynamic Response Function in Brain White Matter Using Resting-State fMRI1Department of Computer Science, Chengdu University of Information Technology, Chengdu, China, 2Institute of Imaging Science, Vanderbilt University, Nashville, TN, United States, 3Electrical Engineering & Computer Science, Vanderbilt University, Nashville, TN, United States, 4Department of Radiology and Radiological Sciences, Vanderbilt University Medical Center, Nashville, TN, United States, 5Department of Biomedical Engineering, Vanderbilt University, Nashville, TN, United States
Synopsis
This study investigated the hemodynamic response function (HRF) of BOLD effects in white matter (WM) voxels obtained from fMRI in a resting-state. It was found that the WM HRF can be derived by reference to GM avalanche activities. The derived resting-state WM HRFs have low magnitudes, delayed onsets, and prolonged initial dips compared with GM HRF. The time delay distribution patterns and correlation coefficient profiles for WM voxels depend on the selection of the reference GM region. These findings suggest that fMRI signals in WM are associated with those in GM and encode neural activities.
Introduction
The blood oxygenation level dependent (BOLD) hemodynamic response function (HRF) is a key feature for detecting and characterizing neural activities in functional magnetic resonance imaging (fMRI). HRFs with reduced magnitudes, delayed onsets and prolonged initial dips in white matter (WM) tracts relative to gray matter (GM) have been derived using event-related fMRI1. Similar profiles have also been reported using block-based functional tasks or gas challenges2-6. Here we evaluate whether similar HRFs are integrated into resting state signals and modulate the temporal variations of baseline signal variations.Methods
Resting state fMRI datasets from 32 healthy and right-handed individuals (16 M/16F; mean age, 33.03 ± 11.1; range, 21-55) were analyzed. Standard parameters were used for image acquisitions as previously reported1.MRI preprocessing
FMRI data were preprocessed using the SPM12 software package in standard fashion including correcting for slice timing and head motion, regressing out motion and CSF signal, filtering (passband=0.01 - 0.1Hz), coregistering to the MNI space, detrending, and normalizing the time-courses. T1 image preprocessing included segmenting WM, GM and CSF and registering them to the MNI space.
Extraction of GM and WM BOLD signals
BOLD signals from three GM regions (left posterior cingulate cortex (PCC), left intraparietal sulcus (IPS), and right opercular part of inferior frontal gyrus (IFGoperc)), as well as from whole brain WM voxels, were extracted from the preprocessed data.
Detection of GM and WM hemodynamic response function
Three groups of signal maxima corresponding to pronounced spontaneous brain activities of different magnitudes (high, medium and low), termed as activity avalanches7, were identified in each GM region. We then estimated the avalanche-driven HRFs in the three GM regions (HRFs-gm) and for each WM voxel (HRFs-wm), respectively. HRFs-wm were estimated by aligning the time to the onset of each avalanche extracted in the GM.
Calculation of time delay and correlation
The extracted HRFs-wm and HRFs-gm were convolved to yield the time delay (TD) for each WM voxel, which corresponds to the local maximum of convolution. Meanwhile, pairwise temporal correlations between each of the selected GM regions and each brain WM voxel were estimated.
Results
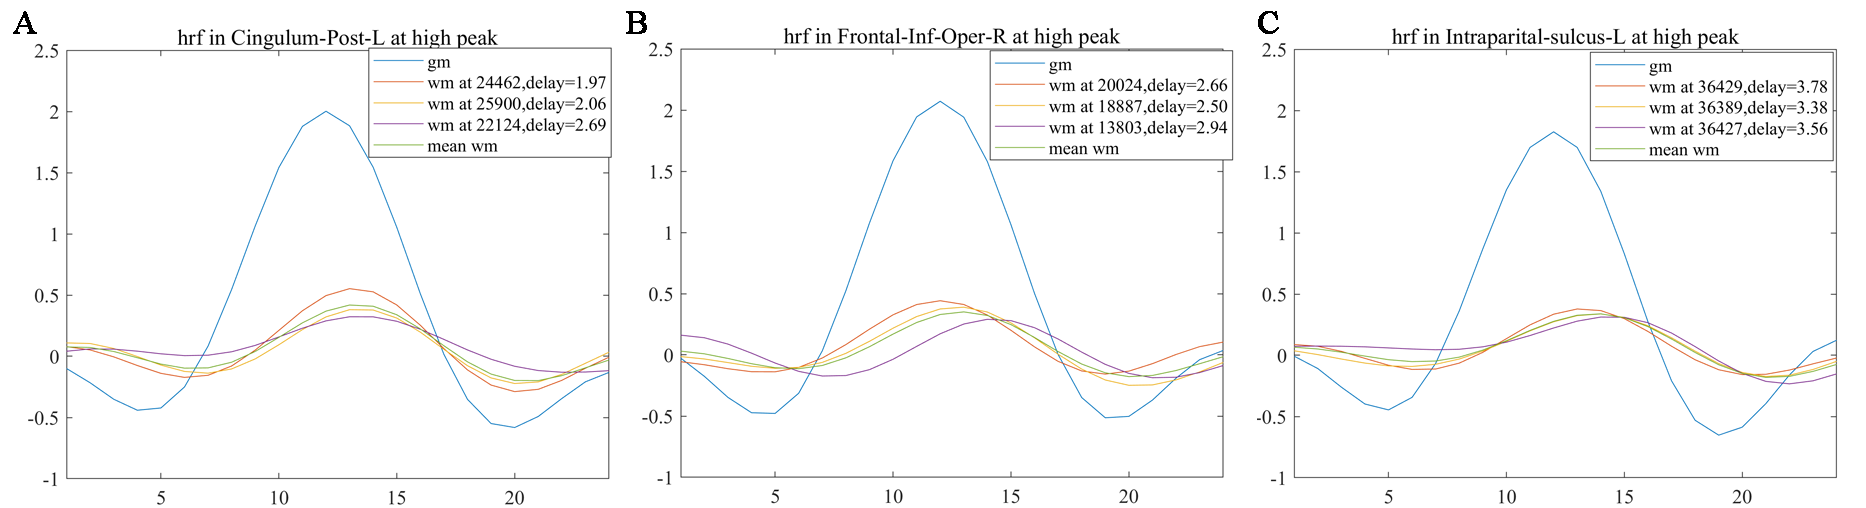
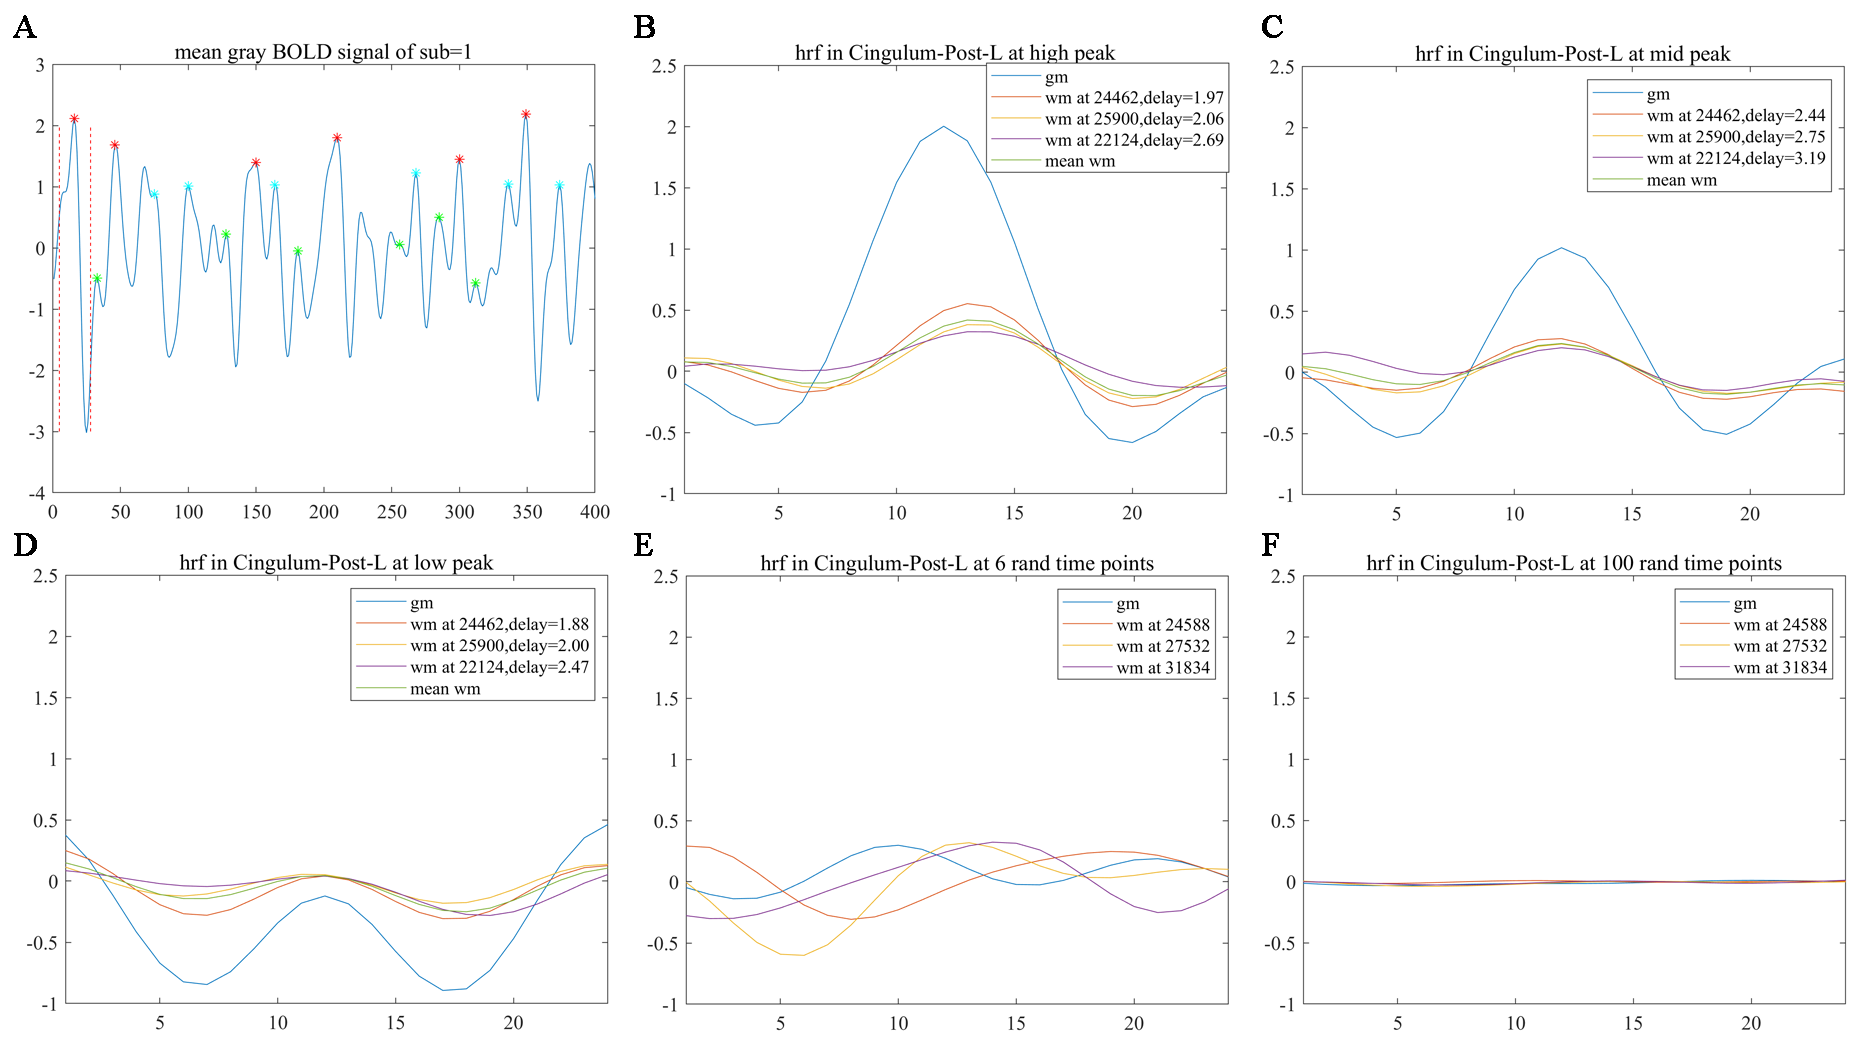
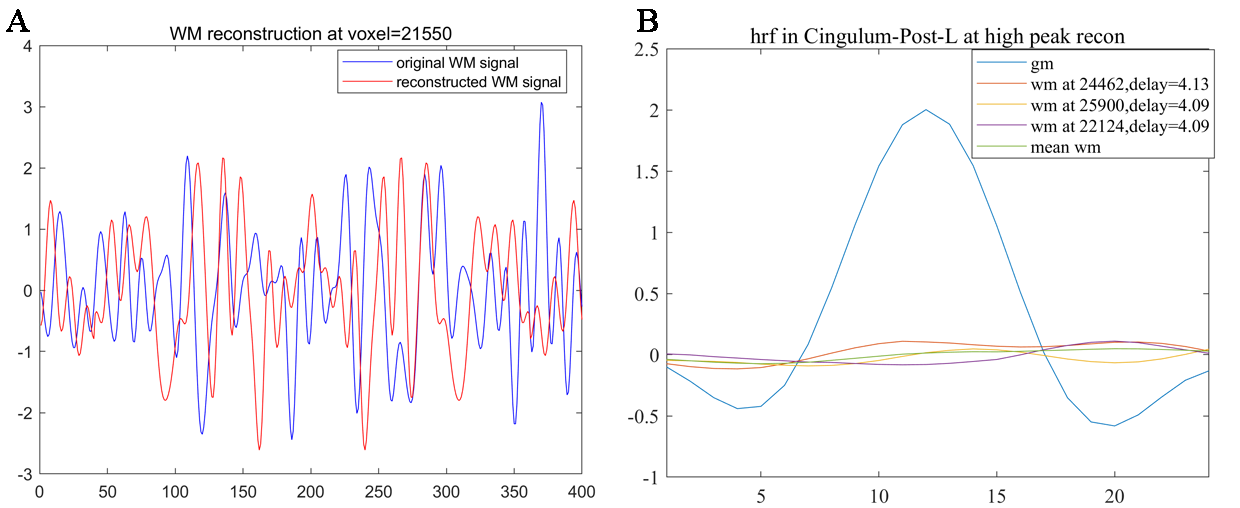
Resting state HRFs in GM and WM regionsHRFs in WM can be derived by reference to the time onsets of activity avalanches in GM, and show reduced magnitudes, delayed onsets, and prolonged initial dips compared with HRFs in GM (Figure 1). Furthermore, as the magnitude of the reference GM avalanches decreased, the magnitudes of the derived WM HRFs became smaller and tended to be flat when referencing random time onsets (Figure 2). To confirm that the derived WM HRFs are associated with avalanching activities in GM, WM HRFs were also reconstructed from randomly perturbed BOLD signals with the same power spectrum in the frequency domain. The new WM HRFs derived this way bore no similarity to GM (Figure 3).
Time delay of WM voxels relative to the GM regions
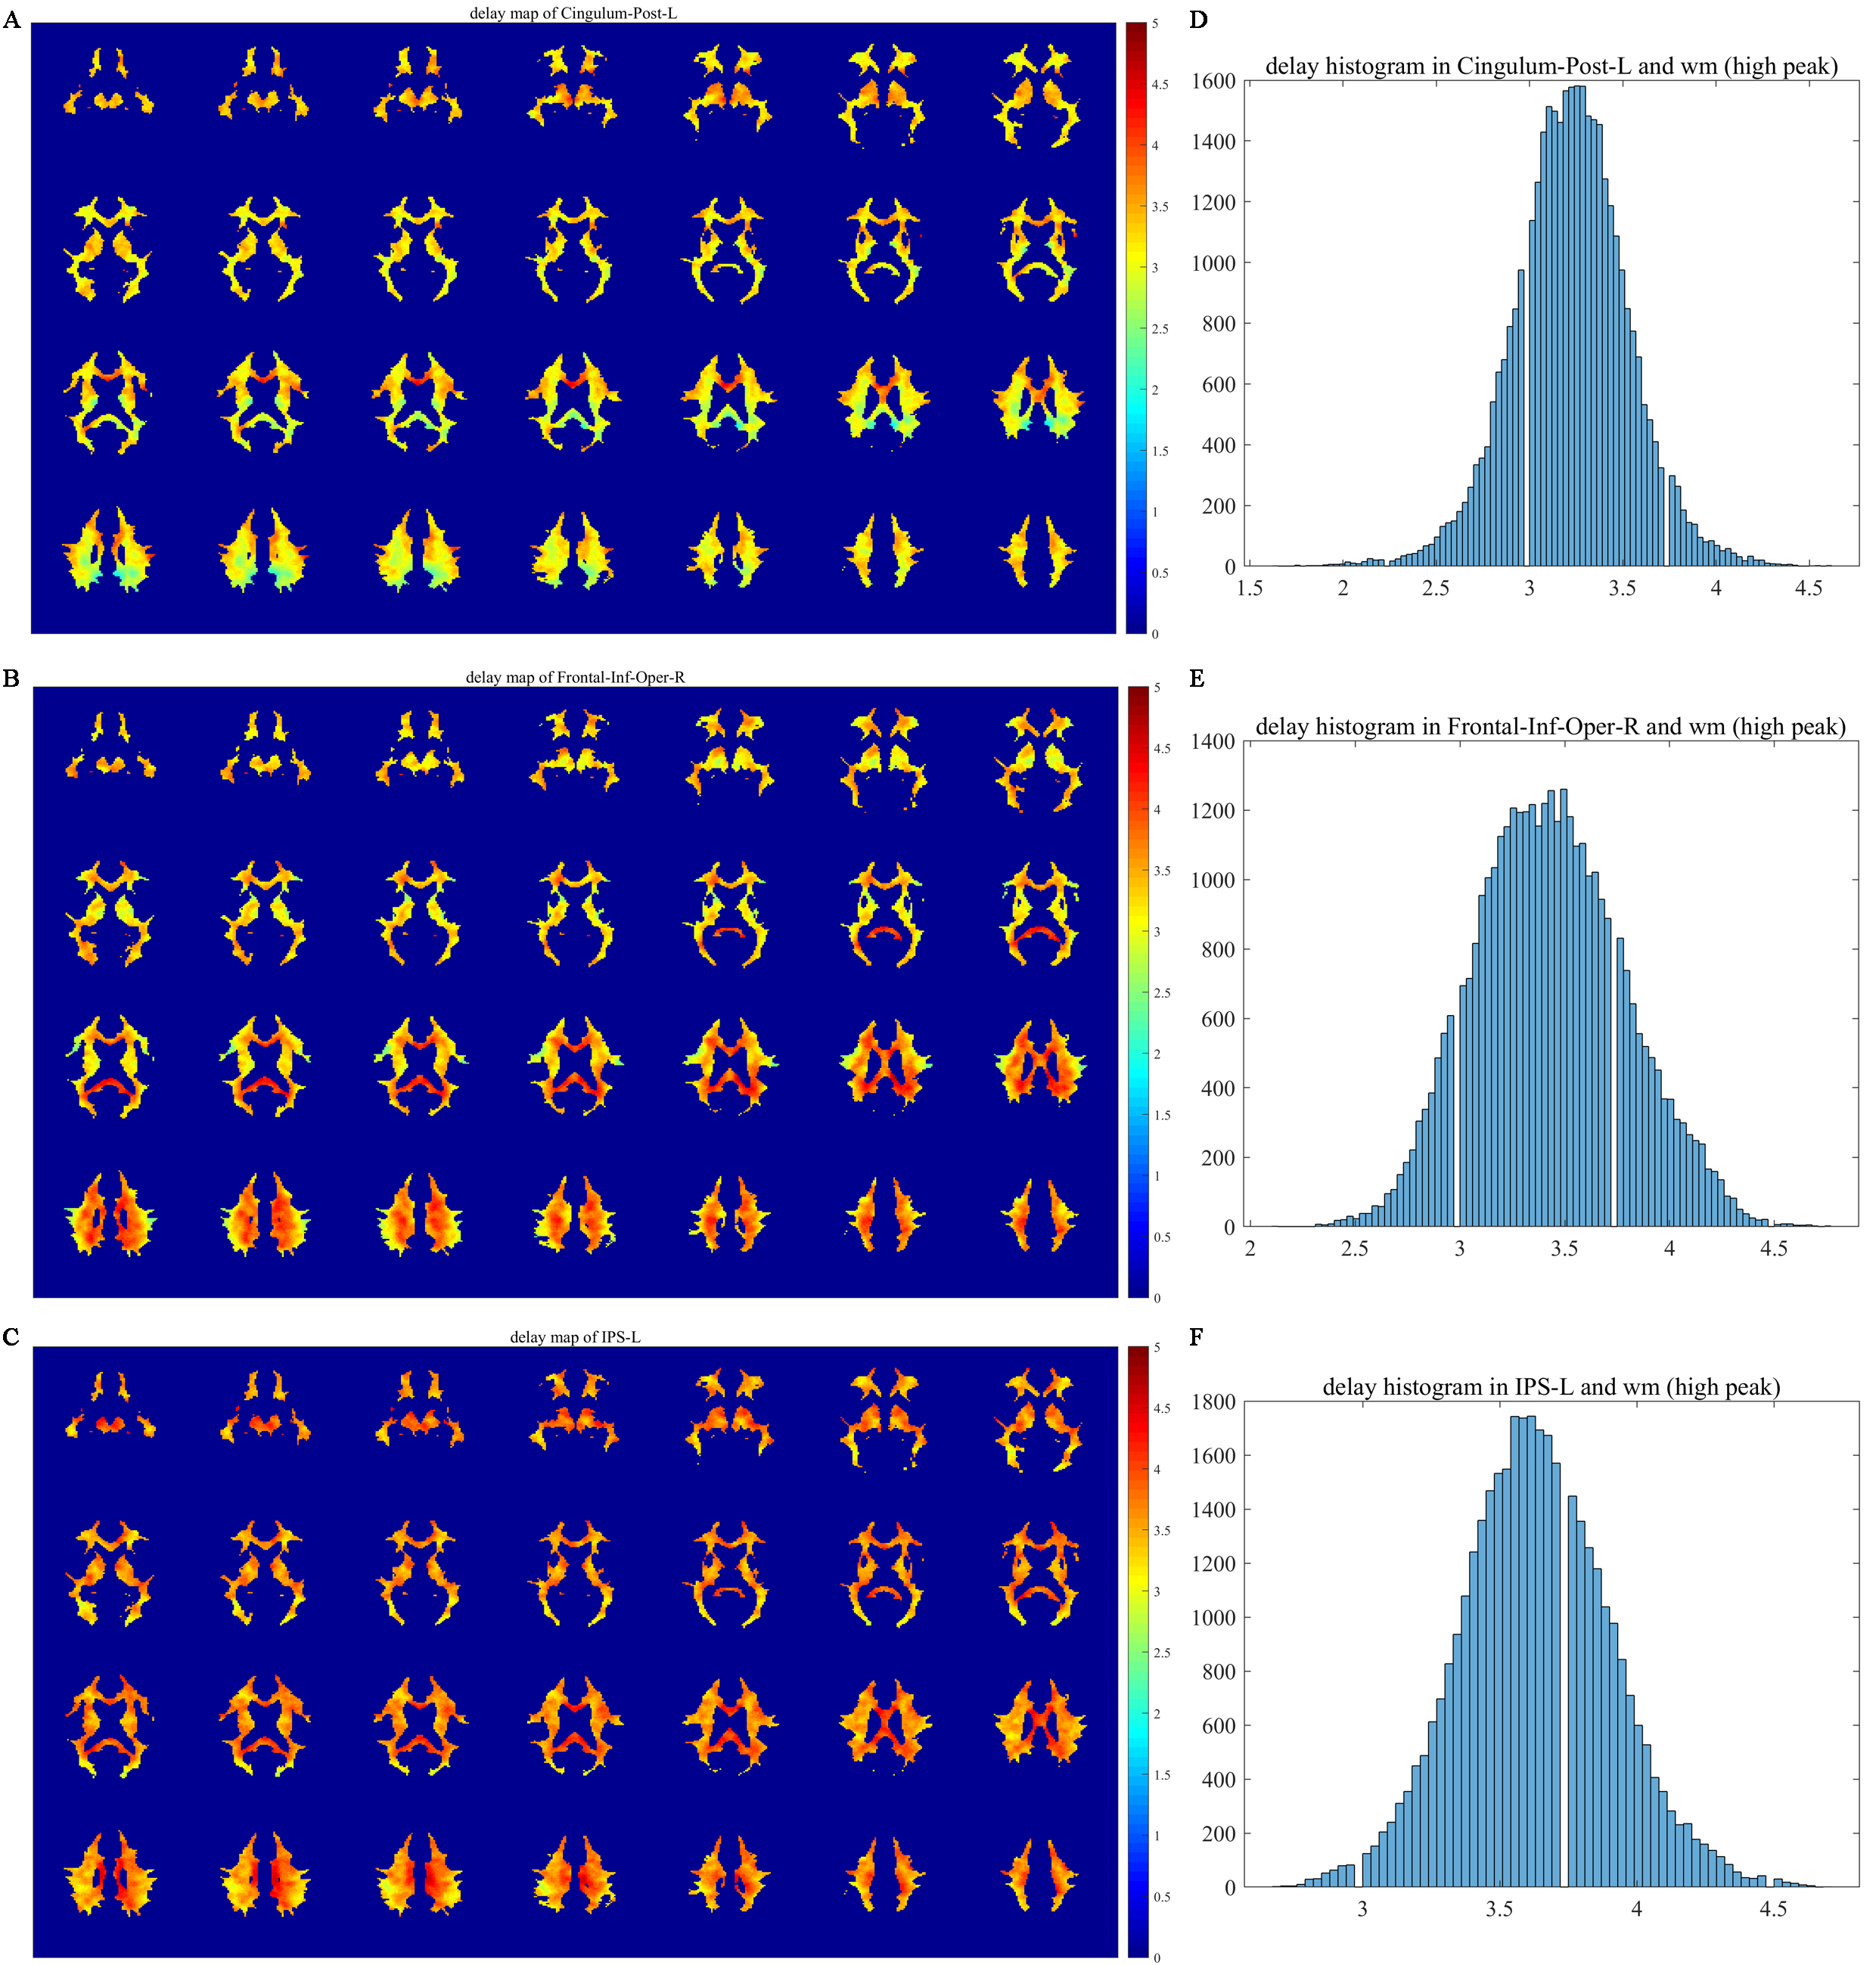
The time lag values were superimposed onto the WM mask and their statistical histograms were computed (Figure 4). Evidently, the time lag distributions of WM voxels differ among the three reference GM regions. Most of the WM time lag values are concentrated in 3.1~3.4, 3.3~3.6, and 3.6~3.7 seconds relative to the left PCC, right IFGoperc, and left IPS respectively.
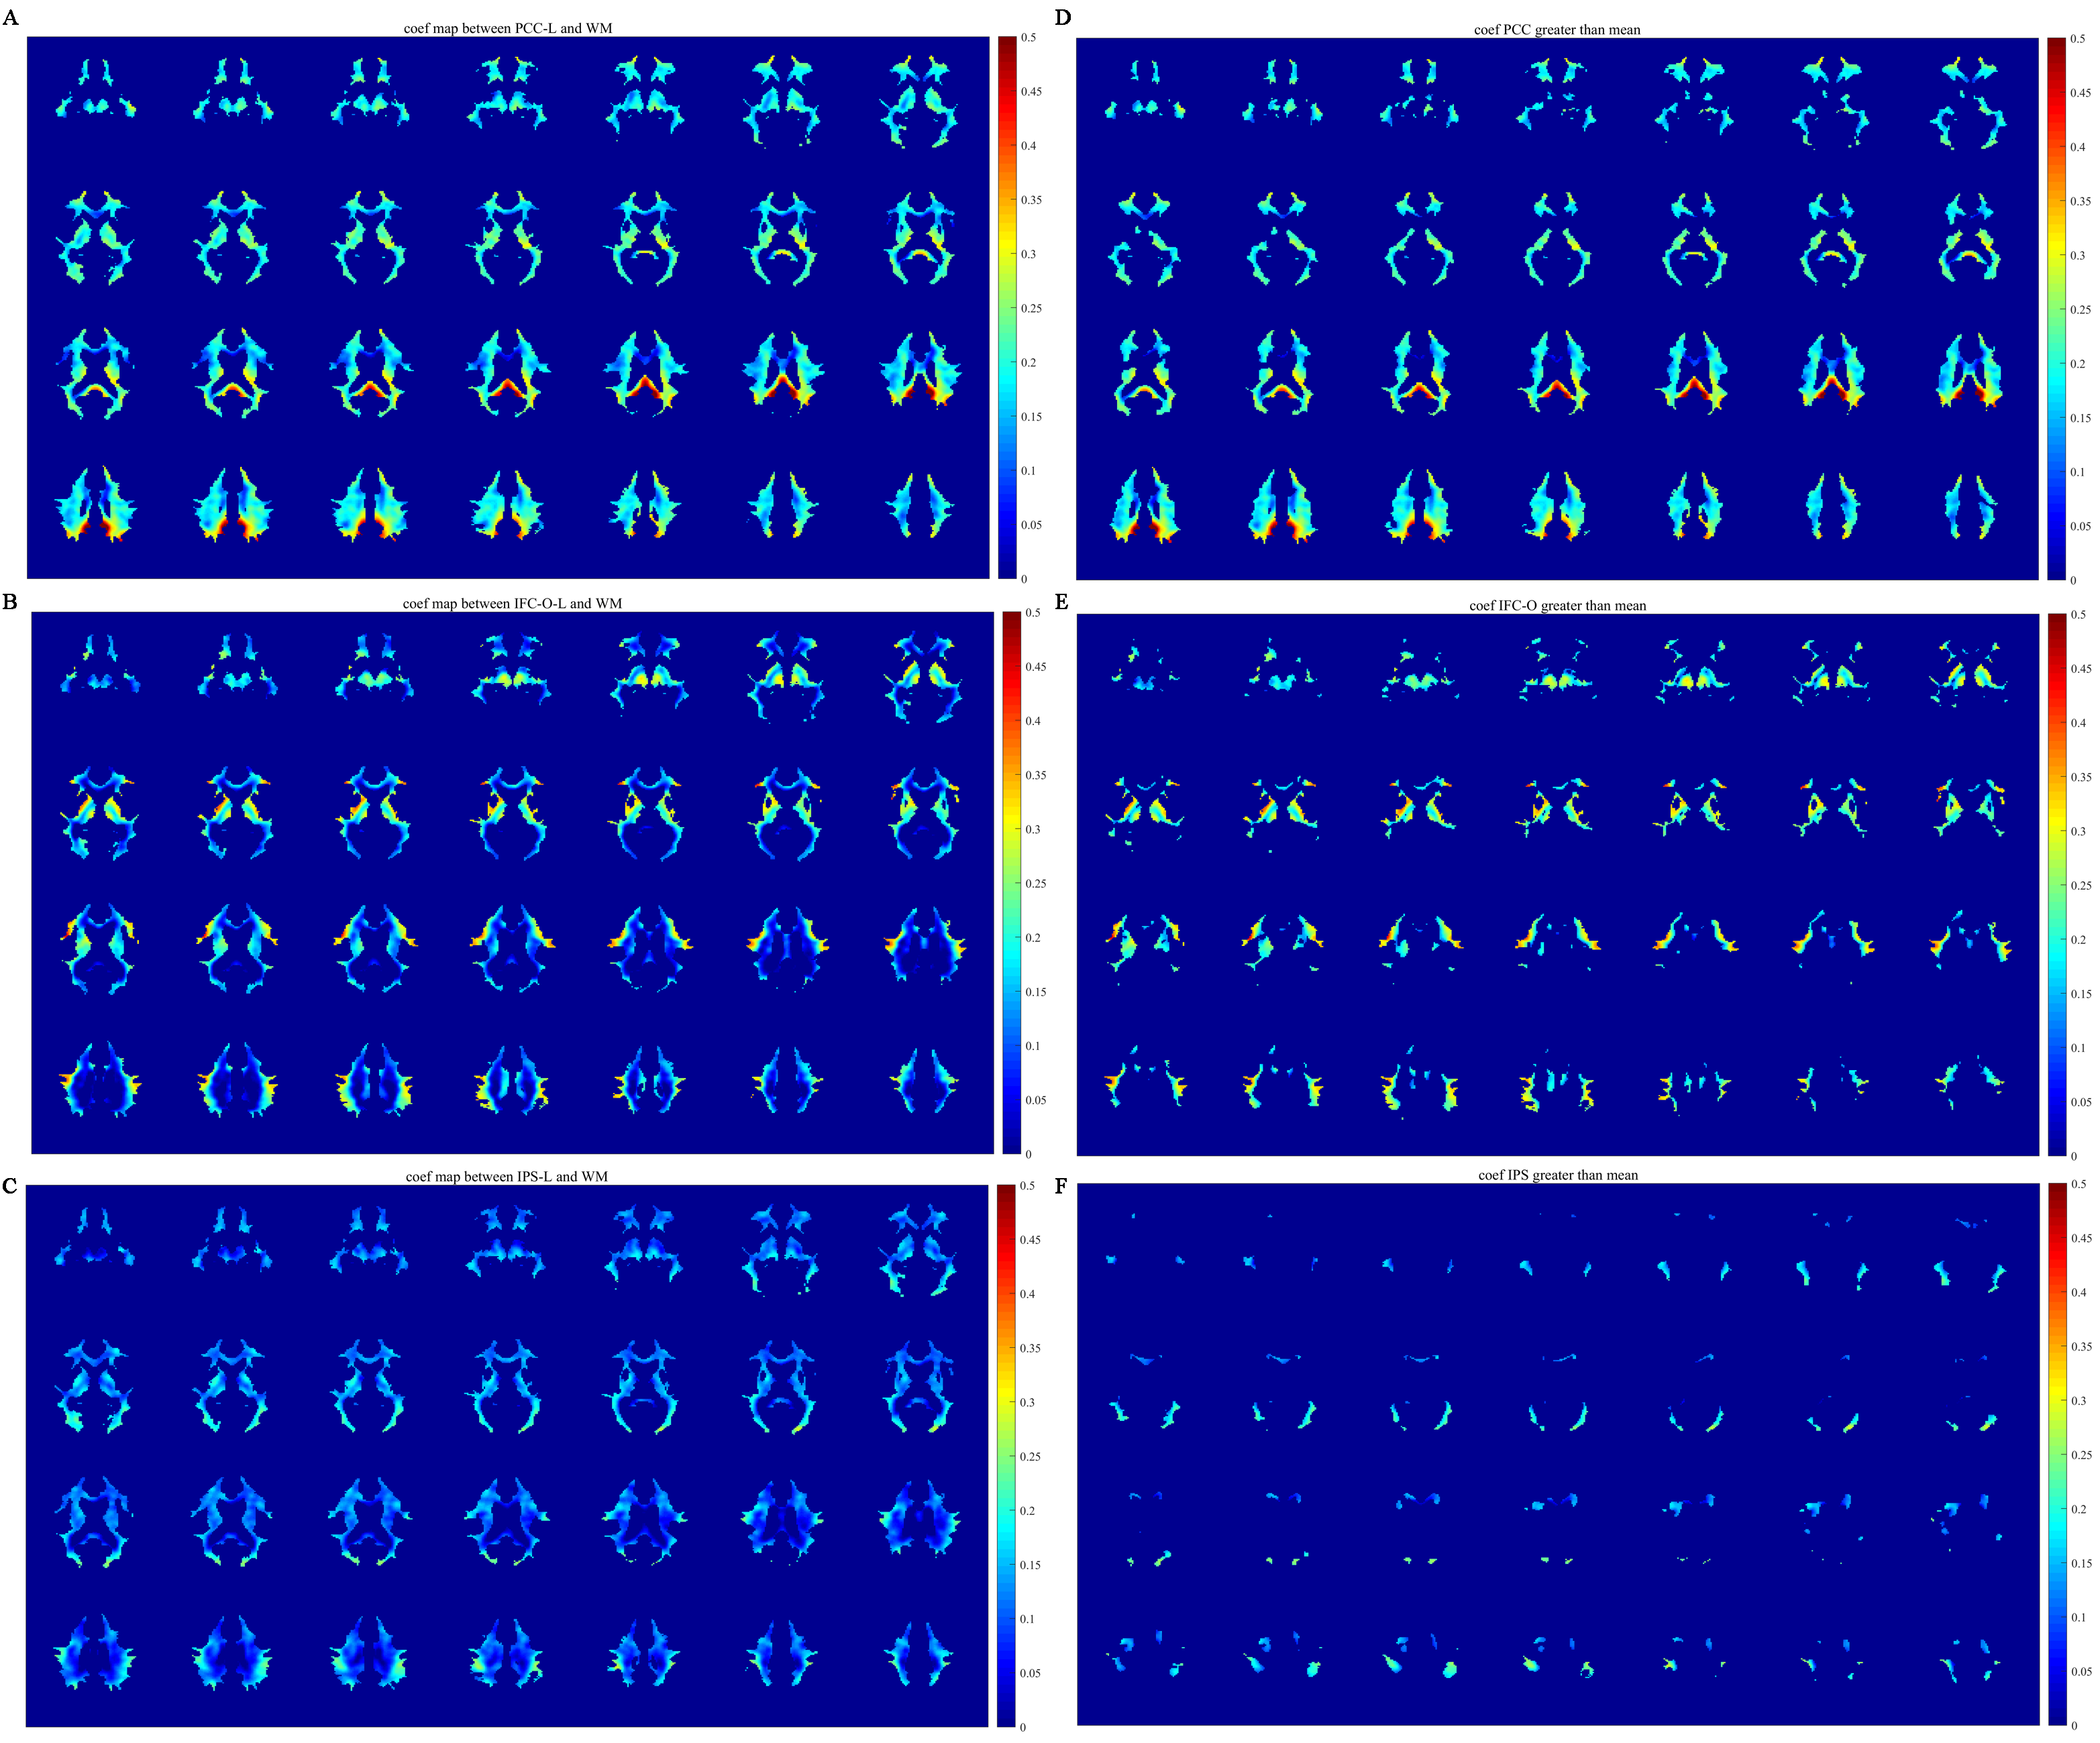
Resting-state correlations between WM voxels and GM regions
Maps of correlations between selected GM regions and WM voxels are shown in Figure 5. It can be seen that WM correlation profiles exhibit spatial specificity to GM regions, which further suggests that the WM signals encode neural activities related to GM signals.
Discussion
The derived WM HRFs showed reduced magnitudes, delayed onsets, and prolonged initial dips compared with the GM HRF. This is in good agreement with our previous study which demonstrated a similar WM HRF in an event-related Stroop color-word interference task fMRI1. The reduced magnitude of WM signals may be attributed to the lower WM vasculature which is much less dense than GM8, with blood flow approximately one-fourth of that in the GM9. The prolonged initial dip and delayed onsets in WM may be attributed to the longer arrival time of cerebral blood flow from feeding arteries than the GM8, 10, 11.The distributions of time delays in WM relative to the three reference GM regions are consistent with their corresponding roles in a resting state. The PCC is a core region in a resting state, while the IPS is active under functional loading and the IFGoperc is least correlated with the PCC9, 12. The smaller the time delay, the more synchronous the BOLD signals in WM with those in GM. This is confirmed by the correlation profiles between the three reference GM regions and WM voxels, which showed higher correlations with PCC than the IFGoperc and IPS.
Conclusion
Findings from this work reveal the nature of HRFs in WM and emphasize the need to take functional activities in WM into consideration in future fMRI-based neuroimaging research.Acknowledgements
This work was supported by grant R01 NS093669 from NIH awarded to JCG and the National Natural Science Foundation [grant number 61806029]; the Chengdu University of Information Engineering Research Fund [grant number KYTZ201719]; and the Project of Sichuan Provincial Education Hall [grant numbers 18ZA0089 and 2018Z065].References
1. Li M, Newton AT, Anderson AW, et al., Characterization of the hemodynamic response function in white matter tracts for event-related fMRI. Nat Commun. 2019; 10(1): 1140.
2. Yarkoni T, Barch DM, Gray JR, et al., BOLD correlates of trial-by-trial reaction time variability in gray and white matter: a multi-study fMRI analysis. PLoS One. 2009; 4(1): e4257.
3. Rostrup E, Law I, Blinkenberg M, et al., Regional differences in the CBF and BOLD responses to hypercapnia: a combined PET and fMRI study. Neuroimage. 2000; 11(2): 87-97.
4. Thomas BP, Liu P, Park DC, et al., Cerebrovascular reactivity in the brain white matter: magnitude, temporal characteristics, and age effects. J Cereb Blood Flow Metab. 2014; 34(2): 242-247.
5. Courtemanche MJ, Sparrey CJ, Song XW, et al., Detecting white matter activity using conventional 3 Tesla fMRI: An evaluation of standard field strength and hemodynamic response function. Neuroimage. 2018; 169: 145-150.
6. Tae WS, Yakunina N, Kim TS, et al., Activation of auditory white matter tracts as revealed by functional magnetic resonance imaging. Neuroradiology. 2014; 56(7): 597-605.
7. Liu X and Duyn JH, Time-varying functional network information extracted from brief instances of spontaneous brain activity. Proceedings of the National Academy of Sciences of the United States of America. 2013; 110(11): 4392-4397.
8. Nonaka H, Akima M, Nagayama T, et al., Microvasculature of the human cerebral meninges. Neuropathology. 2003; 23(2): 129-135.
9. Raichle ME, MacLeod AM, Snyder AZ, et al., A default mode of brain function. Proceedings of the National Academy of Sciences of the United States of America. 2001; 98(2): 676-682.
10. Giezendanner S, Fisler MS, Soravia LM, et al., Microstructure and Cerebral Blood Flow within White Matter of the Human Brain: A TBSS Analysis. Plos One. 2016; 11(3).
11. Brown WR and Thore CR, Review: cerebral microvascular pathology in ageing and neurodegeneration. Neuropathol Appl Neurobiol. 2011; 37(1): 56-74.
12. Vossel S, Geng JJ and Fink GR, Dorsal and ventral attention systems: distinct neural circuits but collaborative roles. Neuroscientist. 2014; 20(2): 150-159.
Figures