4015
Event-related decoding of visual stimulus information using short-TR BOLD fMRI at 7T
Yoichi Miyawaki1,2,3, Daniel A Handwerker3, Javier Gonzalez-Castillo3, Laurentius Huber3,4, Arman Khojandi3, Yuhui Chai3, and Peter A Bandettini3
1The University of Electro-Communications, Tokyo, Japan, 2JST PRESTO, Tokyo, Japan, 3National Institutes of Mental Health, BETHESDA, MD, United States, 4University of Maastricht, Maastricht, Netherlands
1The University of Electro-Communications, Tokyo, Japan, 2JST PRESTO, Tokyo, Japan, 3National Institutes of Mental Health, BETHESDA, MD, United States, 4University of Maastricht, Maastricht, Netherlands
Synopsis
Spatio-temporal dynamics of neural activity plays a pivotal role in forming our perception. Ultra-high field fMRI allows us to visualize fine spatial patterns of neural activity but little is known about its dynamics because it is typically believed to lack sufficient temporal resolution - due either to scanner or hemodynamic limitations. Here we demonstrate that event-related fMRI and multivariate pattern analyses allows us to decode visual information faster than the hemodynamic response, suggesting possibility to analyze neural information representation at high temporal resolution.
Introduction
High spatio-temporal resolution imaging is fundamental for improving our understanding of human brain function. BOLD signals can be acquired with a submillimeter spatial resolution, yet are believed to lack temporal resolution because of the hemodynamic response. However, BOLD signals preserve a subsecond precision of hemodynamic response latency within in each voxel1,2. In addition, short-TR induced reduction in signal can be countered with the gains in SNR at high field. Recent studies showed that oscillatory hemodynamic changes of 0.75 Hz can be detected using BOLD contrast3,4. The temporal limit to detect fast BOLD magnitude changes could be further improved by gains in sensitivity inherent to multivariate pattern analysis. Here we examine how fast neural information can be extracted from fMRI BOLD signals by using 7T MRI with a TR of 125 ms and multivariate pattern analysis.Methods
Thirteen healthy volunteers (four females; age, 22-31) participated and completed an experiment after granting informed consent under an NIH Combined Institutional Review Board-approved protocol (NCT00001360). Data from one male participant was excluded because too much signal deviation was found in the preprocessing stage.The participants’ brain activity was measured by a Siemens MAGNETOM 7T scanner while they observed visual stimuli consisting of natural images of eight object categories. Eight to ten runs were performed for each participant and each run contained 32 image presentation trials for 500 ms followed by a rest period of a gray image whose duration was randomly jittered between 8.5-13.5 s. The object images subtending 12×12° were presented in the random order, and no images were presented more than once. We also performed one independent functional localizer run to identify object-category responsive voxels, in which eight blocks of intact images were presented for 20 s followed by a 20-s block of scrambled images. Each intact and scrambled image was intermittently presented with a gray image by 1-Hz alternation. In both experiments, the fixation disk was presented on the center of the screen and its color changed from white to green with a random interval from one to nine seconds. The subject was asked to press a button when the fixation color changed.
BOLD signals were acquired by T2*-weighted echo-planar imaging sequence with multi-band factor 3 for nine slices to cover most of the occipital and occipitotemporal areas (TR, 125 ms; TE, 20.8 ms; flip angle, 15°; voxel size, 3×3×5 mm).
We preprocessed data in AFNI5, using the standard ‘super-script’ afni_proc.py as follows. The acquired fMRI data underwent motion correction and physiological noise removal, followed by the coregistration of the high-resolution anatomical image (T1 MP2RAGE) of an individual participant to the aligned fMRI data. Voxels were then selected based on the statistical comparison between intact and scrambled images (p < 0.001; cluster size, 40).
A linear support vector machine (decoder) was then trained with the preprocessed fMRI data of the top 400 t-values after application of outlier removal, linear detrending, and amplitude normalization relative to the mean of the rest periods in each run. We evaluated its prediction performance of the presented stimulus categories (only binary classification of animal vs. vehicle was analyzed here) by using a leave-one-run-out cross-validation procedure. The training and testing of the decoder were performed for each timing after the stimulus presentation and the timing was shifted so as to evaluate all time points in each trial, providing the time course of prediction performance.
Results
Comparisons between stimulus prediction accuracy and hemodynamic response to visual stimuli (averaged over trials and selected voxels) showed that stimulus prediction was greater than chance in less than 2 s after stimulus onset and above 90% accuracy approximately 1 s before the hemodynamic response peak (Fig. 1). The precedence of stimulus prediction accuracy for each individual voxels was also confirmed by lags of cross-correlation analysis between stimulus prediction accuracy and hemodynamic responses (Fig. 2), demonstrating that visual stimulus information can be read before an obvious change in hemodynamic response magnitude.To examine whether such fast decoding utilizes multivariate pattern information, we calculated stimulus prediction accuracy using mean values obtained by the spatial average of 400 voxels used for the multivariate pattern analysis. Results showed a significant decrease in stimulus prediction accuracy and a larger time lag until statistically-significant accuracy (Fig. 3), suggesting that BOLD signal patterns across voxels contain visual stimulus information and may facilitate fast and accurate decoding.
Discussion and Conclusion
Combining short-TR acquisition and multivariate pattern analysis, we found that visual stimulus information was accurately decoded prior to the hemodynamic response peak. Further analysis showed that the information decoding was substantially more accurate with the use of multivariate patterns rather than the average amplitude of the BOLD responses. In addition, we have preliminary results showing that the peak time of stimulus prediction accuracy does not change even if we use only a subset of voxels with the late peak time, indicating that the early time window may be more informative than the late time window in terms of visual stimulus representation. These results suggest that short-TR acquisition and multivariate pattern analysis might absorb temporal variability of hemodynamic latency and allow us fast and temporally more precise detection of neural information from BOLD signals.Acknowledgements
We thank Martin Hebart for discussions on experimental design and results, Chung Kan for technical assistance of 7T MRI scanning, and Daniel Glen, Paul Taylor, and Rick Reynolds for technical assistance of fMRI signal preprocessing using AFNI. This work is partially supported by JSPS KAKENHI (18KK0311, 17H01755) and JST PRESTO (JPMJPR1778). Data used in the preparation of this work were obtained from the NIMH's Lab of Brain and Cognition (LBC; Principal Investigator: Peter Bandettini). LBC funding was provided by the National Institute of Mental Health, Division of Intramural Research Programs (NIMH DIRP).References
- Menon RS, Luknowsky DC, Gati JS, “Mental chronometry using latency-resolved functional MRI,” Proc Natl Acad Sci U S A, vol. 95, pp.10902-7 (1998).
- Bandettini PA, “The temporal resolution of Functional MRI,” in "Functional MRI" (Moonen C and Bandettin PA, Eds.), pp. 205-220, Springer - Verlag (1999).
- Lewis LD, Setsompop K, Rosen BR, Polimeni JR, “Fast fMRI can detect oscillatory neural activity in humans,” Proc Natl Acad Sci U S A, vol. 113, E6679-85 (2016).
- Fultz NE, Bonmassar G, Setsompop K, Stickgold RA, Rosen BR, Polimeni JR, Lewis LD, “Coupled electrophysiological, hemodynamic, and cerebrospinal fluid oscillations in human sleep,” Science, vol.366, pp.628-31 (2019).
- Cox RW, “AFNI: software for analysis and visualization of functional magnetic resonance neuroimages,” Comput Biomed Res, vol.29, pp.162-73 (1996).
Figures
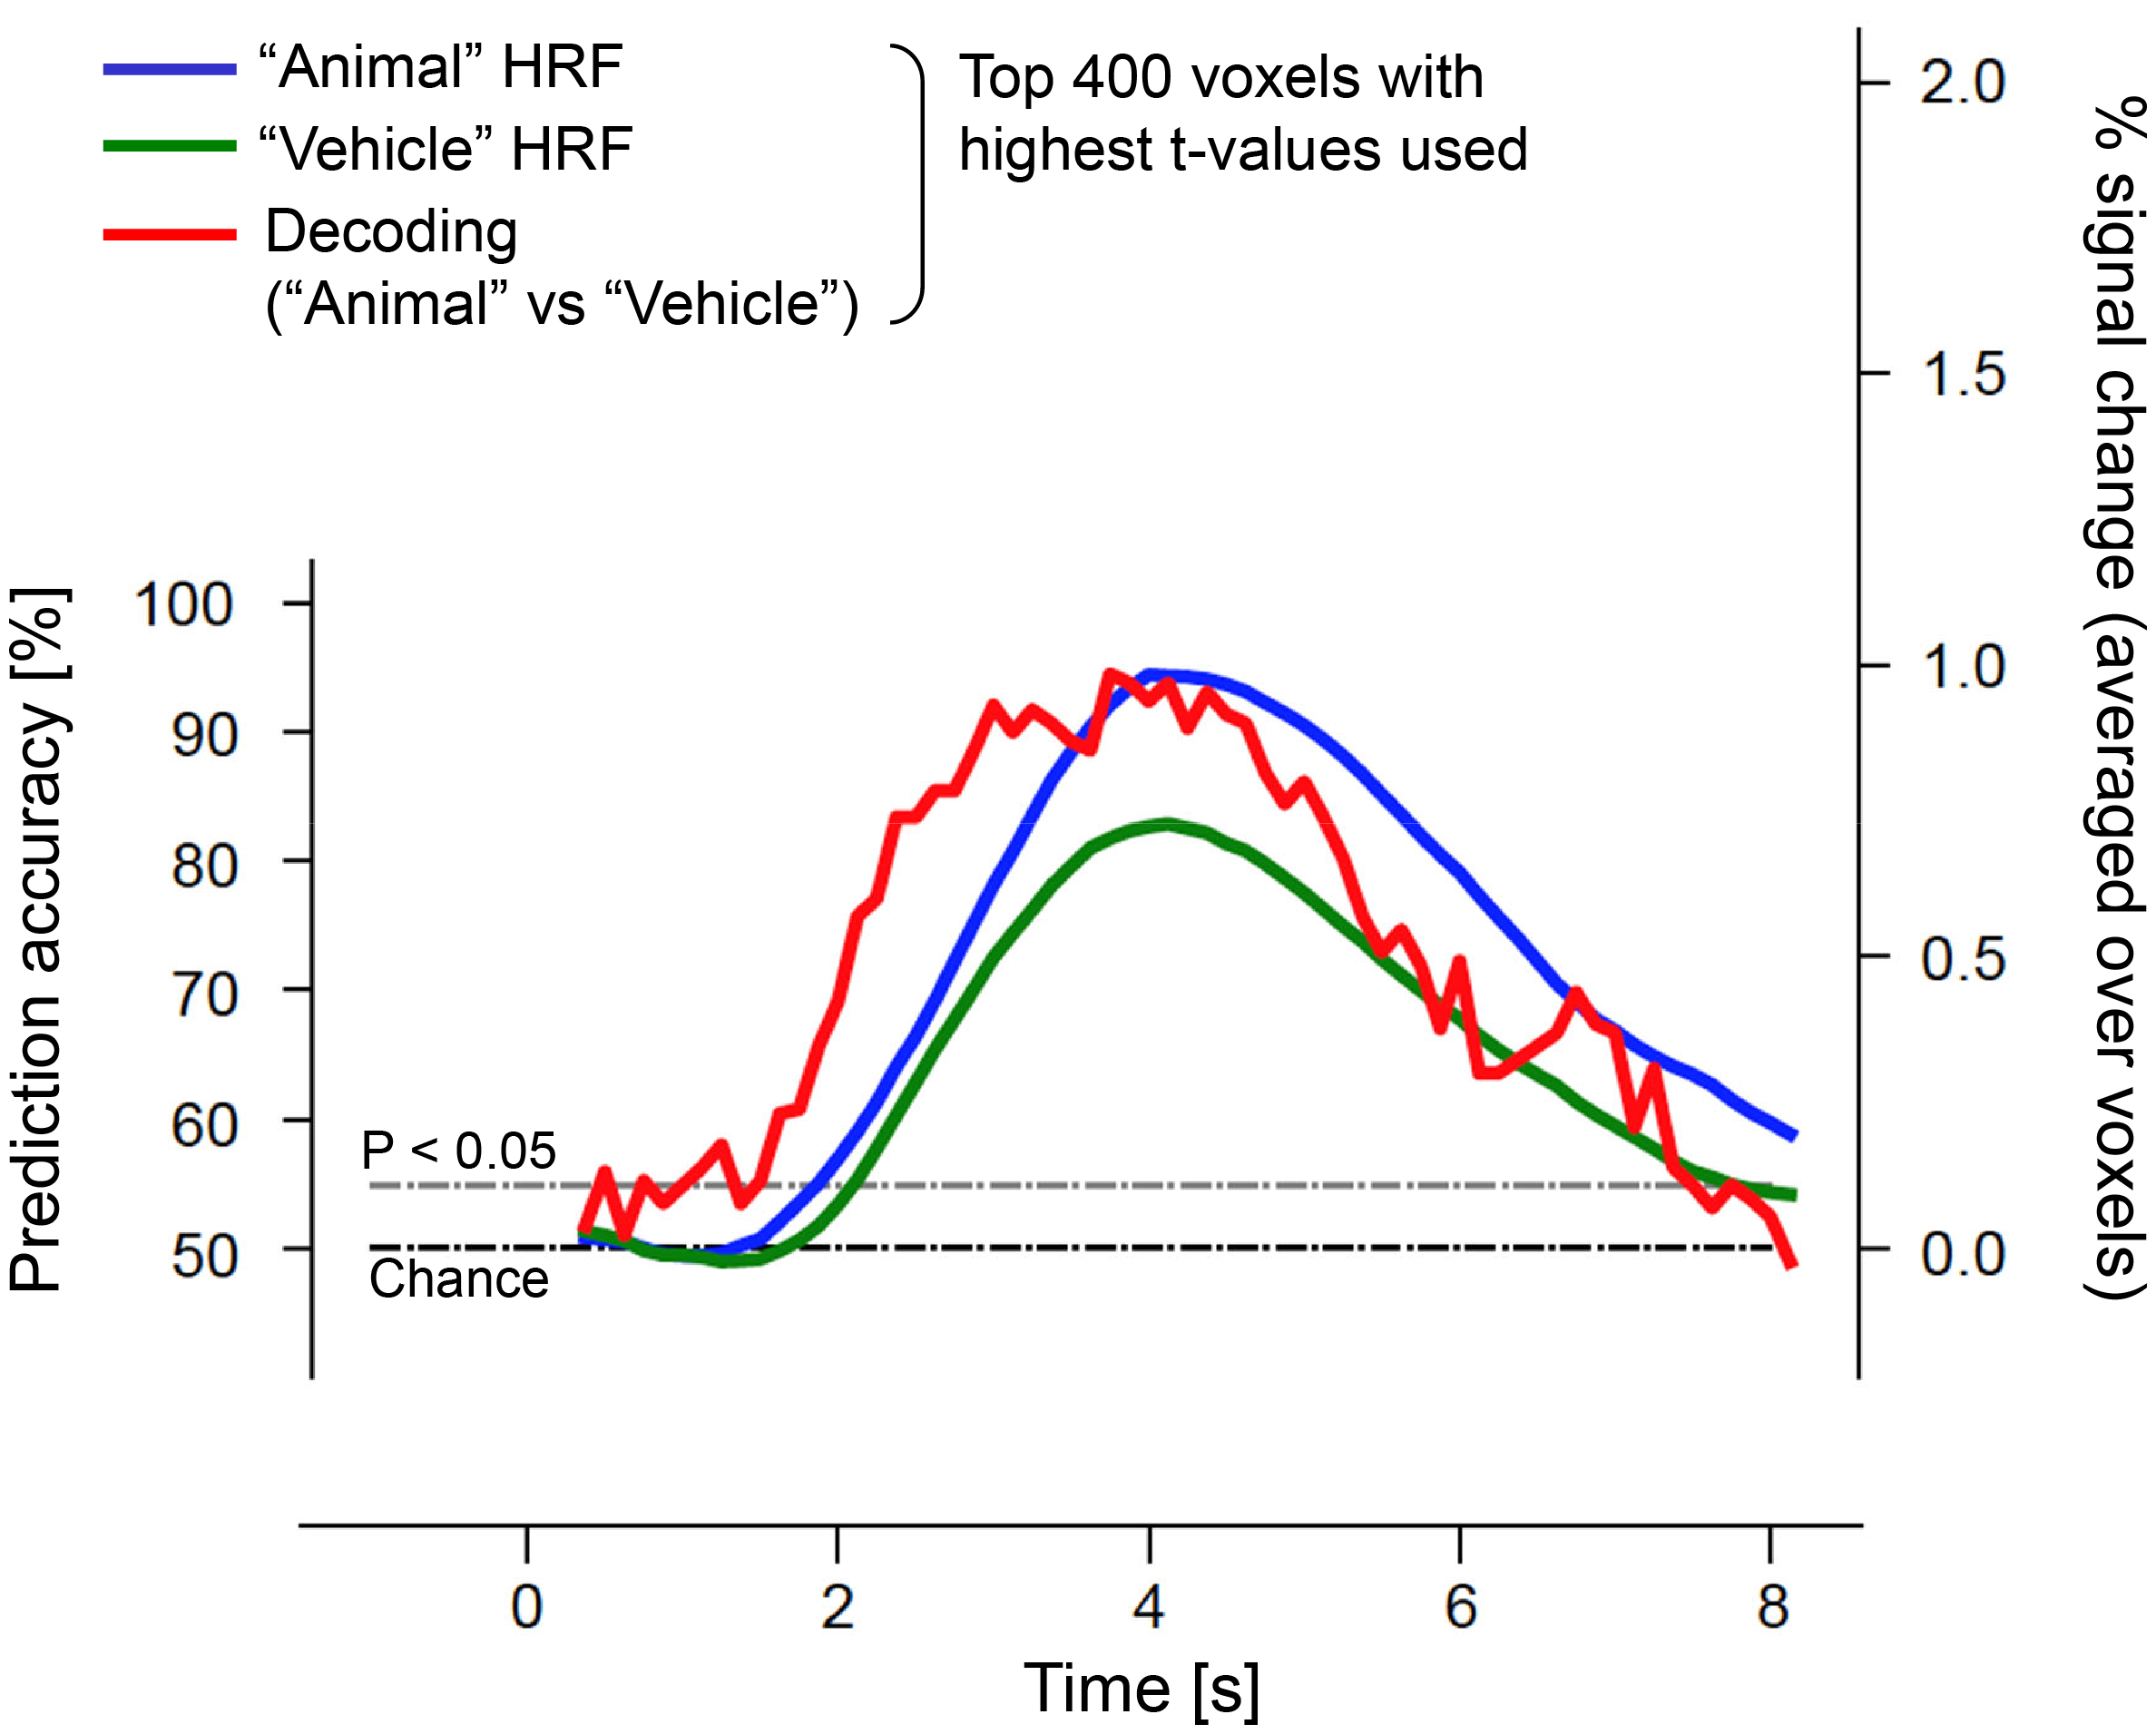
Stimulus prediction accuracy from BOLD signals and
hemodynamic response to the stimulus (an example of participant 2; black dashed line, chance level; gray
dashed line, statistical significance level for prediction accuracy (binomial
test P < 0.05)).
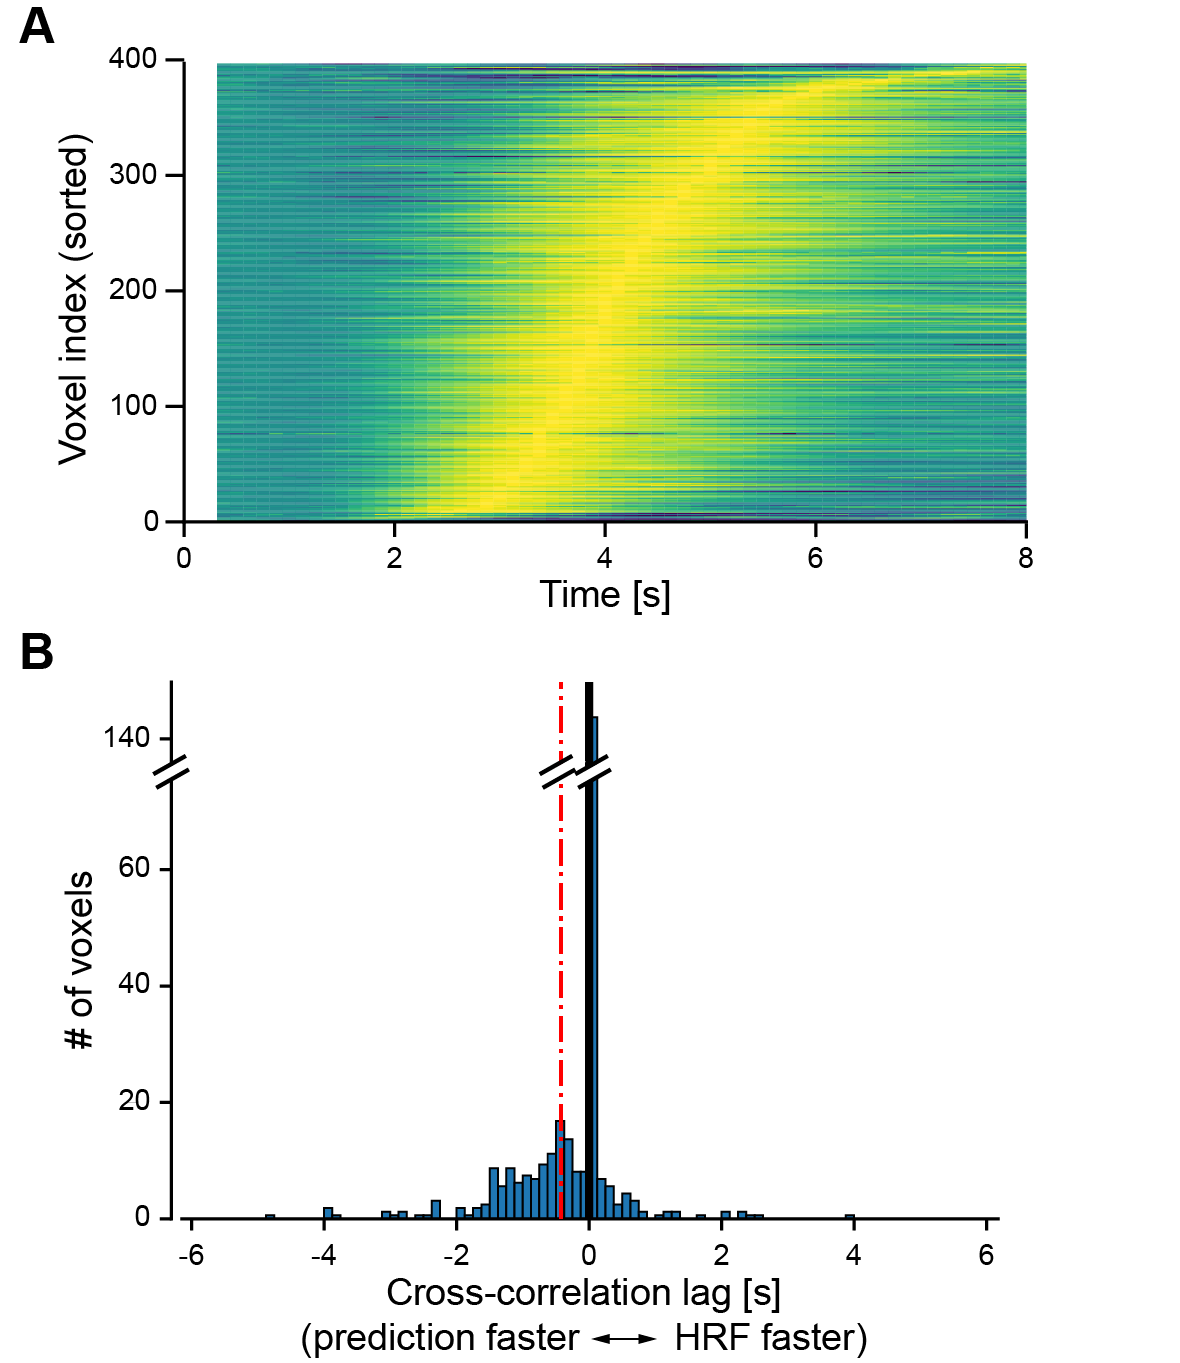
Hemodynamic response latency and precedence of
stimulus prediction. (A) Hemodynamic responses sorted by the peak latency for
each voxel (peak amplitude is normalized). (B) Cross-correlation lags between
the time course of stimulus prediction accuracy and that of the hemodynamic
response of each voxel (black thick line, zero lag; red dashed line, mean of
lags). An example of participant 2 is shown.
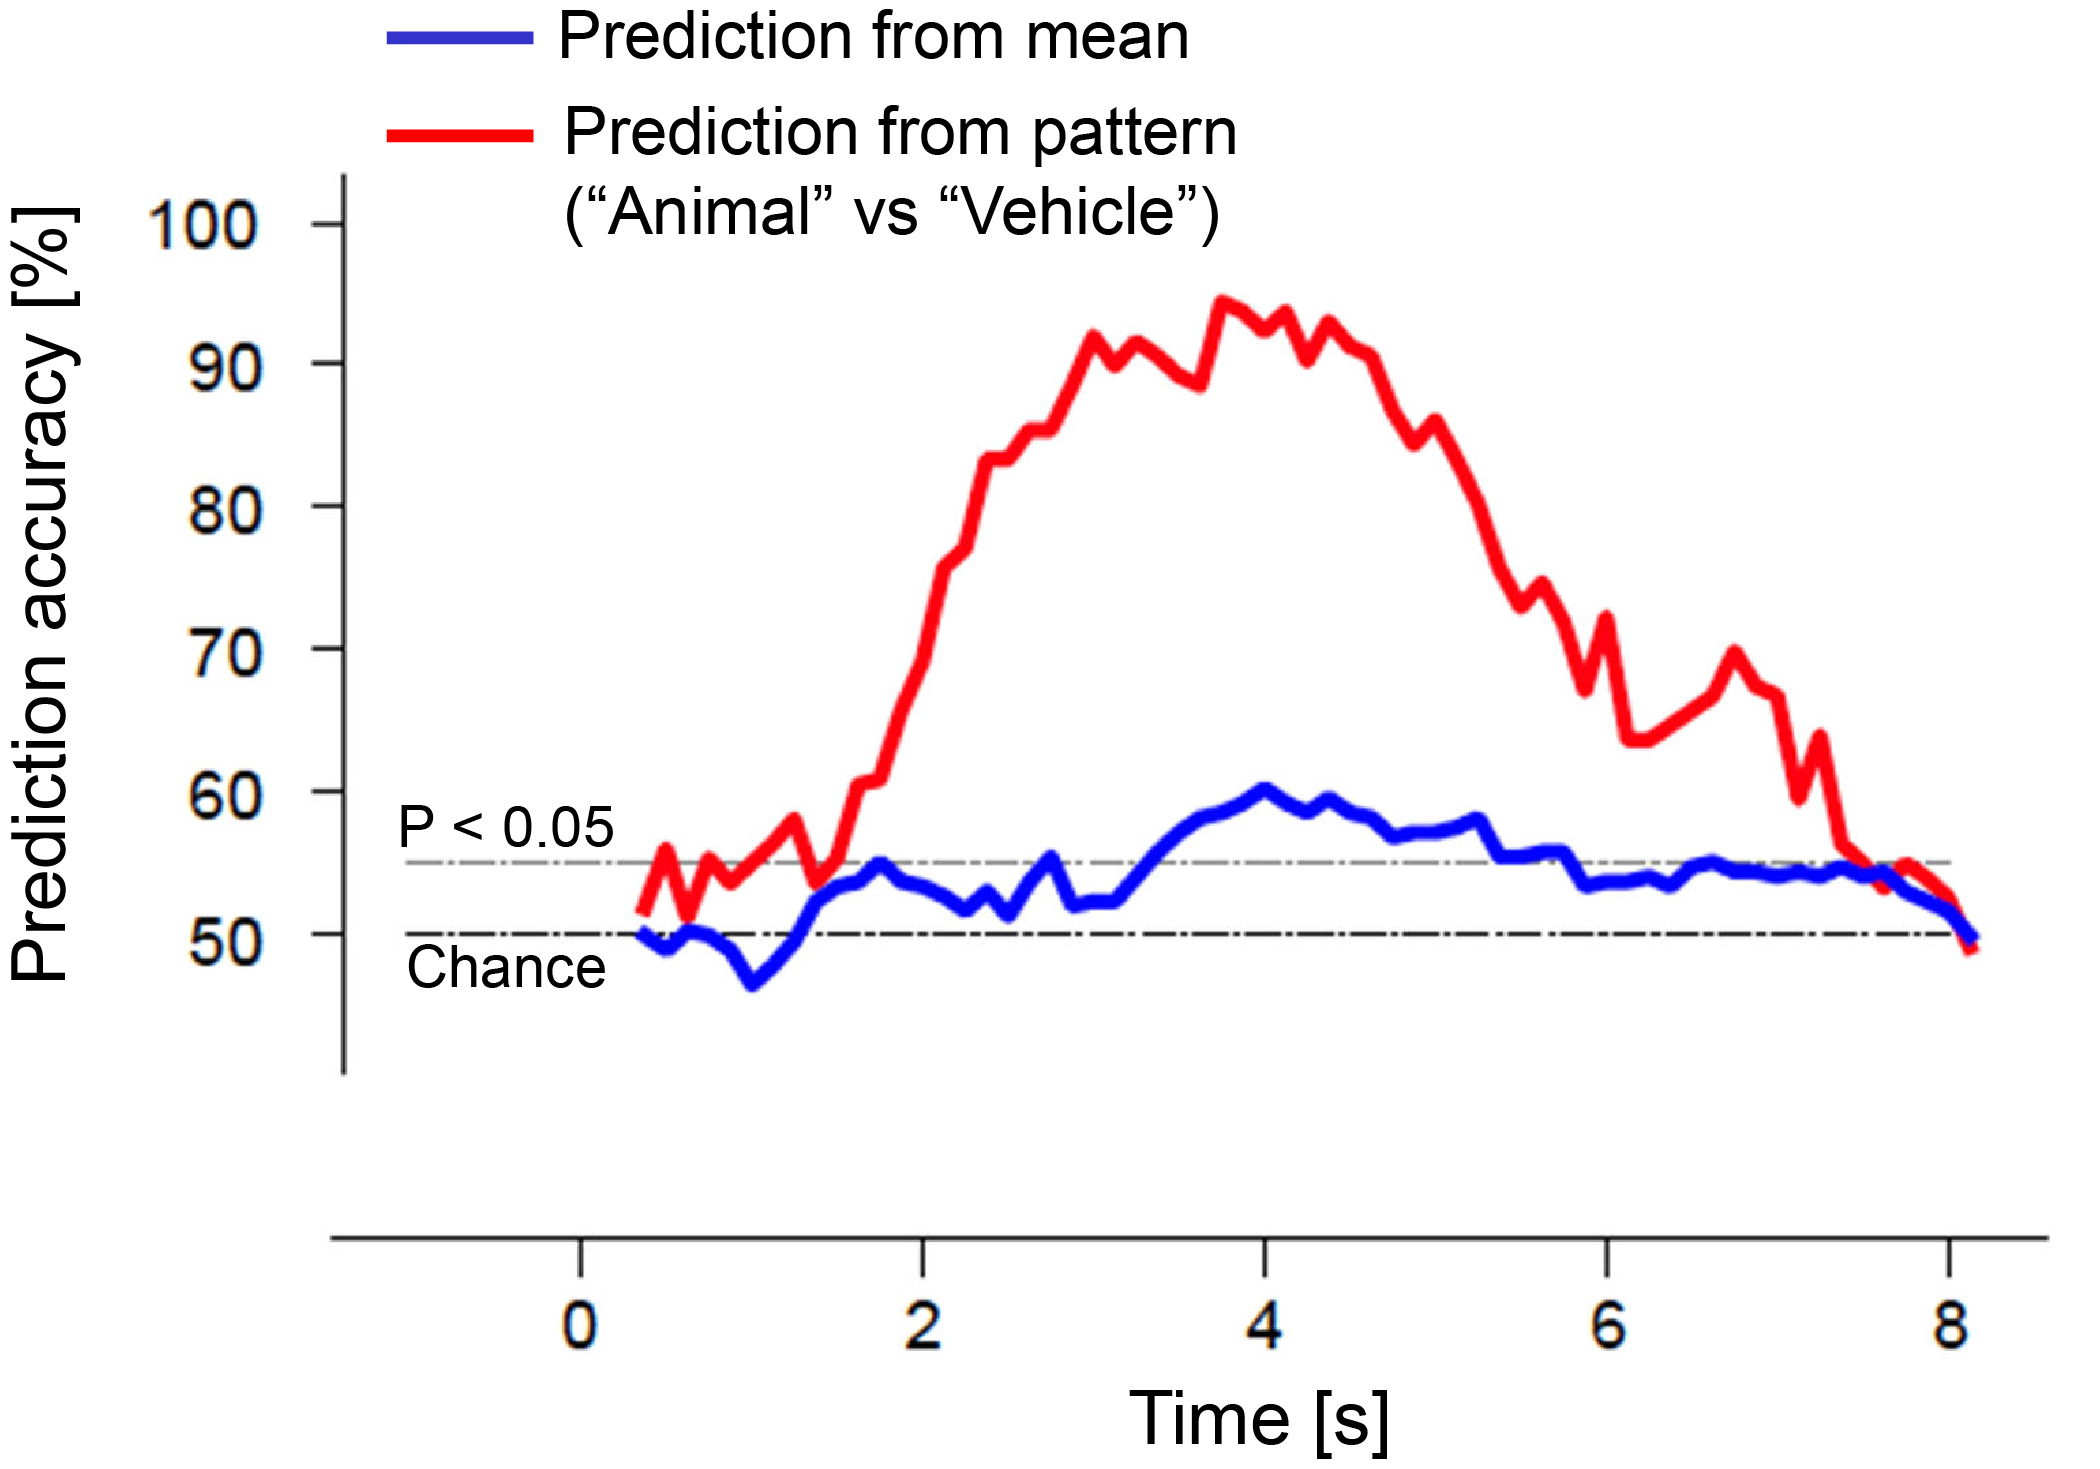
Stimulus prediction from a multivariate pattern and
mean of target voxels (an example of participant 2; black dashed line, chance level; gray dashed line,
statistical significance level for prediction accuracy (binomial test P <
0.05)).