4013
Classification of fMRI Study Participants Using Space-Filling-Curve Orderings of fMRI Brain Activation Maps1Computer Engineering, University of Houston - Clear Lake, Houston, TX, United States
Synopsis
In this work, we develop a 3-D to 1-D ordering methodology for fMRI data, using a space filling curve, which is adaptive to brain's shape. We apply this ordering to fMRI activation maps from a schizophrenia study, compress the data, obtain features, and perform classification of schizophrenia vs normal controls. We compare the classification results with those of linear ordering, which has been the traditional method to convert the 3D fMRI data to 1D.
INTRODUCTION
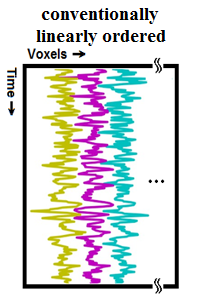
fMRI volumes, which are 3 dimensional (3D) spatially (e.g.a 64×64×64 matrix) , generally have to be converted to arrays of a single dimension (1D), for further analysis (Figure 1), such as analyses with general model, regression, independent component analysis. Traditionally, a linear ordering/mapping of data from 3D to 1D have been used, i.e. 3D data are scanned consecutively along the first, second, third dimensions in order to obtain a 1D ordering of volumes. Linear ordering results in large "jumps" or "discontinuities" of signals, and it does not preserve the structure of the brain in 1D1. By traversing 3D volumes using a space-filling curve (SFC)2-6, which is adaptive to brain's shape, the 3D image can be ordered into 1D space (e.g. 643 ×1 vector for a 64×64×64 volume) which can better preserve the brain's structure in 1D1. Any dimensionality reduction, smoothing, down-sampling, compression, and feature selection or reduction in 1D can benefit from better preservation of information, when compared with linear ordering. In this work, we computed an SFC adaptive to brain's shape (a T1 MRI template image), used it to order fMRI activation maps from 3D to 1D in two groups of participants, schizophrenia patients (SP) and healthy controls (HC), obtained features, and performed classification of participants.METHODS AND MATERIALS
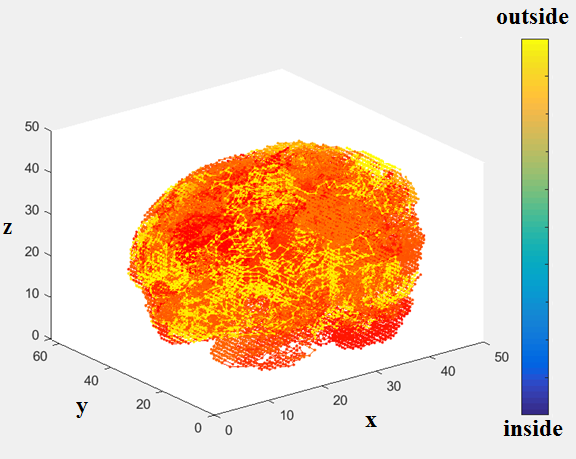
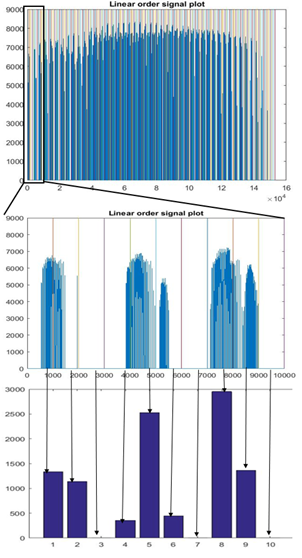
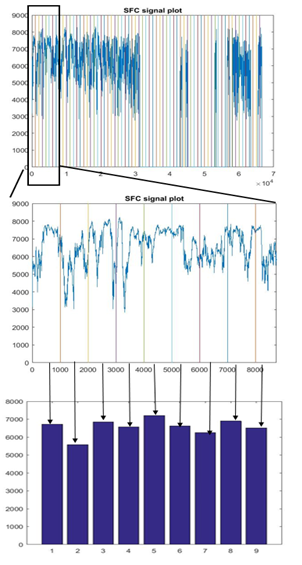
95 schizophrenia patients (SP) and 89 healthy control (HC) participants were scanned using 3T Siemens MRI scanners at four different sites. Research protocol was reviewed and approved by the IRB of the local institutions where scans were performed. Functional data were acquired at four sites with Siemens 3T Trio scanners. Data were collected from each participant while performing a sensorimotor (SM) task. The parameters for the functional scan were: TR/TE = 2s/30ms, bandwidth = ±100 kHz = 3126 Hz/pixel, FA = 90°, slice thickness = 4 mm, gap between slices = 1 mm, voxel size = 3.4 mm × 3.4 mm × 4 mm, FOV = 22 cm, pulse sequence = PACE-enabled, single shot, single-echo echo planar imaging (EPI), scan plane = oblique axial, AC-PC; acquisition matrix = 64 × 64, number of slices = 27, ascending sequential acquisition. Participants performed a sensorimotor (SM) task during the scan. After pre-processing, and normalization to MNI space, the fMRI activation maps computed as standard parametric maps of t-value with the SM task, were resampled to 3mm×3mm×3mm standard MNI space, which resulted in 53x63x46 data matrix. An adaptive space-filling curve (SFC) using a 53x63x46 T1 MRI template in MNI space was computed using a greedy search algorithm developed in house (Figure 2).The 3D fMRI maps from each participant were converted to 1D with linear ordering (Figure 3), and with the comouted adaptive SFC (Figure 4). The 1D arrays were down-sampled by a "bin size" of 100, values were averaged across each bin ("binning", Figures 3 and 4), which constituted raw features. Features were further reduced to 100, and also to 30, by using and support vector machine based feature reduction algorithm. The reduced features were used to train the classification algorithm by using a random 70% of the dataset and were tested on the remaining 30%. The training and testing process was repeated 100 times by using new random selection of training and testing datasets. Average classification accuracies were computed.RESULTS
Figure 3 shows results of linear ordered, zoomed, and binned 1D array, respectively, for a participant; and Figure 4 shows results of SFC-ordered array. Large clusters can be seen in the SFC-ordered array, whereas linear ordering resulted in a highly disconnected or unclustered brain activation signal. Using the SFC ordering, the SVM classification algorithm resulted in 72.1% (74.6%) average accuracy in classification of S vs HC participants, whereas the linear ordering resulted in around 49.9%(50.0%) classification accuracy, using 30 (100) features, employing a sequential forward search algorithm for the reduction of features7. SFC-based ordering resulted in significantly higher accuracy, whereas linear ordering resulted in just chance accuracy. Doing a 4x4x4 down-sampling of the brain activation maps directly in 3D, and then ordering the resulting down-sampled brain with linear ordering, using the resulting signal as features, resulted also with chance accuracy of around 50% for participant classification. Overall, SFC-based classification results were superior.DISCUSSION AND CONCLUSION
A space-filling curve (SFC) adaptive to brain's shape can be utilized to order fMRI data such as brain activation maps in fMRI analyses and it proves to be better than using the traditional linear ordering; in our study, SFC ordering resulted in better features from the activation maps, which resulted in higher classification accuracy of two groups of participants, schizophrenia patients and healthy controls.The results need to be replicated with larger sample sizes or with other fMRI studies. Potential future work also involves using different feature reduction methods and different classification algorithms, and compression of fMRI data based on SFCs.Acknowledgements
This research was supported bu UHCL School of Engineering, and Office of Research and Sponsored Programs. The authors thank Dr. Vince Calhoun for providing fMRI activation map data.References
[1] Sakoglu U, Arslan AN, Bohra K, Flores H, "In Search of Optimal Space-Filling Curves for 3-D to1-D Mapping: Application to 3-D Brain MRI Data", Proceedings of the 6th International Conferenceon Bioinformatics and Computational Biology (BICOB), 61-66, March 2014, Las Vegas, NV, USA (2014).
[2] Hilbert, D.: Uber die stetige abbildung einer linie auf flachenstuck (in German). Math. Annln. 459–460 (1891).
[3] Moon, B., Jagadish, H., Faloutsos, C., Saltz, J.: Analysis of the clustering properties of the Hilbert space-filling curve. IEEE Transactions on Knowledge and Data Engineering 124–141 (2001).
[4] Kontos D, Megalooikonomou V, Ghubade N, Faloutsos C, "Detecting Discriminative Functional MRI Activation Patterns Using Space Filling Curves", Proceedings of the 25th Annual International Conference of the IEEE EMBS, 963-966, September 17-21,2003, Cancun, Mexico.
[5] Griffiths JG: An algorithm for displaying a class of space-filling curves. Software Practice and Experience 16 403–411 (1986).
[6] Wang, Q., Kontos, D., Li, G., Megalooikonomou, V.: Application of time series techniques to data mining and analysis of spatial patterns in 3d images. In:ICASSP. 525–528 (2004).
[7] Alpaydin, E., Introduction to Machine Learning, 2nd Ed., MIT Press, 2011.
Figures