4011
Comparison of Phase Synchrony Analysis and Pearson’s Correlation Coefficient in Resting State fMRI of Rat Brain1National Tsing Hua University, Hsinchu, Taiwan, 2Chang Gung University, Taoyuan, Taiwan
Synopsis
Phase synchrony has been considered as an alternative method to measure connectivity in resting state functional MRI. Our results showed that the data with the correlation coefficient are monotonically increasing, but only when the correlation coefficient is larger than 0.4, phase synchrony and correlation coefficient showed linear dependence. The mappings of default mode network based on two analysis methods are similar in rat brains. However, care should be taken when interpreting data with lower phase synchrony (<0.4), since the phase synchrony of noise is also distributed in the range.
Introduction
Resting state functional MRI (rs-fMRI) can show the amplitude of low frequency fluctuations, which is a fundamental feature of the resting brain. Pearson’s correlation coefficient is a common method to determine the strength of connectivity between different brain regions, and the calculation of correlation between two signals depends both on phases and amplitudes. Recently, researchers proposed that phase coherence may be another method to resolve the synchronization between brain regions. [1] In this study, we performed resting-state fMRI on rats to investigate the relevance of the correlation coefficient and phase synchronization.Theory
The calculation of widely-used connectivity is based on Pearson’s correlation coefficient (CC). As for phase synchrony analysis (PSA)[2], the phase information is first derived by the Hilbert transform, and then the phase synchrony between r1 brain region and r2 brain region is defined by PSr1,r2[t]=1-abs(sin(θr1[t]-θr2[t])), where θr1, and θr2 represented the phase of Hilbert transformed of low-pass filtered signal of r1 and r2, respectively. The sinusoid is aimed to set the PSr1,r2 ranging from 0 (no phase coherence) to 1 (maximal phase coherence).Methods
All protocols were approved by local IACUC. Adult male Sprague-Dawley rats (350–420 g, n=7) were used in this study. MRI experiments were performed on 7-Tesla Bruker ClinScan scanner. For functional scans, 300 consecutive volumes with 15 coronal slices were acquired using gradient echo EPI with TE/TR = 20 ms/1000 ms, FOV = 30 × 30 mm2, matrix size = 64 × 64, and slice thickness = 1 mm. Animals were anesthetized with 2% isoflurane mixed with O2 at flow rate of 1L/minute for inserting a catheter into the tail vein. The isoflurane was immediately disconnected after intravenous injection 0.05 mg/kg Dexdomitor® and left to recover from isoflurane for 15 minutes before MRI scan.Results
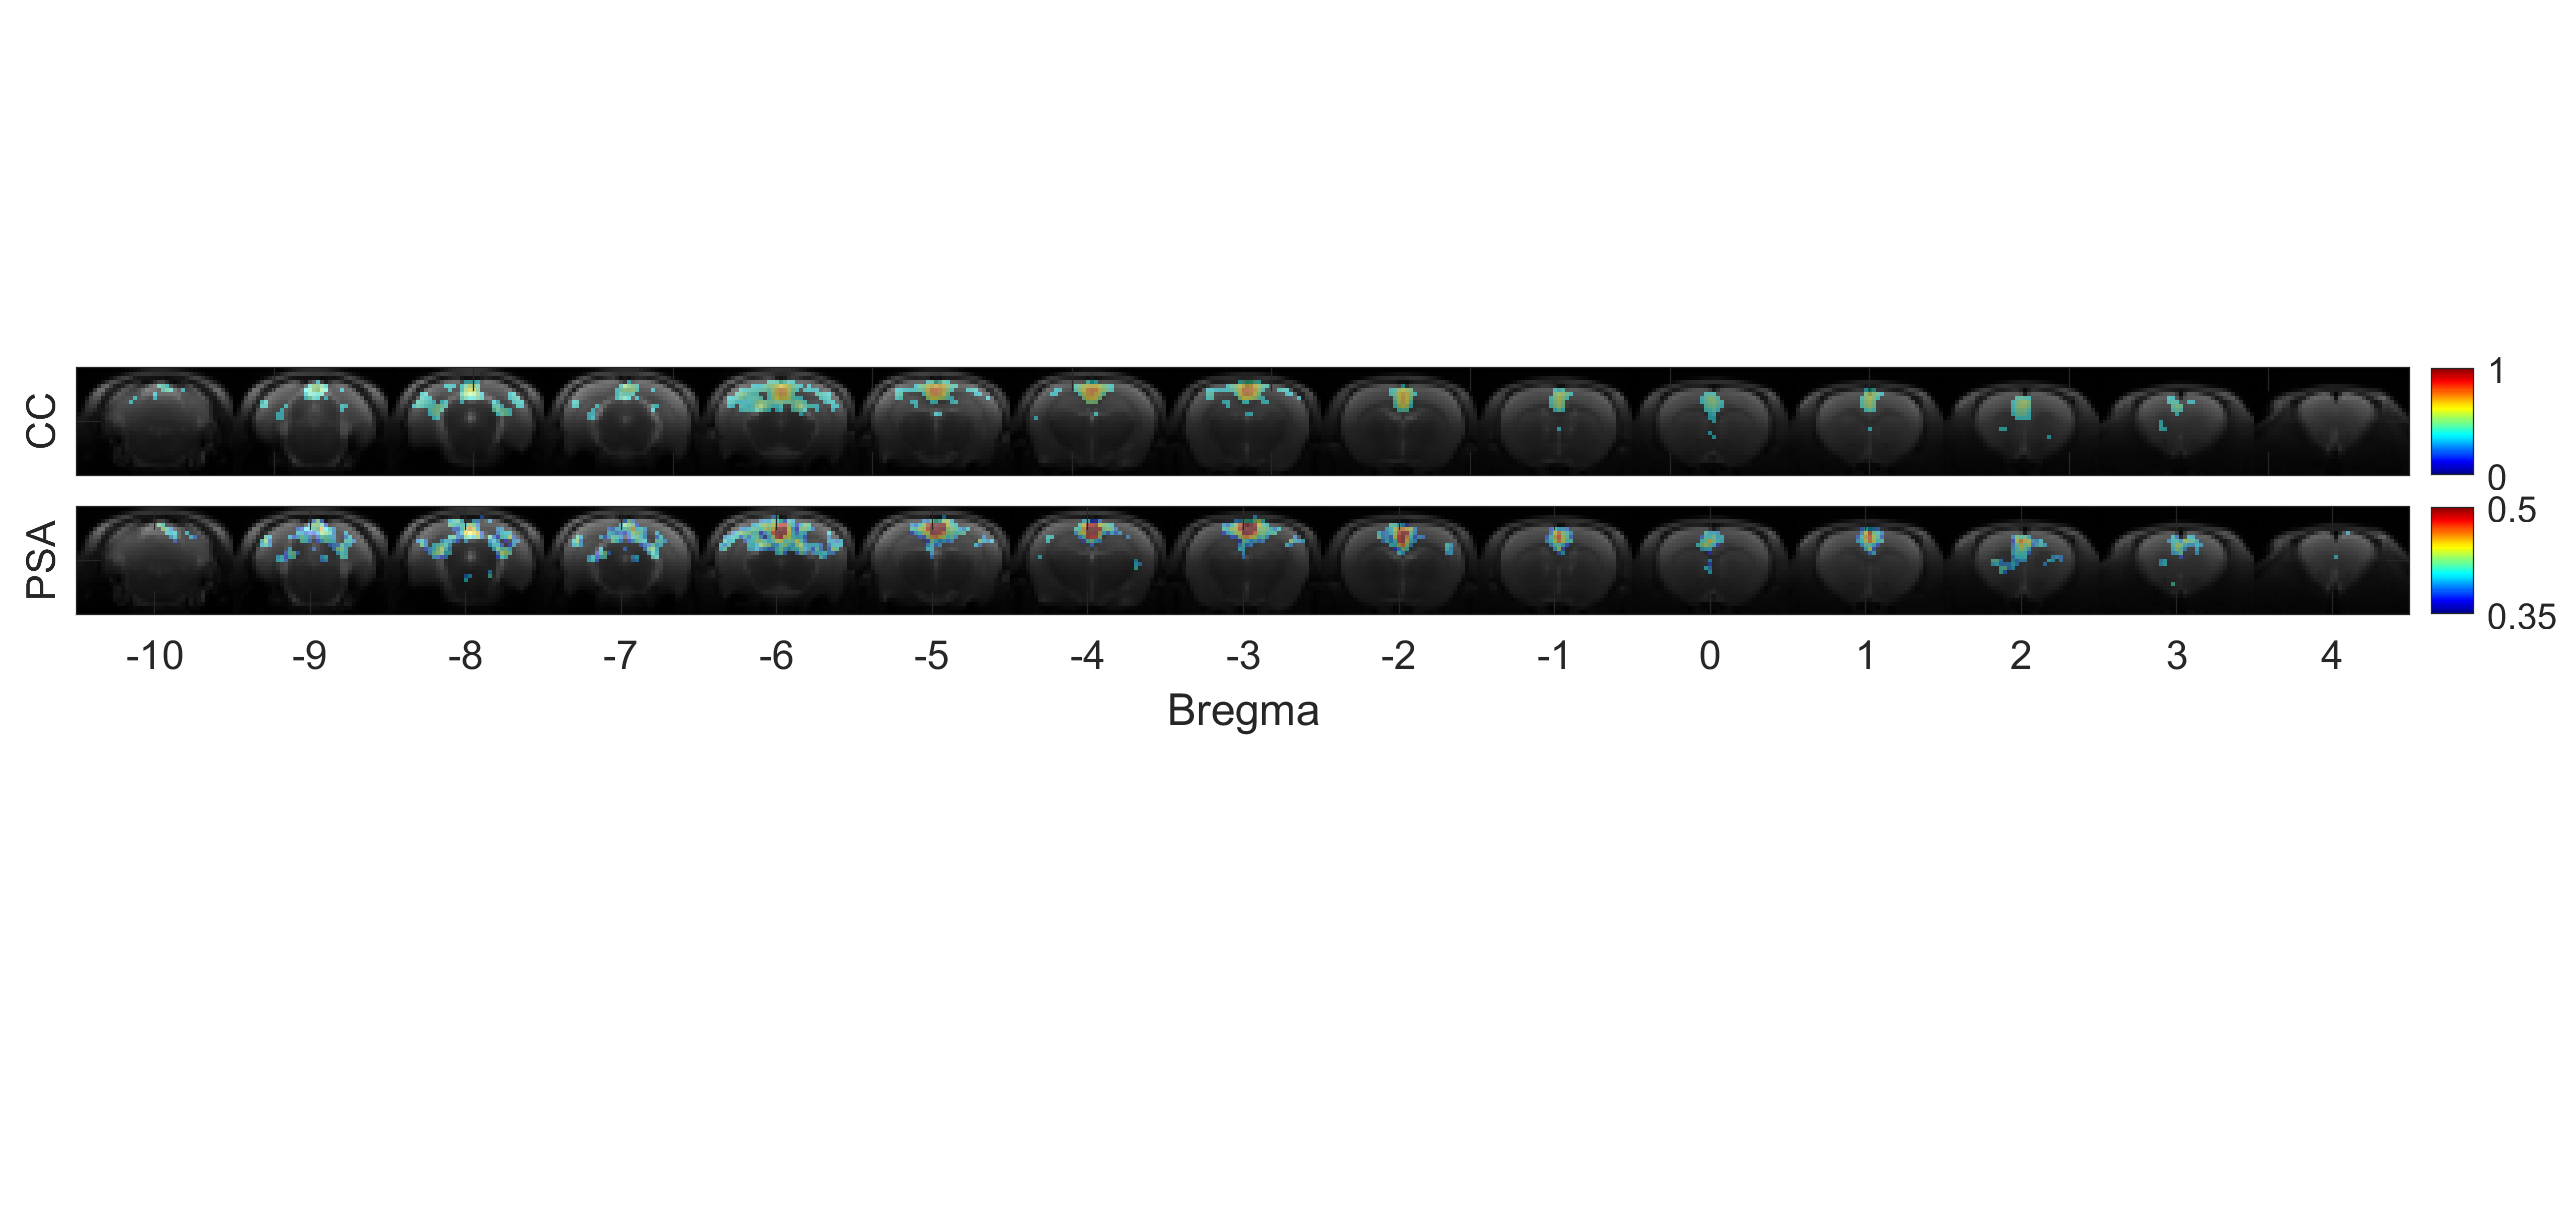
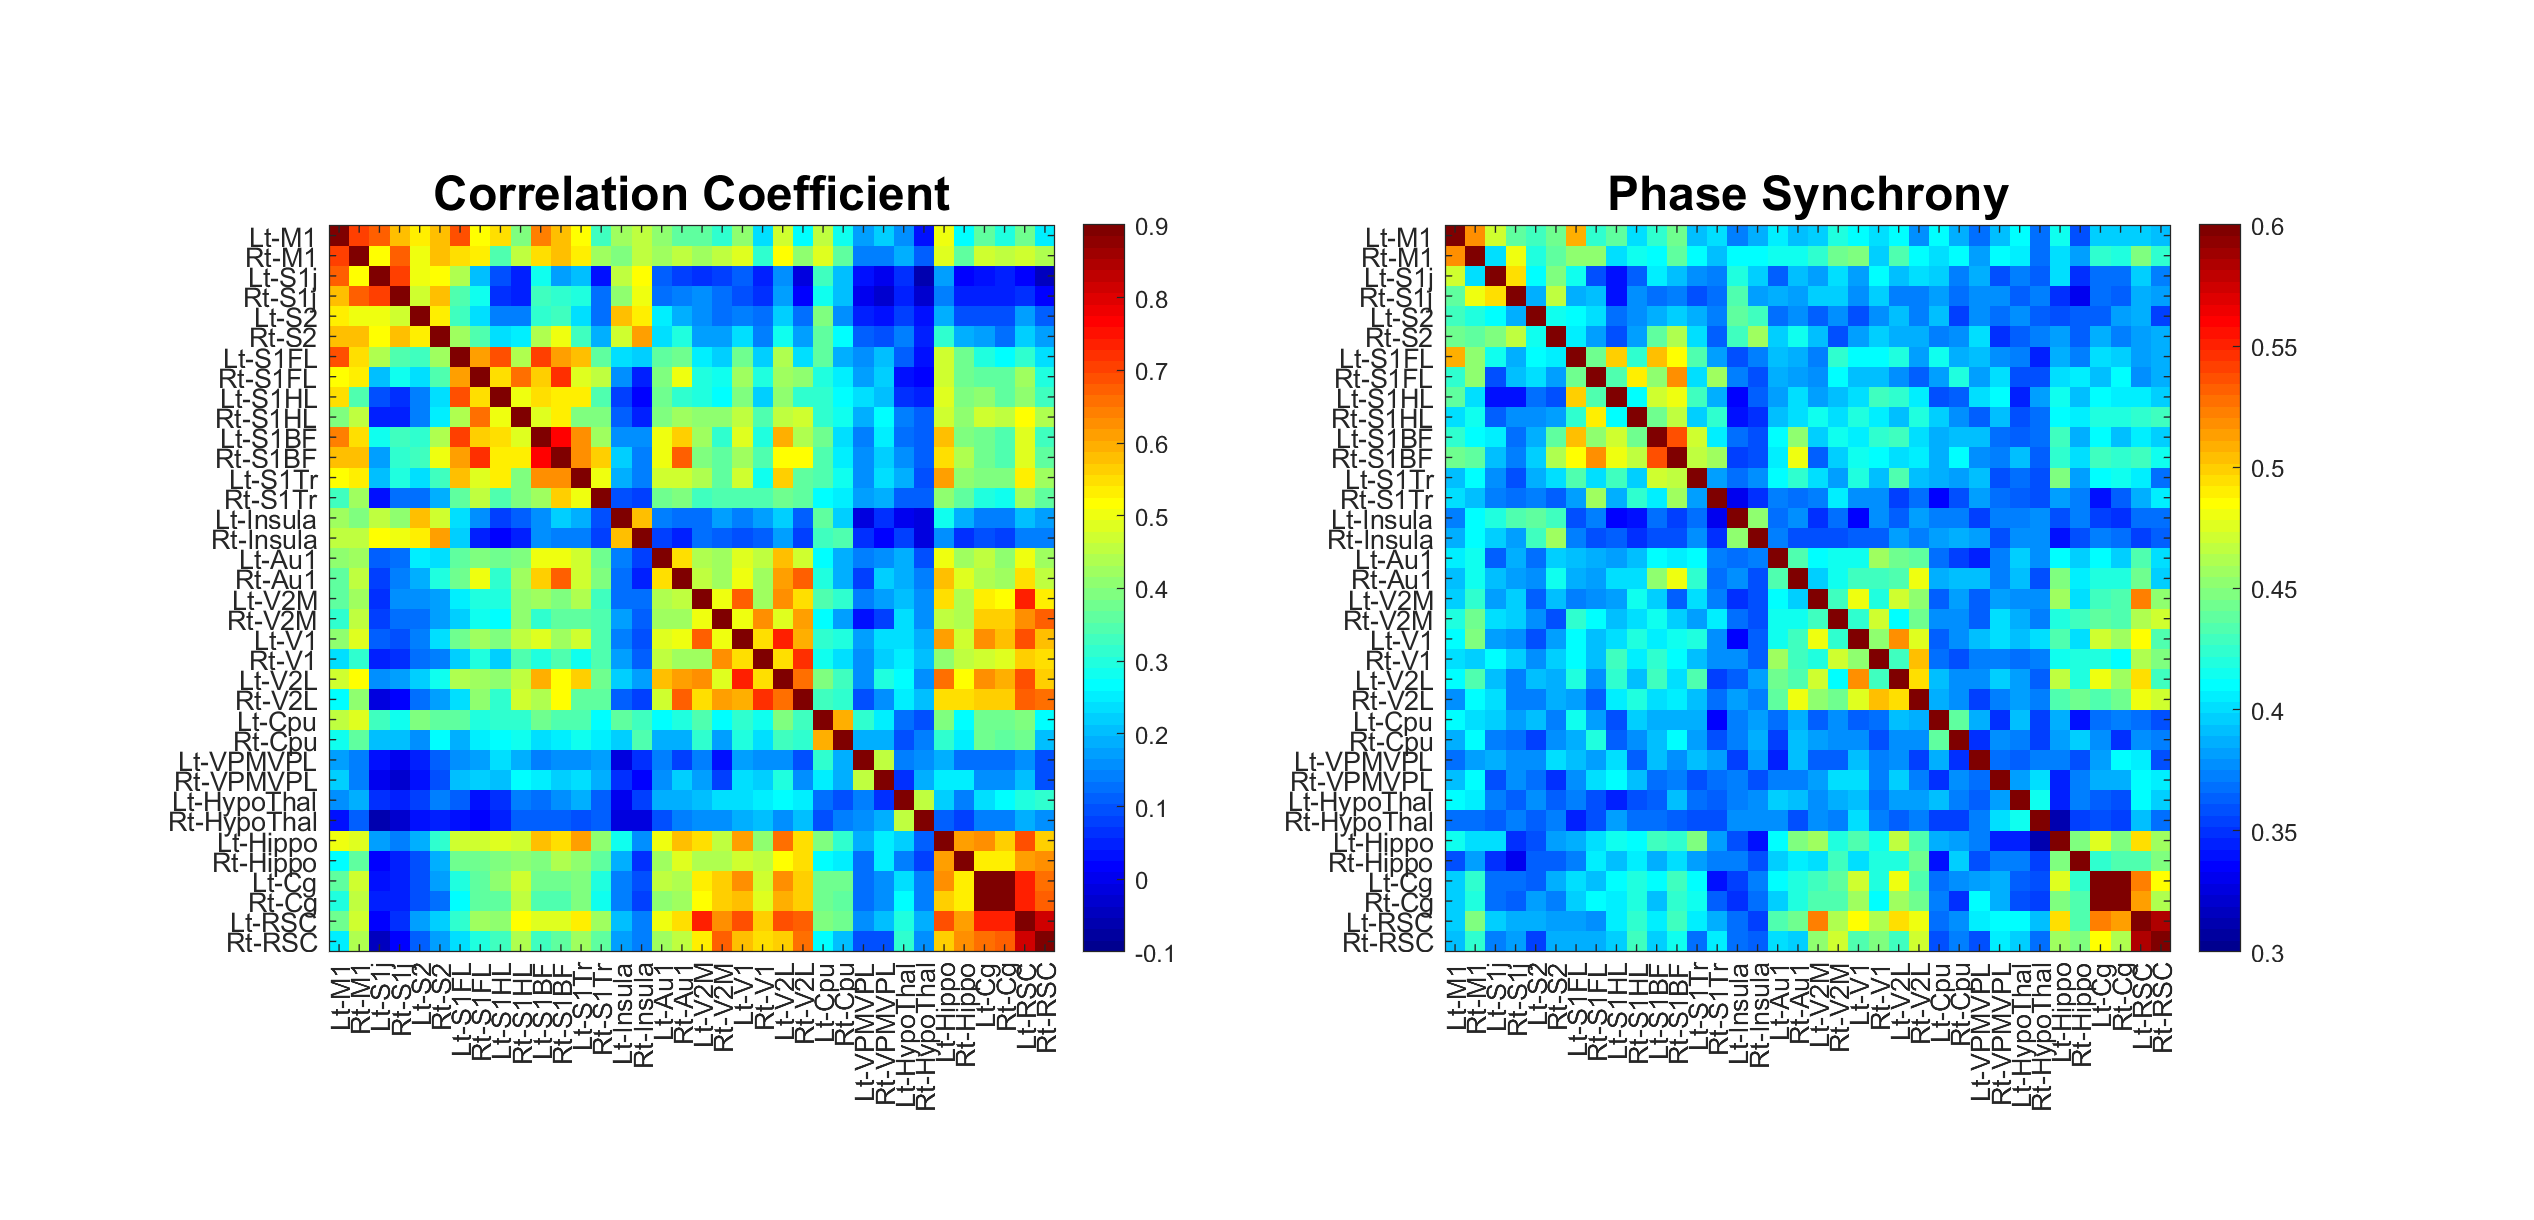
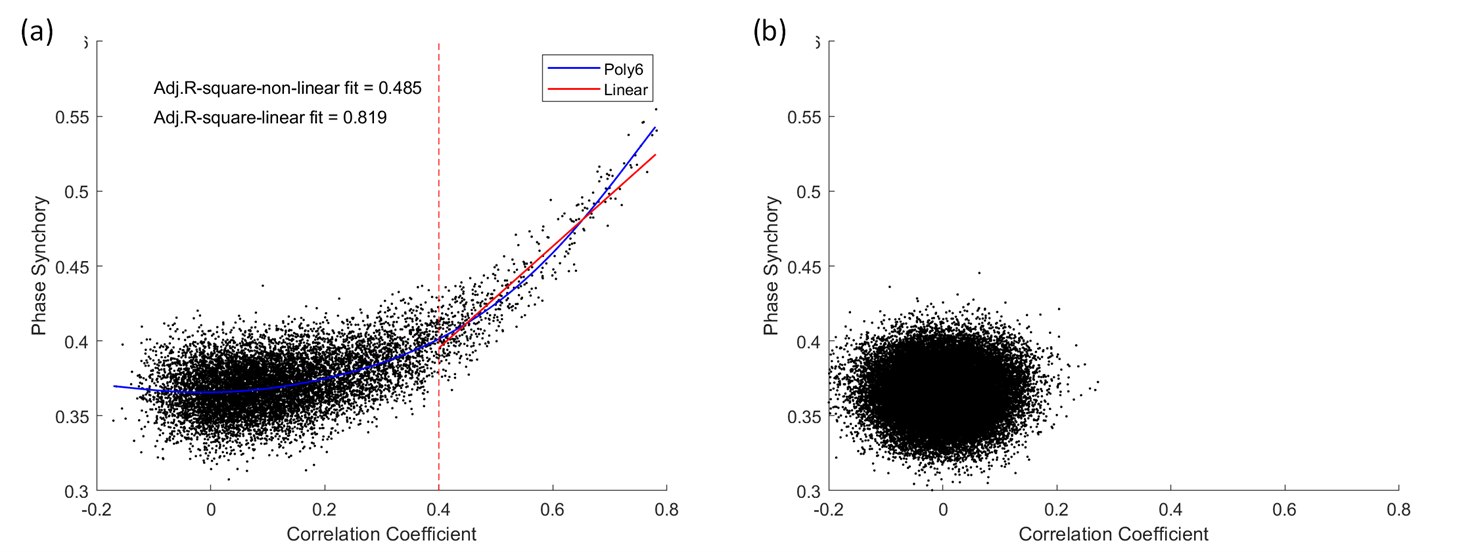
To compare the distribution of seed mapping under resting state, we chose RSC of rat brain as the seed for default mode network (DMN) mapping. The CC based seed mapping (threshold: CC>0.35) was shown in the upper row in figure 1, and its spatial distribution is very similar to the PSA based seed mapping (threshold: PS>0.4) in the lower row in figure 1. The dice coefficient of two seed mappings is 0.701. We chose 36 regions of interested to create a 36*36 matrix based on correlation coefficient and phase synchrony. Two matrices showed the similar pattern of intensities. Scatter plot was further shown in figure 3a to demonstrate the relevance of CC to PS in brain. The fitted hexic polynomial showed monotonically increasing relation for CC>0. In contrast, if we set a threshold of CC>0.4, a linear fitting curve could be found with R square of 0.819. In figure 3b, we further showed the scatter plot of noise in the air region of image. The PS of noise scattered between 0.32 to 0.4 while the absolute value of CC was smaller than 0.15. The results indicated that weakly correlated signals (0.15<CC<0.4) and irrelevant signals could not be differentiated by PSA for resting-state analysis,.Discussions
We demonstrated that the PSA is feasible for analysis of DMN of rat brain, and the spatial distribution of PSA based DMN is similar to the CC based DMN in our result with appropriate threshold. The similar patterns of correlation matrix and synchrony matrix also support that the phase information of signals could be used for connectivity analysis of resting-state network. A linear relation between CC and PS was found when CC>0.4 . However, without the information of amplitude, the ability of noise rejection may be hampered. When CC is in a lower range of 0.15 to 0.4, the PSA could not differentiate them with pure noise. Our result suggested that, when using PSA for brain connectivity, care should be taken for brain regions with weak correlation. Further improvement of noise rejection is needed for the PSA method.Conclusion
Our study suggested that PSA seed mapping with appropriate threshold has the similar result of spatial distribution, as compared to CC seed mapping. As for signals with smaller phase synchrony, further filter is needed to distinguish the weakly relevant signal from the noise.Acknowledgements
We thank the instrument support from Center for Advanced Molecular Imaging and Translation, Chang Gung Memorial Hospital, Linkou.References
1. N. Gravel, et al., Phase-synchronization-based parcellation of resting state fMRI signals reveals topographically organized clusters in early visual cortex. NeuroImage, 2017. 170: p. 424-433
2. Pedersen, M., et al., On the relationship between instantaneous phase synchrony and correlation‐based sliding windows for time‐resolved fMRI connectivity analysis. NeuroImage, 2018, 181: p. 85–94.
Figures