4010
Performance of Temporal and Spatial ICA in Identifying and Removing Physiological Artifacts in resting-state fMRI1University of Toronto, Toronto, ON, Canada, 2Rotman Research Institute at Baycrest, Toronto, ON, Canada, 3Department of Biophysics, University of Toronto, Toronto, ON, Canada
Synopsis
Independent component analysis (ICA) has been used to identify and remove confounding factors in fMRI data. While spatial ICA (sICA) is more typical for fMRI, temporal ICA (tICA) can better distinguish between temporally independent but spatially overlapping components compared to sICA. We investigate if tICA and sICA perform differently in identifying different physiological components of the resting-state fMRI (rs-fMRI) signal. Our results show that noise sources with widespread effects across brain (e.g. PETCO2, FD, DVARS) are better identified by tICA. However, sICA performed significantly better than tICA in removing the effects of affine head motion parameters.
Introduction
Independent component analysis (ICA) has been used to identify and remove noise sources in fMRI data [1,2]. Spatial ICA (sICA) is more typical for fMRI [3], whereas temporal ICA (tICA) is more typical for high-temporal resolution data (e.g. EEG). Recent developments in multiband fMRI enables acquisitions at much higher temporal resolution, making tICA more feasible. While tICA and sICA largely generate similar results, they diverge if the components (ICs) are temporally or spatially dependent [4]. Intuitively, tICA can better distinguish between temporally independent but spatially overlapping components [4–6]. Since different physiological signals have overlapping regions of influence, we hypothesize that tICA and sICA perform differently in identifying different physiological components of the resting-state fMRI (rs-fMRI) signal.Method
Data acquisition: 19 healthy subjects (age = 26.5 ± 6.5 years) were scanned using a Siemens TIM Trio 3T scanner. rs-fMRI scans were collected using SMS-EPI BOLD (TR/TE = 380/30 ms, FA = 40°, 20 5-mm slices, 64x64 matrix, 4x4x5 mm voxels, multiband factor = 3, 1,950 volumes). During each scan, end-tidal CO2 pressure (PETCO2) were monitored using a RespirActTM system (Thornhill Research, Toronto). Cardiac pulsation was recorded using the scanner pulse oximeter, whereas the respiratory signal was recorded using a BiopacTM system (Biopac Systems Inc. California).Preprocessing: The rs-fMRI processing includes: motion correction, spatial smoothing (5mm FWHM), and high-pass filtering (> 0.01 Hz). For sICA, fast ICA [7] is used to divide fMRI data into 30 spatial components. For tICA the data dimension is first reduced to 100 components using spatial ICA and then tICA [7] is performed on the 100 time-series to generate 30 temporal components.
Physiological denoising: Cardiac-rate variation (CRV) is calculated as the average heart rate over a 4 second moving window [8]. Respiratory-volume variability (RVT) is defined as the ratio of breathing depth to breathing period [8,9]. PETCO2 is calculated by finding the peak CO2 in each breathing cycle [10]. Subject-specific response functions for PETCO2, RVT, and CRV are obtained from the whole-brain global signal [10,11] and each signal is convolved with its corresponding response function. Six affine head motion parameters were generated using FSL’s MCFLIRT [12], as well as framewise displacement (FD). DVARS and SVAR are signal-variability parameters estimated using a MATLAB script provided by [13].
Step 1: Artifact identification. Correlation between each physiological signal and the time course of each of the 30 ICs is calculated. Noise-related ICs are defined as those that are significantly correlated with the physiological signals (p < 0.05 corrected for multiple comparisons). The null distribution is generated by calculating the correlation between a specific component and 5000 permutations of the physiological signals (same power spectrum but with shuffled phase). The ideal ICA denoisning should a) confine artifacts to the fewest ICs, and b) produce noise-related ICs that are well accounted for by the physiological signals (high R2), which should in turn be minimally related to the noise-non-related components (low R2).
Step 2: Artifact correction. For sICA and tICA, noise-related and noise-non-related ICs are combined to reconstruct “artifact” and “cleaned” datasets. The “cleaned” dataset is further decomposed into 30 components using sICA. The effectiveness of artifact removal is evaluated by comparing the association between the physiological signal and the sICs generated from the original data (before artifact removal) and the sICs generated from “cleaned” data. If an artifact removal was successful, fewer ICs from “cleaned” data should exhibit high R2 with the physiological signals, and the R2 between the ICs and the physiological signals should be reduced.
Results
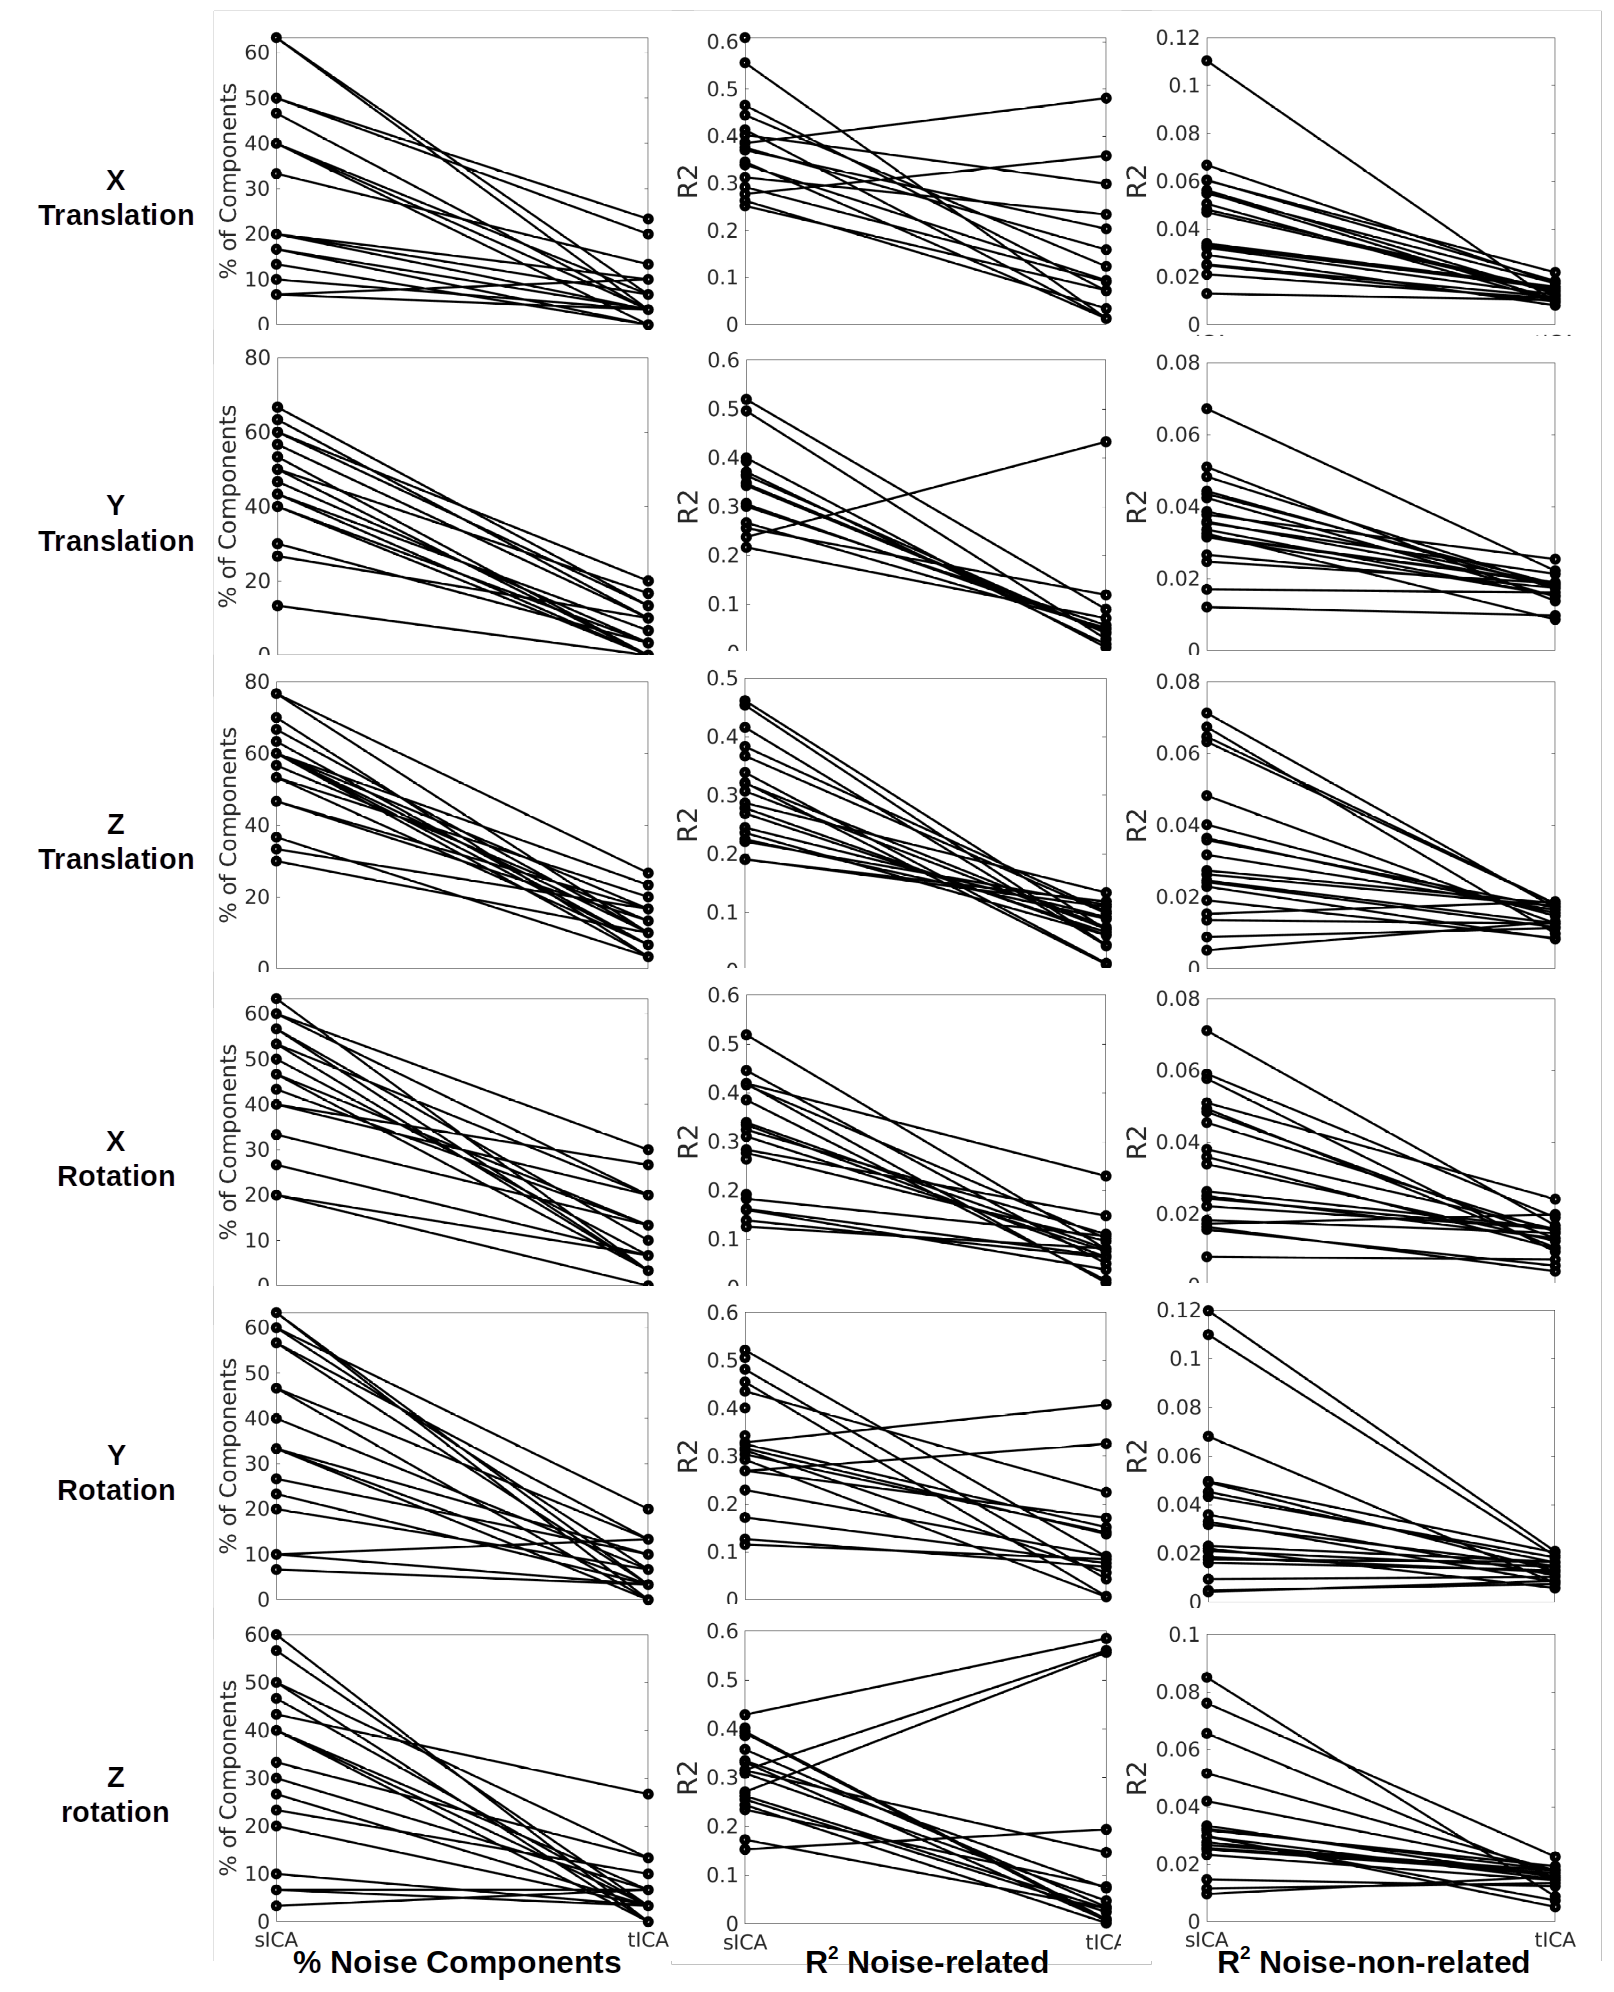
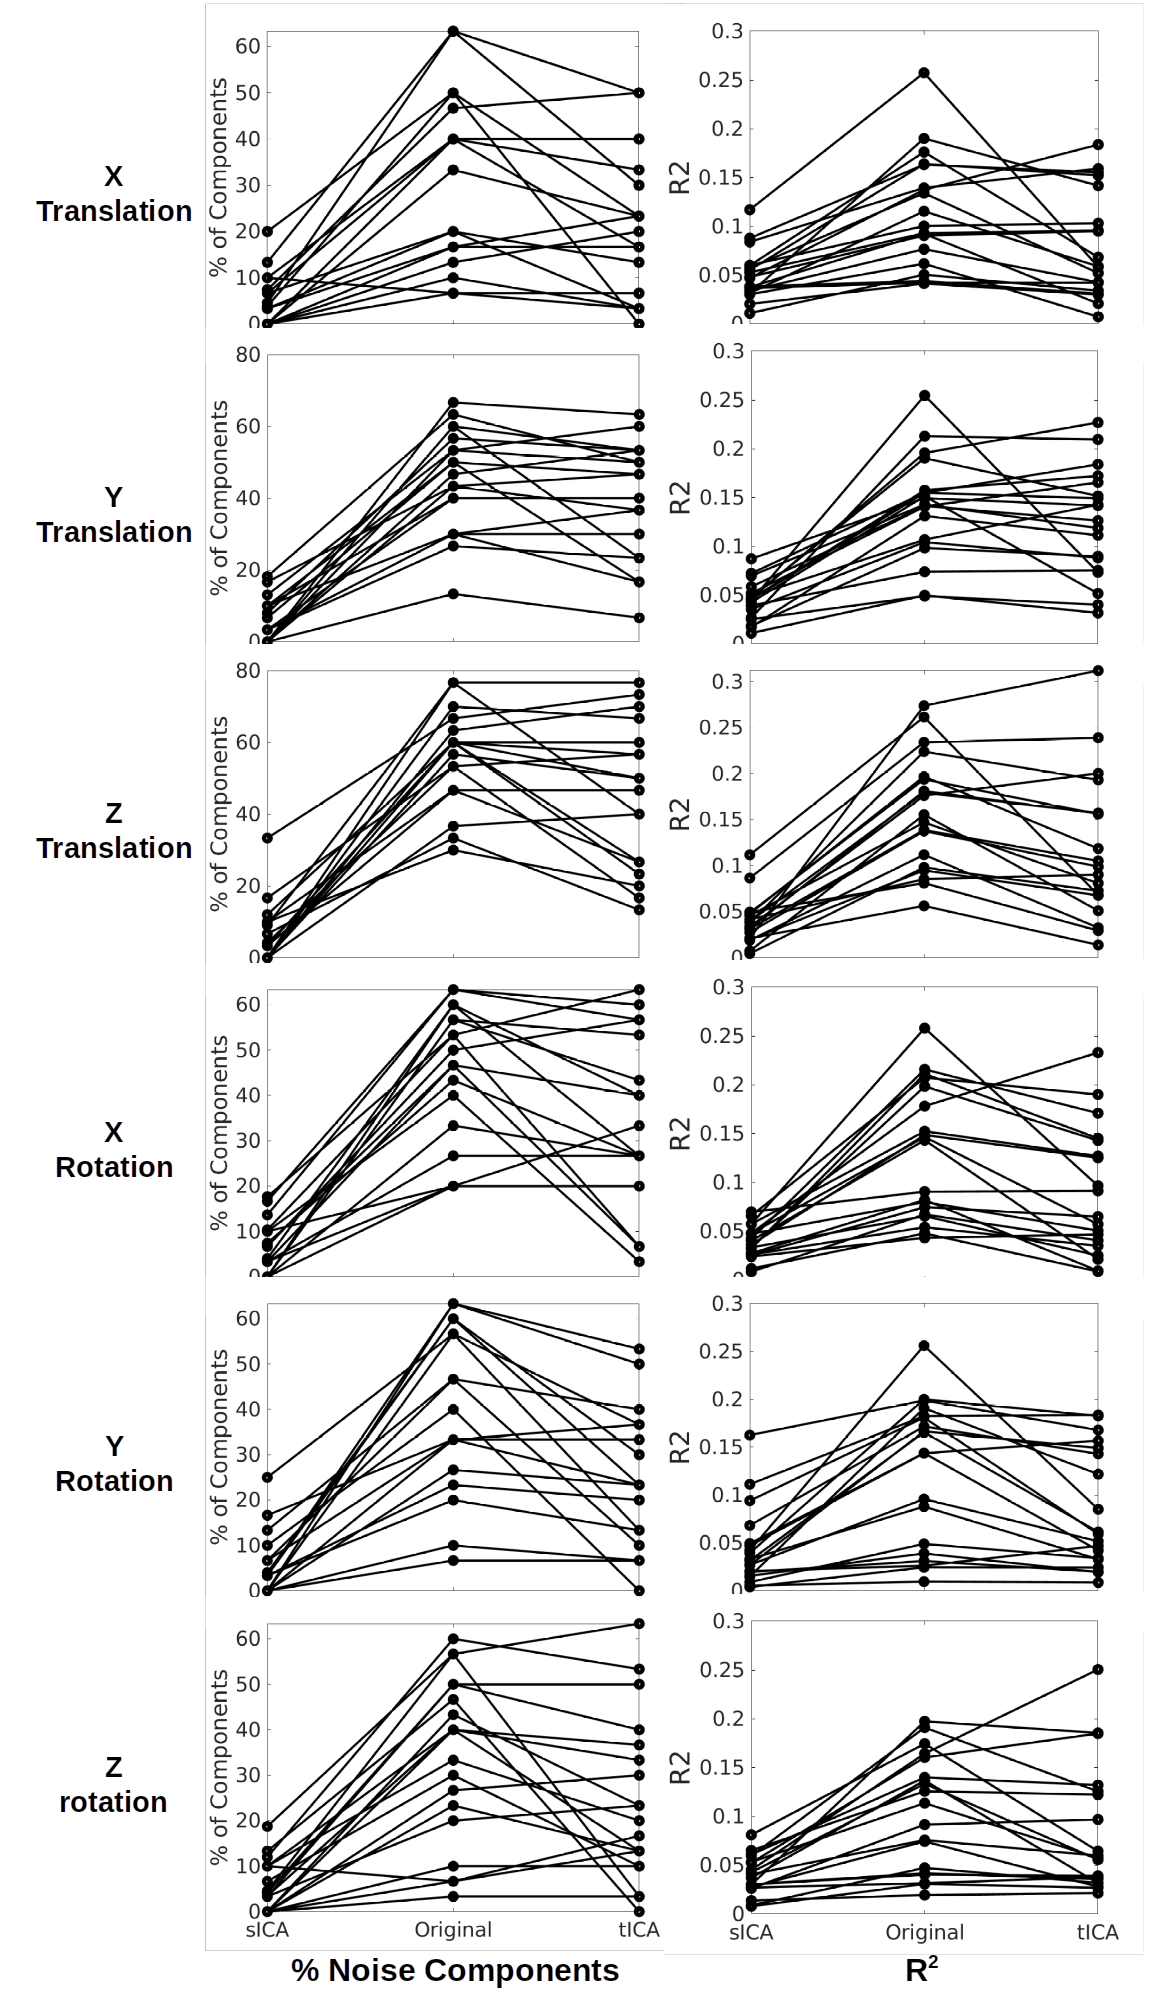
Artifact identification: tICA outperforms sICA in detecting PETCO2 signal as significantly fewer tICs are correlated with the PETCO2 compared to sICA, although the corresponding mean R2 is comparable between the two methods (Figure 1). However, the noise-non-related tICs have significantly lower PETCO2-driven R2 compared to their sICs. Significantly fewer tICs are related to CRV and RVT compared to sICs (Figure 1). Also, the noise-related tICs have lower correlation with CRV and RVT than the sICs. tICA outperforms sICA in separating FD, DVARS, and SVAR into fewer components (Figure 1). The number of ICs affected by the affine head motion time series signals is significantly lower in tICA compared to sICA. However, correlation between the motion signals and noise-related components is significantly lower in tICA (Figure 2).Artifact removal: The performance of tICA and sICA in PETCO2 removal is comparable (Figure 3). Both methods significantly reduced the number of ICs related to PETCO2 and significantly reduced the correlation between PETCO2 and sICs in the “cleaned” data. For CRV and RVT, both tICA and sICA reduced the number of noise-related components and average correlation between the ICs and the signals. For FD, DVARS and SVAR, the performances of tICA and sICA are comparable (Figure 3). For affine motion parameters sICA considerably reduced the number of related ICs (Figure 4).
Discussion
This study shows that noise sources with widespread effects across brain (e.g. PETCO2, FD, DVARS) are better identified by tICA. However, sICA performed significantly better than tICA in removing the effects of affine head motion parameters.Acknowledgements
No acknowledgement found.References
1- Salimi-Khorshidi G, Douaud G, Beckmann CF, Glasser MF, Griffanti L, Smith SM. Automatic denoising of functional MRI data: combining independent component analysis and hierarchical fusion of classifiers. Neuroimage. 2014;90: 449–468.2.
2- Pruim RHR, Mennes M, van Rooij D, Llera A, Buitelaar JK, Beckmann CF. ICA-AROMA: A robust ICA-based strategy for removing motion artifacts from fMRI data. Neuroimage. 2015;112: 267–277.3.
3- Smith SM, Miller KL, Moeller S, Xu J, Auerbach EJ, Woolrich MW, et al. Temporally-independent functional modes of spontaneous brain activity. Proc Natl Acad Sci U S A. 2012;109: 3131–3136.4.
4- Calhoun VD, Adali T, Pearlson GD, Pekar JJ. Spatial and temporal independent component analysis of functional MRI data containing a pair of task-related waveforms. Hum Brain Mapp. 2001;13: 43–53.5.
5- Boubela RN, Kalcher K, Huf W, Kronnerwetter C, Filzmoser P, Moser E. Beyond Noise: Using Temporal ICA to Extract Meaningful Information from High-Frequency fMRI Signal Fluctuations during Rest. Front Hum Neurosci. 2013;7: 168.6.
6- Glasser MF, Coalson TS, Bijsterbosch JD, Harrison SJ, Harms MP, Anticevic A, et al. Using temporal ICA to selectively remove global noise while preserving global signal in functional MRI data. Neuroimage. 2018;181: 692–717.7.
7- Hyvärinen A. Fast and robust fixed-point algorithms for independent component analysis. IEEE Trans Neural Netw. 1999;10: 626–634.8.
8- Chang C, Cunningham JP, Glover GH. Influence of heart rate on the BOLD signal: the cardiac response function. Neuroimage. 2009;44: 857–869.9.
9- Birn RM, Diamond JB, Smith MA, Bandettini PA. Separating respiratory-variation-related fluctuations from neuronal-activity-related fluctuations in fMRI. Neuroimage. 2006;31: 1536–1548.10.
10- Golestani AM, Chang C, Kwinta JB, Khatamian YB, Jean Chen J. Mapping the end-tidal CO2 response function in the resting-state BOLD fMRI signal: spatial specificity, test-retest reliability and effect of fMRI sampling rate. Neuroimage. 2015;104: 266–277.11.
11- Falahpour M, Refai H, Bodurka J. Subject specific BOLD fMRI respiratory and cardiac response functions obtained from global signal. Neuroimage. 2013;72: 252–264.12.
12- Jenkinson M, Bannister P, Brady M, Smith S. Improved optimization for the robust and accurate linear registration and motion correction of brain images. Neuroimage. 2002;17: 825–841.13.
13- Afyouni S, Nichols TE. Insight and inference for DVARS. Neuroimage. 2018;172: 291–312.
Figures